|
|
|
报告导航:研究报告—
制造业—材料
|
|
2014-2017年全球及中国铝热传输复合材料行业研究报告 |
 |
字数:2.8万 |
页数:97 |
图表数:93 |
|
中文电子版:8000元 |
中文纸版:4000元 |
中文(电子+纸)版:8500元 |
|
英文电子版:2200美元 |
英文纸版:2300美元 |
英文(电子+纸)版:2500美元 |
|
编号:CYH033
|
发布日期:2015-03 |
附件:下载 |
 |
|
|
铝热传输复合材料(铝板、带、箔等)主要应用于汽车、家电、机械设备的热交换系统及火力电站空冷系统等领域。受下游产业拉动,2006-2014年全球铝热传输复合材料产量以年均6.1%的速度平稳增长。2014年其产量达到138万吨,同比增长4.5%,增幅较2013年减少1.1个百分点。
中国是全球铝热传输复合材料主要消费市场,2014年中国需求量约为59.19万吨。这主要受益于中国汽车轻量化及机械装备等行业需求拉动,预计2017年中国铝热传输复合材料需求量有望达到85万吨。
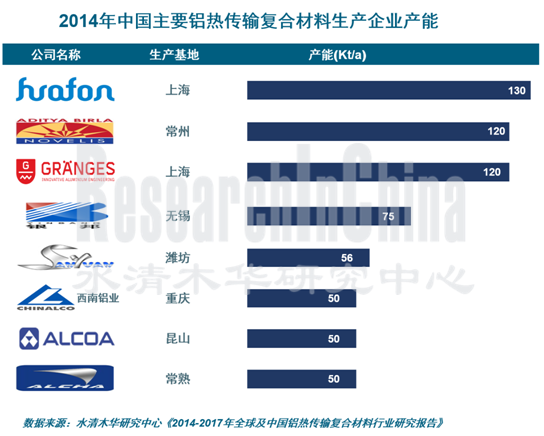
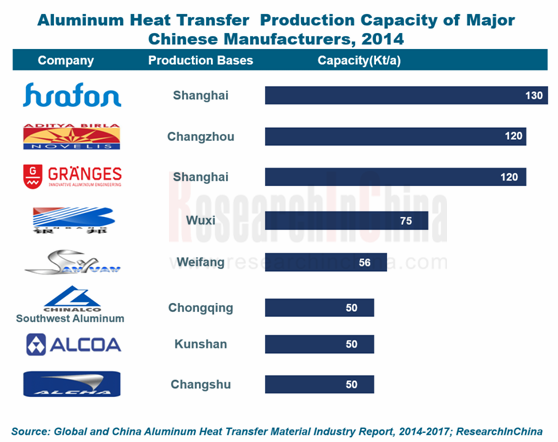
当前,中国铝热传输复合材料生产企业主要以外资或合资企业为主,2014年占中国总产能的60%以上。相比之下,中国本土企业受技术等限制,规模较小、市场竞争力较弱。
Gränges是Orkla集团旗下专门负责铝热传输复合材料业务的全资子公司,现已具备年产21.0万吨铝热传输复合材料的能力。格朗吉斯铝热传输(上海)有限公司为其在华生产基地,产能为12万吨/年;未来Gränges还计划在中国建设第二家工厂。
Novelis是美国主要铝热传输复合材料生产企业。2014年10月,公司在中国首家汽车铝板热处理制造厂竣工投产,年产能达12万吨/年。
华峰日轻为中日合资企业,是目前中国产能最大的铝热传输复合材料厂商。2014年底,公司二期年产5万吨民用空调铝合金复合材料项目投产,使公司铝热传输材料总产能达到13万吨/年。
银邦股份是中国最大铝基多金属复合材料的生产企业,2014年已具备2万吨/年的铝基多金属复合材料的生产能力。公司年产20万吨层压式金属复合材料扩建项目即将于2015年9月投产,届时其铝基多金属复合材料产能将达到5万吨/年。
水清木华研究中心《2014-2017年全球及中国铝热传输复合材料行业研究报告》着重研究了以下内容:
 全球铝热传输复合材料行业市场供需分析、企业格局等; 全球铝热传输复合材料行业市场供需分析、企业格局等;
中国铝热传输复合材料发展政策、供需分析、竞争格局等;
中国铝热传输复合材料下游主要行业需求现状;
全球7家铝热传输复合材料生产企业经营情况、铝热传输复合材料相关业务及在华发展等;
中国14家铝热传输复合材料生产企业的经营状况、铝热传输复合材料相关业务及发展情况等;
2015-2017年全球及中国铝热传输复合材料行业发展趋势预测等。
Aluminum heat transfer composites (aluminum sheet, strip, and foil, etc.) are mainly used in heat exchange systems of automobiles, home appliances, and machinery and equipment as well as air-cooling systems of thermal power stations. Fuelled by the downstream sectors, the global output of aluminum heat transfer compositespresented an AAGR of 6.1% during 2006-2014, and reached 1.38 million tons in 2014, up 4.5% year on year, a drop of 1.1 percentage points from 2013.
As one of the world's major consumers of aluminum heat transfer composites, China had a demand of approximately 591.9 kt in 2014, which was mainly attributed to the growth in demand from industries like automotive lightweightas well as machinery and equipment. It is predicated that by 2017 China’s demand for aluminum heat transfer composites will reach 850 kt.
At present, aluminum heat transfer composites manufacturers in China are mainly the foreign-funded companies or joint-ventures, which contributed more than 60% of the total capacity in China. By contrast, the Chinese enterprises, restricted by some factors like technology, have a small scale, thereby making them less competitive.
Gränges, Orkla's wholly-owned subsidiary that specializes in aluminum heat transfer composites business, now has achieved the capacity of 210 kt/a aluminum heat transfer composites. Gränges Aluminum Heat Transfer (Shanghai) Co., Ltd., a production base of Gränges in China, has the annual capacity of 120kt; in future, the company will plan to construct its second factory in China.
Novelis is a majoraluminum heat transfer composites manufacturer in the United States. In October 2014, the company's first automotive aluminum heat treatmentmanufactory in China was completed and put into operation, with its capacity of 120 kt/a.
Huafon Nikkei, a Sino-Japanese joint venture, is so far the largest aluminum heat transfer composites manufacturer by capacity in China. In late 2014, the company's 50 kt/a civilair-conditioning aluminum alloy composites project (phase II) went into operation, which helped raise its total capacity of aluminum heat transfer composites to 130 kt/a.
As the largest aluminum-based multi-metal composites manufacturer in China, Yinbang boasts the capacity of 20 kt/a aluminum-based multi-metal composites. The company’s 200 kt/a aluminum-based laminated metal composites expansion project will be put into production in September 2015, when its aluminum-based multi-metal composites capacity will amount to 50 kt/a.
The report is primarily concerned with the following:
 Market supply & demand and competitive landscape, etc. of the global aluminum heat transfer composites industry; Market supply & demand and competitive landscape, etc. of the global aluminum heat transfer composites industry;
Policies about development, supply and demand, competitive landscape, etc. of China aluminum heat transfer composites industry;
Main downstream demand for China's aluminum heat transfer composites;
Operation, aluminum heat transfer composites business, and development in China, etc. of 7 global aluminum heat transfer composites manufacturers;
Operation, aluminum heat transfer composites business, and development, etc. of 14 Chinese aluminum heat transfer composites manufacturers;
Development prospects, etc. of global and China aluminum heat transfer composites industry in 2015-2017.
第一章 铝热传输复合材料概述
1.1 定义
1.2 分类
1.3 产业链
1.4 生产工艺
第二章 全球铝热传输复合材料行业发展现状
2.1 概述
2.2 供给
2.3 需求
2.4 企业格局
第三章 中国铝热传输复合材料行业发展现状
3.1 政策
3.2 产业环境
3.3 供给
3.4 需求
第四章 中国铝热传输复合材料主要下游行业需求
4.1 汽车行业
4.2 机械装备
4.3 电站空冷系统行业
4.4 家用电器行业
第五章 全球铝热传输复合材料生产企业
5.1 ALCOA
5.1.1 企业简介
5.1.2 经营情况
5.1.3 营收构成
5.1.4 研发
5.1.5 铝热传输复合材料业务
5.1.6 在华业务
5.1.7 美铝昆山铝业有限公司
5.2 Wickeder
5.2.1 企业简介
5.2.2 铝热传输复合材料业务
5.2.3 在华业务
5.3 Gränges(Sapa Heat Transfer)
5.3.1 企业简介
5.3.2 经营情况
5.3.3 营收构成
5.3.4 在华业务
5.3.5 格朗吉斯铝热传输(上海)有限公司(原萨帕铝热传输(上海)有限公司)
5.4 Norsk Hydro
5.4.1 企业简介
5.4.2 经营情况
5.4.3 营收构成
5.4.4 研发
5.4.5 铝热传输复合材料业务
5.4.6 在华业务
5.5 Aleris
5.5.1 企业简介
5.5.2 经营情况
5.5.3 营收构成
5.5.4 铝热传输材料业务
5.5.5 在华业务
5.6 Novelis
5.6.1 企业简介
5.6.2 经营情况
5.6.3 铝热传输材料相关业务
5.6.4 在华业务
5.7 Kobe Steel
5.7.1 企业简介
5.7.2 经营情况
5.7.3 营收构成
5.7.4 铝热传输材料业务
5.7.5 在华业务
第六章 中国铝热传输复合材料生产企业
6.1银邦金属复合材料股份有限公司 (300337)
6.1.1 企业简介
6.1.2 经营情况
6.1.3 营收构成
6.1.4 毛利率
6.1.5 产能与产销量
6.1.6 客户与供应商
6.1.7 研发与在建项目
6.1.8 业务拓展
6.1.9 发展前景
6.2 江苏常铝铝业股份有限公司(002160)
6.2.1 企业简介
6.2.2 经营情况
6.2.3 营收构成
6.2.4 产销量
6.2.5 在建项目
6.2.6 发展前景
6.3 东北轻合金有限责任公司
6.3.1 企业简介
6.3.2 经营情况
6.3.3 营收构成
6.3.4 毛利率
6.3.5 铝合金产销量
6.3.6 在建项目
6.3.7 发展前景
6.4 西南铝业(集团)有限责任公司
6.4.1 企业简介
6.4.2 经营情况
6.5 华峰日轻铝业股份有限公司
6.5.1 企业简介
6.5.2 铝热传输复合材料业务
6.6 南通华特铝热传输材料有限公司
6.6.1 企业简介
6.6.2 产能
6.6.3 研发
6.7 江苏财发铝业股份有限公司
6.7.1 公司简介
6.7.2 经营情况
6.8 潍坊三源铝业有限公司
6.9 南通恒秀铝热传输材料有限公司
6.9.1 企业简介
6.9.2 经营情况
6.10哈尔滨松润金属制品有限公司
6.10.1 企业简介
6.10.2 铝热传输材料业务
6.11 长沙众兴新材料科技有限公司
6.12 其他企业
6.12.1 上海萨新汽车热传输材料有限公司
6.12.2 无锡冠云铝业有限公司
6.12.3 镇江源龙铝业有限责任公司
第七章 结论与预测
7.1 企业
7.2 预测
7.2.1 全球市场
7.2.2 中国市场
1 Overview of Aluminum Heat Transfer Composites
1.1 Definition
1.2 Classification
1.3 Industry Chain
1.4 Production Technology
2 Status Quo of Global Aluminum Heat Transfer Composites Industry
2.1 Overview
2.2 Supply
2.3 Demand
2.4 Competition among Companies
3 Status Quo of China's Aluminum Heat Transfer Composites Industry
3.1 Policy
3.2 Industry Environment
3.3 Supply
3.4 Demand
4 Major Downstream Demand for Aluminum Heat Transfer Composites in China
4.1 Automobile Industry
4.2 Machinery and Equipment
4.3 Air Cooling Systems of Power Plants
4.4 Household Appliances
5 Global Aluminum Heat Transfer Composites Manufacturers
5.1 ALCOA
5.1.1 Profile
5.1.2 Operation
5.1.3 Revenue Structure
5.1.4 R&D
5.1.5 Aluminum Heat Transfer Composites Business
5.1.6 Business in China
5.1.7 Alcoa Kunshan Aluminum Products Co., Ltd.
5.2 Wickeder
5.2.1 Profile
5.2.2 Aluminum Heat Transfer Composites Business
5.2.3 Business in China
5.3 Gränges(Sapa Heat Transfer)
5.3.1 Profile
5.3.2 Operation
5.3.3 Revenue Structure
5.3.4 Business in China
5.3.5 Granges Aluminum Heat Transfer (Shanghai) Co., Ltd. (formerly known as Sapa Heat Transfer (Shanghai) Ltd.)
5.4 Norsk Hydro
5.4.1 Profile
5.4.2 Operation
5.4.3 Revenue Structure
5.4.4 R&D
5.4.5 Aluminum Heat Transfer Composites Business
5.4.6 Business in China
5.5 Aleris
5.5.1 Profile
5.5.2 Operation
5.5.3 Revenue Structure
5.5.4 Aluminum Heat Transfer Composites Business
5.5.5 Business in China
5.6 Novelis
5.6.1 Profile
5.6.2 Operation
5.6.3 Aluminum Heat Transfer Composites Business
5.6.4 Business in China
5.7 Kobe Steel
5.7.1 Profile
5.7.2 Operation
5.7.3 Revenue Structure
5.7.4 Aluminum Heat Transfer Composites Business
5.7.5 Business in China
6 Aluminum Heat Transfer Composites Manufacturers in China
6.1 Yinbang Clad Material (300337)
6.1.1 Profile
6.1.2 Operation
6.1.3 Revenue Structure
6.1.4 Gross Margin
6.1.5 Capacity, Output, and Sales Volume
6.1.6 Customers and Suppliers
6.1.7 R&D and Projects under Construction
6.1.8 Business Expansion
6.1.9 Development Prospects
6.2 Jiangsu ALCHA Aluminium Co., Ltd. (002160)
6.2.1 Profile
6.2.2 Operation
6.2.3 Revenue Structure
6.2.4 Output and Sales Volume
6.2.5 Projects under Construction
6.2.6 Development Prospects
6.3 Northeast Light Alloy Co., Ltd.
6.3.1 Profile
6.3.2 Operation
6.3.3 Revenue Structure
6.3.4 Gross Margin
6.3.5 Aluminum Alloy Output and Sales Volume
6.3.6 Projects under Construction
6.3.7 Development Prospects
6.4 Southwest Aluminum (Group) Co., Ltd.
6.4.1 Profile
6.4.2 Operation
6.5 Huafon Nikkei Aluminium Corporation
6.5.1 Profile
6.5.2 Aluminum Heat Transfer Composites Business
6.6 Nantong Hua Te Aluminum Heat Transfer Co., Ltd.
6.6.1 Profile
6.6.2 Capacity
6.6.3 R&D
6.7 Jiangsu Caifa Aluminum Co., Ltd.
6.7.1 Profile
6.7.2 Operation
6.8 Weifang Sanyuan Aluminum Co., Ltd.
6.9 Nantong Hengxiu Aluminum Heat Transfer Material Co., Ltd.
6.9.1 Profile
6.9.2 Operation
6.10 Harbin Song Run Metal Products Co., Ltd.
6.10.1 Profile
6.10.2 Aluminum Heat Transfer Composites Business
6.11 Changsha Zhongxing New Material Co., Ltd.
6.12 Others
6.12.1 Shanghai Saxin Automotive Heat Transfer Material Co., Ltd.
6.12.2 Wuxi Guanyun Aluminum Co., Ltd.
6.12.3 Zhenjiang Yuanlong Aluminum Co., Ltd.
7 Conclusion and Forecast
7.1 Enterprises
7.2 Forecast
7.2.1 Global Market
7.2.2 Chinese Market
图:铝合金复合材料结构及性能
图:铝基多金属复合材料结构
图:铝基层状金属复合材料产业链
图:2006-2014年全球铝热传输材料产量
图:2006-2014年全球铝热传输复合材料需求量
表:2014年全球主要铝热传输复合材料生产企业营业收入及相关单元营业收入
表:2006-2014年中国铝热传输复合材料相关政策
图:2006-2014年中国铝材产量及同比增长
图:2006-2014年中国铝合金产量及同比增长
图:2006-2014年中国铝热传输复合材料产能
表:2006-2014年中国铝热传输复合材料(分产品)产能
图:2006-2014年中国铝热传输复合材料需求量
表:2006-2014年中国铝热传输材料(分产品)需求量
表:汽车各零部件铝热传输复合材料用量
表:2000-2017年中国汽车产量及保有量及铝合金复合材料需求量
表:2010-2017年中国各种机械装备产量及铝热传输复合材料需求量
表:2011-2017年中国火电站新增装机容量及铝传热复合材料需求量
表:2011-2017年中国空调产量及铝热传输复合材料需求量
图:2007-2014年Alcoa收入与净利润
图:2012-2014年Alcoa(分业务)主营业务收入
表:2010-2013年Alcoa(分国家/地区)净收入及构成
图:2007-2014年Alcoa研发投入及构成
表:2009-2014年Alcoa Global Rolled Products净收入与利润
表:2014年Alcoa铝轧制产品(分国家/地区)子公司及产品
图:2009-2013年Alcoa在中国净收入及占比
表:2014年wickeder集团EMS部门主要产品及应用领域
图:1896-2013年Gränges发展历史
图:2014年Gränges公司地区分布及市场份额
图:2011-2014年Granges公司营业收入与营业利润
图:2013-2014年Granges销量
表:2011-2014年Gränges (分地区)净收入
图:1999-2014年格朗吉斯铝热传输(上海)有限公司热交换器材料产能
图:2009-2014年Norsk Hydro营业收入与净利润
表:2011-2014年Norsk Hydro(分业务)营业收入
图:2013年Norsk Hydro(分国家/地区)营业收入构成
图:2011-2013年Norsk Hydro研发投入及占比
表:2014年Norsk hydro公司Rolling mills(分工厂)产品及产能
表:2012-2013年Norsk Hydro铝热传输业务单元分布
图:2010-2014年Norsk Hydro公司 Rolled Products业务营业收入及利润
表:2011-2014年Norsk Hydro公司Rolled Products(分下游)销量
表:2011-2013年Norsk Hydro公司Rolled Products(分工厂)外部市场产量
图:2008-2014年Aleris营业收入与净利润
表:2010-2014年Aleris(分业务)营业收入及构成
表:2010-2013年Aleris(分地区)营业收入及构成
表:2010-2014年Aleris铝轧制品(分业务)营业收入
表:2010-2014年Aleris铝轧制品(分业务)销量
表:2014年Aleris在华子公司
图:2007-2014财年Novelis营业收入及净利润
表:2013-2014财年Novelis公司Rolled Products产品(分地区)总出货量
图:2014财年&2020财年Novelis公司Rolled Products业务(分下游)出货量构成
图:2014年Kobe Steel公司业务结构
图:2008-2014财年神户钢铁销售额及净利润
表:FY2013-FY2014财年Kobe Steel公司(分业务)净收入及构成
图:2013财年Kobe Steel公司(分地区)净收入构成
图:2011-2013财年Kobe Steel公司在华净收入及占比
图:2015年Kobe Steel公司在中国子公司及业务
图:2008-2014年银邦股份营业收入与净利润
图:2008-2014年银邦股份(分业务)主营业务收入
图:2008-2014年银邦股份(分地区)主营业务收入
图:2008-2014年银邦股份(分业务)毛利率
表:2013-2017年银邦股份(分产品)产能
表:2011-2013年银邦股份(分下游)产销量
表:2014H1银邦股份前五名客户名称及营业收入贡献
图:2009-2014年银邦股份研发投入及占比
表:2015年银邦股份主要在建项目
表:2013-2017年银邦股份营业收入与净利润
图:2008-2014年常铝股份营业收入与净利润
图:2008-2014年常铝股份(分产品)主营业务收入
图:2008-2014年常铝股份(分地区)主营业务收入
表:2015年常铝股份在建项目
表:2013-2017年常铝股份营业收入与净利润
表:2014年东北轻合金有限责任公司下属企业及其业务
图:2010-2014年东北轻合金营业收入与净利润
表:截至2014年底东北轻合金生产线
表:2010-2013年东北轻合金公司铝合金(分产品)主营业务收入及构成
图:2010-2013年东北轻合金(分产品)毛利率
表:2010-2013年东北轻合金铝合金(分产品)产能及产量
表:2010-2013年东北轻合金公司铝合金(分产品)销量、产销率及价格
表:截至2014年底东北轻合金主要在建项目
表:2013-2017年东北轻合金营业收入与净利润
图:2012-2014年西南铝业营业收入与净利润
图:2011年西南铝业(分产品)营业收入构成
表:2010-2014年华峰铝业铝热传输材料重点项目
图:2005-2014年南通华特铝热传输复合材料产能
图:2011-2014年财发铝业营业收入与净利润
表:2013年三源铝业重点项目
表:南通恒秀主要客户
表:2014年冠云铝业主要产品及应用领域
表:2013年龙源铝业各种铝热传输产品产能
图:2013-2014年全球及中国主要铝热传输复合材料生产企业营业收入
表:2014年中国铝热传输材料主要生产企业产能
表:2013-2017年全球铝热传输复合材料产量及需求量
表:2013-2017年中国铝热传输复合材料产能及需求量
Structure and Properties of Aluminum Alloy Composites
Structure of Aluminum-based Multi-metal Composites
Industrial Chain of Aluminum-based Laminated Metal Composites
Global Output of Aluminum Heat Transfer Composites, 2006-2014
Global Demand for Aluminum Heat Transfer Composites, 2006-2014
Revenue of Major global Aluminum Heat Transfer Composites Manufacturers and from the Related Business, 2014
Policies on Aluminum Heat Transfer Composites in China, 2006-2014
China's Aluminum Output and YoY Growth, 2006-2014
China's Aluminum Alloy Output and YoY Growth, 2006-2014
Capacity of Aluminum Heat Transfer Composites in China, 2006-2014
Capacity of Aluminum Heat Transfer Composites in China (by Product), 2006-2014
Demand for Aluminum Heat Transfer Composites in China, 2006-2014
Demand for Aluminum Heat Transfer Composites in China (by Product), 2006-2014
Quantity of Aluminum Heat Transfer Composites Used in Automotive Parts
Automobile Output & Ownership and Demand for Aluminum Alloy Composites in China, 2000-2017E
Machinery & Equipment Output and Demand for Aluminum Heat Transfer Composites in China, 2010-2017E
Newly Installed Capacity of Thermal Power Stations and Demand for Aluminum Heat Transfer Composites in China, 2011-2017E
China’s Air-conditioner Output and Demand for Aluminum Heat Transfer Composites, 2011-2017E
Alcoa’s Revenue and Net Income, 2007-2014
Alcoa’s Operating Revenue (by Business), 2012-2014
Alcoa’s Net Revenue Structure (by Country/Region), 2010-2013
Alcoa’s R&D Expenditure and Structure, 2007-2014
Alcoa’s Net Revenue and Profit of Rolled Products, 2009-2014
Alcoa’s Aluminum Rolled Product Subsidiaries and Products (by Country/Region), 2014
Alcoa’s Net Revenue in China and % of Total Revenue, 2009-2013
Main Products and Applications of Wickeder's EMS Division, 2014
Gränges' Development History, 1896-2013
Granges' Geographical Distribution and Market Share, 2014
Granges' Revenue and Operating Income, 2011-2014
Granges' Sales Volume, 2013-2014
Gränges' Net Income (by Region), 2011-2014
Heat Exchanger Material Capacity of Gränges Aluminum Heat Transfer (Shanghai), 1999-2014
Revenue and Net Income of Norsk Hydro, 2009-2014
Revenue Breakdown of Norsk Hydro (by Business), 2011-2014
Revenue Structure of Norsk Hydro (by Country/Region), 2013
Norsk Hydro's R&D Costs and % of Total Revenue, 2011-2013
Rolling Products and Capacity of Norsk Hydro (by Factory), 2014
Norsk Hydro's Aluminum Heat Transfer Business Distribution, 2012-2013
Rolled Product Revenue and Profit of Norsk Hydro, 2010-2014
Norsk Hydro's Rolled Product Sales Volume (by Application), 2011-2014
Norsk Hydro's Rolled Product Output for External Markets (by Factory), 2011-2013
Aleris’ Revenue and Net Income, 2008-2014
Aleris’ Revenue Structure (by Business), 2010-2014
Aleris’ Revenue Structure (by Region), 2010-2013
Aleris’ Aluminum Rolled Product Revenue (by Business), 2010-2014
Aleris’ Aluminum Rolled Product Sales Volume (by Business), 2010-2014
Aleris’ Subsidiaries in China, 2014
Revenue and Net Income of Novelis, FY2007-FY2014
Novelis' Total Shipments of Rolled Products (by Region), FY2013-FY2014
Novelis' Shipment Structure of Rolled Products (by Application), FY2014 & FY2020
Business Structure of Kobe Steel, 2014
Revenue and Net Income of Kobe Steel, FY2008-FY2014
Kobe Steel's Net Revenue Structure (by Business), FY2013-FY2014
Kobe Steel's Net Revenue Structure (by Region), FY2013
Kobe Steel's Net Revenue in China and % of Total Revenue, FY2011-FY2013
Kobe Steel's Subsidiaries and Businesses in China, 2015
Yinbang’s Revenue and Net Income, 2008-2014
Yinbang’s Operating Revenue (by Business), 2008-2014
Yinbang’s Operating Revenue (by Region), 2008-2014
Yinbang’s Gross Margin (by Business), 2008-2014
Yinbang’s Capacity (by Product), 2013-2017E
Yinbang’s Output and Sales Volume (by Application), 2011-2013
Name List and Revenue Contribution of Yinbang’s Top 5 Clients, 2014H1
Yinbang’s R&D Costs and % of Total Revenue, 2009-2014
Yinbang’s Major Projects under Construction, 2015
Yinbang’s Revenue and Net Income, 2012-2017E
ALCHA’s Revenue and Net Income, 2008-2014
ALCHA’s Operating Revenue (by Product), 2008-2014
ALCHA’s Operating Revenue (by Region), 2008-2014
ALCHA’s Projects under Construction, 2015
ALCHA’s Revenue and Net Income, 2012-2017E
Northeast Light Alloy's Subsidiaries and Their Businesses, 2014
Revenue and Net Income of Northeast Light Alloy, 2010-2014
Production Lines of Northeast Light Alloy, by the end of Sep. 2014
Aluminum Alloy Operating Revenue Structure of Northeast Light Alloy (by Product), 2010-2013
Gross Margin of Northeast Light Alloy (by Product), 2010-2013
Aluminum Alloy Capacity and Output of Northeast Light Alloy (by Product), 2010-2013
Aluminum Alloy Sales Volume, Sales-Output Ratio and Prices of Northeast Light Alloy (by Product), 2010-2013
Northeast Light Alloy's Major Projects under Construction, by the end of Sep. 2014
Revenue and Net Income of Northeast Light Alloy, 2013-2017E
Revenue and Net Income of Southwest Aluminum, 2012-2014
Revenue Structure of Southwest Aluminum (by Product), 2011
Huafon’s Key Aluminum Heat Transfer Composites Projects, 2010-2014
Capacity of Aluminum Heat Transfer Composites of Nantong Hua Te, 2005-2014
CAIFA Aluminum's Revenue and Net Income, 2011-2014
Key Projects of Sanyuan Aluminum, 2013
Major Clients of Nantong Hengxiu
Major Products and Applications of Guanyun Aluminum, 2014
Capacity of Aluminum Heat Transfer Products of Zhenjiang Yuanlong Aluminum, 2013
Revenue of Main Global and Chinese Aluminum Heat Transfer Composites Manufacturers, 2013-2014
Capacity of Major Aluminum Heat Transfer Composites Enterprises in China, 2014
Global Aluminum Heat Transfer Composites Output and Demand, 2013-2017E
China’s Aluminum Heat Transfer Composites Capacity and Demand, 2013-2017E
如果这份报告不能满足您的要求,我们还可以为您定制报告,请 留言说明您的详细需求。
|