|
|
|
报告导航:研究报告—
制造业—能源矿产
|
|
2015-2018年中国加油站与加气站行业研究报告 |
 |
字数:4.0万 |
页数:180 |
图表数:178 |
|
中文电子版:8500元 |
中文纸版:4250元 |
中文(电子+纸)版:9000元 |
|
英文电子版:2400美元 |
英文纸版:2550美元 |
英文(电子+纸)版:2700美元 |
|
编号:WLQ028
|
发布日期:2015-04 |
附件:下载 |
 |
|
|
加油站
截至2014年底,中国共有9.9万座加油站,平均每座加油站服务的民用汽车数量为1,456辆。截至2014年底,山东、河北、河南、广东、江苏等地加油站数量排名前五,其中山东加油站数量达到1万座(其民用汽车保有量全国第一,民用汽车保有量增速也保持较快增长)。从平均每座加油站服务的民用汽车来看,北京、浙江、天津、广东、江苏等地平均每座加油站服务的民用汽车数量均超过2000,其中北京平均每座加油站服务的民用汽车数量达到4,900辆。
从企业来看,中国石化加油站数量仍保持全国第一,截至2014年底,公司共有30,551座加油站,其中自营加油站30,538座,特许经营加油站为13座,公司加油站数量在全国中占比31.0%。。
自2014年2月,中石化最先宣布在成品油销售领域引入民资后,各个国有油气巨头(中石油、中海油等)均不断推进混合所有制改革。其中,中石化的混合所有制改革是通过出售其销售公司29.99%的股权实现。中石油混合所有制改革推进到垄断程度最高的上游油气开采领域。随着,更多资本进入油气行业,特别是销售领域,加油站的经营模式(如新建,收购,租赁,合资合作和特许经营等)和服务模式(引入互联网,向合作伙伴互相开放平台,向生活服务的各个领域渗透)将进一步优化,并且新的商业模式将不断出现,加油站行业利润空间将进一步增加。
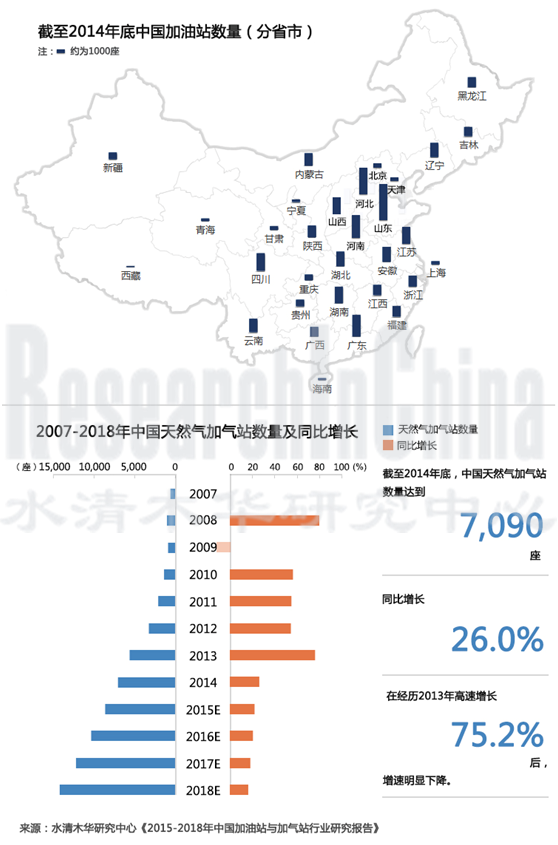
加气站
2012年之前,中国天然气汽车主要为CNG汽车,随着LNG汽车的环保性、经济性、安全性等特性得到认可,2012年以来,各地(如山东、新疆、河北、广东等)大力推广和普及LNG汽车(包括重卡、城市公交、公路客车)。受益于LNG汽车大量推广和LNG加气站相关技术成熟,2012年以来,中国LNG加气站快速增长,从2011年的241座增加到2014年的2500座。2012 年10月 《天然气利用政策》 首次将双燃料及LNG汽车为优先类天然气用户,并规定对优先类用气项目的加气站建设,地方多级政府可在规划用地、融资、收费等方面出台扶持政策给予鼓励支持。预计未来,天然气加气站特别是LNG加气站仍将保持较快发展。
目前全球正大力推广清洁能源(天然气等)和新能源汽车(纯电动汽车、插电式混合动力汽车、燃料电池汽车等),未来10年,传统燃料汽车、清洁能源汽车、新能源汽车将长期共存。未来,越来越多加油站将进一步丰富能源结构,布局“油+气”、“油+电”、“油+气+电”等业态模式,向综合能源服务站转型。
水清木华研究中心《2015-2018年中国加油站及加气站行业研究报告》着重研究了以下内容:
 加油站行业概况(包括定义,分类,主要客户及消费习惯,国内外加油站经营模式和策略等) 加油站行业概况(包括定义,分类,主要客户及消费习惯,国内外加油站经营模式和策略等)
中国成品油与加油站市场(包括汽油、柴油产销量,价格走势,成品油经营企业,加油站数量、分布、竞争格局等)
中国机动车与加油站市场(包括汽车等机动车销量和保有量,平均每座加油站服务的机动车和汽车数量)
全球及中国加气站市场(包括市场概况,全球及中国天然气汽车保有量,全球及中国天然气加气站数量、竞争格局、发展前景等)
全球及中国加油站行业主要企业(如壳牌石油、BP、中国石化、中国石油等)分析(包括营业收入、营收构成、净利润、毛利率、成品油销量、加油站业务等)
Filling Stations
By the end of 2014, China had run a total of 99,000 filling stations, each of which served 1,456 civilian cars; Shandong, Hebei, Henan, Guangdong and Jiangsu ranked top five by the number of filling stations, especially Shandong province had 10,000 ones (it also held the most civilian cars in China with a fast growth rate). In terms of the number of civilian cars served by a filling station, Beijing, Zhejiang, Tianjin, Guangdong and Jiangsu saw each filling station support more than 2,000 civilian cars, particularly Beijing even witnessed 4,900.
Regarding enterprises, Sinopec occupies 31.0% of filling stations in the country, remaining first by number. As of the end of 2014, it had possessed 30,551 filling stations, including 30,538 self-operated ones and 13 franchised ones.
Since Sinopec took the lead to introduce private capital to the field of refined oil products in February 2014, state-owned oil and gas giants (PetroChina, CNOOC, etc.) have been constantly promoting mixed ownership reforms. Sinopec sells its 29.99% stake of its sales companies to realize its mixed ownership reform. PetroChina deepens the reform to the highly monopolized oil and gas exploitation field. As more capital rushes into the oil and gas industry, particularly in the marketing field, the operating modes (such as startup, acquisition, leasing, joint ventures and franchising, etc.) and service modes (introduction of the Internet, open platforms for partners, penetration in all life services) of filling stations will be further optimized, new business models will mushroom, and the filling station industry will seize higher profit margins.
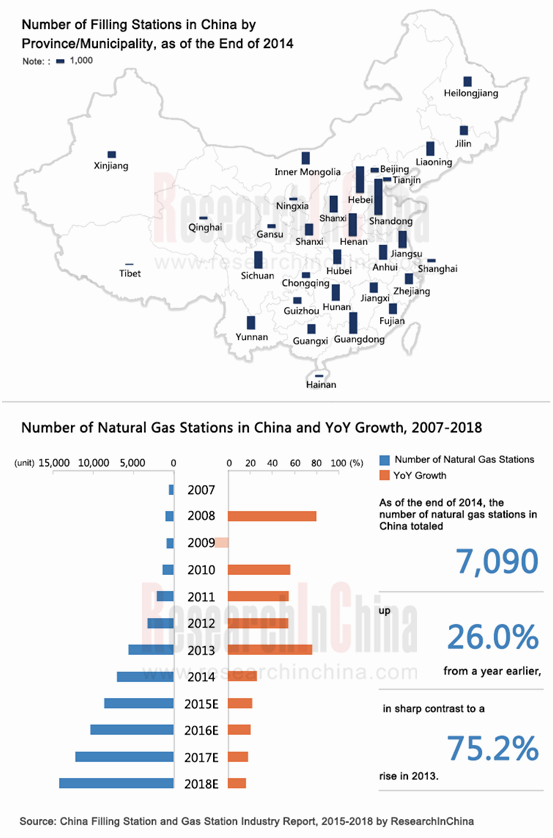
Gas Stations
Before 2012, China's natural gas vehicles were mainly CNG ones. Given LNG vehicles are widely accepted by virtue of environmental friendliness, economical efficiency, security and other features, Shandong, Xinjiang, Hebei, Guangdong, etc. have boosted and popularized LNG vehicles (including heavy trucks, city buses, highway buses) since 2012. Thanks to the wide promotion of LNG vehicles and the maturity of technologies about LNG gas stations, the number of Chinese LNG gas stations jumped from 241 in 2011 to 2,500 in 2014. In October 2012, Natural Gas Utilization Policy defined dual-fuel and LNG vehicles as priority natural gas applications for the first time, stipulated that for the construction of gas stations used for priority projects, and local governments were allowed to issue incentive policies concerning land, financing, charges, etc.. In the future, natural gas stations, particularly LNG gas stations, will maintain rapid growth.
Currently, the world is prompting clean energy (natural gas, etc.) and new energy vehicles (battery electric vehicle, plug-in hybrid electric vehicle, fuel cell vehicle, etc.). In the next decade, traditional fuel vehicles, clean energy vehicles and new energy vehicles will coexist. More and more filling stations will further enrich the energy structure, deploy "oil + gas", "oil + electricity", "oil + gas + electricity" and other modes, and transfer towards integrated energy service stations.
The report highlights the followings:
 Overview of the filling station industry (including definition, classification, major clients and consumption habits, business models and strategies of filling stations at home and abroad, etc.) Overview of the filling station industry (including definition, classification, major clients and consumption habits, business models and strategies of filling stations at home and abroad, etc.)
Chinese refined oil and filling station market (embracing gasoline and diesel output and sales volume; price trend; refined oil enterprises; number, distribution and competition pattern of filling stations; etc.)
Chinese motor vehicle and filling station market (involving sales volume and ownership of automobiles; the number of motor vehicles and automobiles served by each filling station)
Global and Chinese gas station market (such as market overview; natural gas vehicle ownership; number, competition pattern and development prospect of natural gas stations, etc.)
Analysis (revenue, revenue structure, net income, gross margin, refined oil sales volume, filling station business, etc.) on leading companies (Shell, BP, Sinopec, PetroChina, etc.) in global and China filling station industry.
第一章 加油站行业概况
1.1 定义和分类
1.1.1 定义
1.1.2 分类
1.2 主要客户及消费特点
1.3 国内外加油站经营模式和策略
1.3.1经营模式(按主体)
1.3.2 欧洲加油站经营模式(按业务)
1.3.3 美国加油站经营模式(按业务)
1.3.4 日本加油站经营模式(按业务)
1.3.5 中国加油站经营策略
第二章 中国成品油与加油站市场
2.1 成品油产销量
2.2 成品油细分产品产销量
2.2.1 柴油
2.2.2 汽油
2.2.3 煤油
2.3 成品油价格走势
2.3.1 概况
2.3.2 汽油价格走势
2.3.3 柴油价格走势
2.4 成品油经营企业
2.4.1 相关政策
2.4.2 分销企业
2.4.3 从业人员
2.4.4 经营情况
2.5 加油站
2.5.1 加油站数量及分布
2.5.2 非油品业务
2.5.3 连锁加油站
2.5.4 竞争格局
2.5.5 发展趋势
第三章 中国机动车与加油站市场
3.1 机动车保有量
3.1.1 整体市场
3.1.2 区域市场
3.2 汽车销量
3.2.1 整体市场
3.2.2 新能源汽车销量
3.3 汽车保有量
3.3.1 整体市场
3.3.2 区域市场
3.4 加油站与机动车市场
3.4.1 加油站与机动车数量对比
3.4.2 平均每座加油站服务的机动车数量
第四章 全球及中国加气站市场
4.1 市场概况
4.1.1 概况
4.1.2 天然气加气站
4.1.3 液化石油气(LPG)加气站
4.2 天然气汽车
4.2.1 市场概况
4.2.2 全球市场
4.2.3 中国市场
4.3 天然气加气站
4.3.1 全球市场
4.3.2 中国市场
4.4 竞争格局
4.4.1 企业竞争
4.4.2 区域竞争
4.5 发展前景
第五章 全球主要加油站经营企业
5.1 壳牌石油
5.1.1 公司简介
5.1.2 经营业绩
5.1.3 营收构成
5.1.4 油气生产和销售
5.1.5 LNG业务
5.1.6 加油站业务
5.1.7 在华加油站业务
5.1.8 发展战略
5.2 BP
5.2.1 公司简介
5.2.2 经营业绩
5.2.3 营收构成
5.2.4 油气生产和销售
5.2.5 加油站业务
5.2.6 在华加油站业务
5.2.7 发展战略
5.3 埃克森美孚
5.3.1 公司简介
5.3.2 经营业绩
5.3.3 营收构成
5.3.4 油气生产和销售
5.3.5 加油站业务
5.4 道达尔
5.4.1 公司简介
5.4.2 经营业绩
5.4.3 营收构成
5.4.4 油气生产和销售
5.4.5 加油站业务
5.4.6 在华加油站业务
第六章 中国主要加油站经营企业
6.1 中国石化
6.1.1 公司简介
6.1.2 经营业绩
6.1.3 营收构成
6.1.4 毛利率
6.1.5 油气产销量
6.1.6 加油站业务
6.1.7 混合所有制改革
6.1.8 经营计划
6.2 中国石油
6.2.1 公司简介
6.2.2 经营业绩
6.2.3 营收构成
6.2.4 毛利率
6.2.5 油气产销量
6.2.6 加油站业务
6.2.7 经营计划
6.3 中国海洋石油
6.3.1 公司简介
6.3.2 经营业绩
6.3.3 营收构成
6.3.4 加油站业务
6.3.5 发展前景
第七章 总结及预测
7.1 加油站与加气站
7.1.1 加油站与加气站数量
7.1.2 加油站和加气站服务的汽车数量
7.2 上市公司对比
7.2.1 营业收入
7.2.2 净利润
7.2.3 加油站数量
1. Overview of Filling Station Industry
1.1 Definition and Classification
1.1.1 Definition
1.1.2 Classification
1.2 Major Clients and Consumption Characteristics
1.3 Business Models and Strategies of Filling Stations at Home and Abroad
1.3.1 Business Models (By Entity)
1.3.2 Business Models of Filling Stations in Europe (by Business)
1.3.3 Business Models of Filling Stations in the United States (by Business)
1.3.4 Business Models of Filling Stations in Japan (by Business)
1.3.5 Business Strategies of Filling Stations in China
2. Chinese Refined Oil and Filling Station Market
2.1 Refined Oil Output and Sales Volume
2.2 Refined Oil Output and Sales Volume by Segmented Product
2.2.1 Diesel
2.2.2 Gasoline
2.2.3 Kerosene
2.3 Refined Oil Price
2.3.1 Overview
2.3.2 Gasoline
2.3.3 Diesel
2.4 Refined Oil Enterprises
2.4.1 Policies
2.4.2 Distribution Firms
2.4.3 Employees
2.4.4 Operation
2.5 Filling Station
2.5.1 Number and Distribution
2.5.2 Non-oil Business
2.5.3 Filling Station Chain
2.5.4 Competition Pattern
2.5.5 Development Trends
3. Chinese Motor Vehicle and Filling Station Market
3.1 Motor Vehicle Ownership
3.1.1 Overall Market
3.1.2 Regional Market
3.2 Automobile Sales Volume
3.2.1 Overall Market
3.2.2 New Energy Vehicle Sales Volume
3.3 Automobile Ownership
3.3.1 Overall Market
3.3.2 Regional Market
3.4 Filling Station and Motor Vehicle Market
3.4.1 Number Comparison between Filling Stations and Motor Vehicles
3.4.2 Number of Motor Vehicles Served by Each Filling Station
4. Global and Chinese Gas Station Market
4.1 Market Overview
4.1.1 Overview
4.1.2 Natural Gas Station
4.1.3 LPG Station
4.2 Natural Gas Vehicle
4.2.1 Market Overview
4.2.2 Global Market
4.2.3 Chinese Market
4.3 Natural Gas Station
4.3.1 Global Market
4.3.2 Chinese Market
4.4 Competition Pattern
4.4.1 Corporate Competition
4.4.2 Regional Competition
4.5 Development Prospect
5. Global Key Filling Station Companies
5.1 Shell
5.1.1 Profile
5.1.2 Operating Performance
5.1.3 Revenue Structure
5.1.4 Oil and Gas Production and Sale
5.1.5 LNG Business
5.1.6 Filling Station Business
5.1.7 Filling Station Business in China
5.1.8 Development Strategy
5.2 BP
5.2.1 Profile
5.2.2 Operating Performance
5.2.3 Revenue Structure
5.2.4 Oil and Gas Production and Sale
5.2.5 Filling Station Business
5.2.6 Filling Station Business in China
5.2.7 Development Strategy
5.3 ExxonMobil
5.3.1 Profile
5.3.2 Operating Performance
5.3.3 Revenue Structure
5.3.4 Oil and Gas Production and Sale
5.3.5 Filling Station Business
5.4 Total
5.4.1 Profile
5.4.2 Operating Performance
5.4.3 Revenue Structure
5.4.4 Oil and Gas Production and Sale
5.4.5 Filling Station Business
5.4.6 Filling Station Business in China
6. Key Chinese Filling Station Enterprises
6.1 Sinopec
6.1.1 Profile
6.1.2 Operating Performance
6.1.3 Revenue Structure
6.1.4 Gross Margin
6.1.5 Oil and Gas Output and Sales Volume
6.1.6 Filling Station Business
6.1.7 Mixed Ownership Reform
6.1.8 Business Plan
6.2 PetroChina
6.2.1 Profile
6.2.2 Operating Performance
6.2.3 Revenue Structure
6.2.4 Gross Margin
6.2.5 Oil and Gas Output and Sales Volume
6.2.6 Filling Station Business
6.2.7 Business Plan
6.3 CNOOC
6.3.1 Profile
6.3.2 Operating Performance
6.3.3 Revenue Structure
6.3.4 Filling Station Business
6.3.5 Development Prospect
7. Summary and Forecast
7.1 Filling Station and Gas Station
7.1.1 Number of Filling Stations and Gas Stations
7.1.2 Number of Cars Served by Filling Stations and Gas Stations
7.2 Comparison between Listed Companies
7.2.1 Revenue
7.2.2 Net Income
表:加油站按等级分类
表:加油站主要客户消费特点和习惯
图:2006-2018年中国成品油产量及同比增长
图:2006-2018年中国成品油销量及同比增长
图:2006-2018年中国成品油表观消费量及同比增长
图:2006-2014年中国成品油产量构成
图:2006-2014年中国成品油表观消费量构成
图:2006-2014年中国成品油进口依赖度及自给率
图:2006-2014年中国柴油产量及同比增长
图:2006-2014年中国柴油销量及同比增长
图:2006-2014年中国柴油表观消费量及同比增长
图:2006-2014年中国柴油产量及表观消费量在成品油中占比
图:2006-2014年中国汽油产量及同比增长
图:2006-2014年中国汽油销量及同比增长
图:2006-2014年中国汽油表观消费量及同比增长
图:2006-2014年中国汽油产量及表观消费量在成品油中占比
图:2006-2014年中国煤油产量及同比增长
图:2006-2014年中国煤油销量及同比增长
图:2006-2014年中国煤油表观消费量及同比增长
图:2006-2014年中国煤油产量及表观消费量在成品油中占比
图:2009-2014年中国90#无铅汽油批发价及零售价
图:2009-2014年中国93#汽油批发价及零售价
图:2009-2014年中国93#无铅汽油批发价及零售价
图:2009-2014年中国97#汽油批发价及零售价
图:2009-2014年中国93#和97#汽油批发价及零售价价差
图:2009-2014年中国0#号柴油批发价与零售价
图:2009-2014年中国0#号柴油批发价与零售价价差
图:2006-2014年中国成品油批发、仓储及零售企业数量
表:2012-2013年中国国有、民营及外资成品油经营企业数量
表:2012-2013年中国国有、民营及外资成品油批发、仓储、零售企业员工数量
图:2011-2014年中国成品油批发量、仓储量及零售量
图:2006-2018年中国加油站数量及同比增长
图:2012-2014年中国加油站数量(按年零售量分类)
图:2012-2014年中国加油站分区域数量占比
图:2009-2018年中国开展非油品业务的加油站数量及同比增长
图:2009-2018年中国加油站非油品业务收入及同比增长
图:2009-2014年中国连锁加油站总店数量及同比增长
图:2006-2014年中国连锁加油站门店数量及同比增长
图:2006-2014年中国连锁加油站营业面积及同比增长
图:2006-2014年中国连锁加油站雇员数量
图:2006-2014年中国连锁加油站购进额及同比增长
图:2009-2014年中国连锁加油站销售额及同比增长
图:2009-2014年中国连锁加油站销售额与购进额差额
图:2010-2014年中国国有、民营及外资加油站数量市场份额
表:中国加油站市场外资企业进入时间及布局区域
表:截至2014年底中国及主要企业加油站数量(分省市)
图:2006-2018年中国机动车保有量及同比增长
图:2014年中国机动车保有量构成
表:2014年中国各省市机动车保有量及市场份额
图:2006-2018年中国汽车销量及同比增长
图:2006-2018年中国乘用车及商用车销量
图:2006-2014年中国汽车销量构成(按动力)
图:2006-2014年中国乘用车销量构成(按动力)
图:2006-2014年中国商用车销量构成(按动力)
图:2010-2018年中国新能源汽车销量及同比增长
图:2010-2018年中国新能源汽车销量在汽车总销量中占比
图:2011-2014年中国新能源汽车销量构成(分技术路线)
图:2006-2018年中国汽车保有量及同比增长
图:2006-2018年中国民用汽车保有量及同比增长
图:2006-2018年中国每百户城镇家庭家用汽车保有量及同比增长
表:2006-2014年中国民用汽车保有量(分省市)
表:2007-2014年中国民用汽车保有量增速(分省市)
表:2006-2013年中国每百户城镇家庭家用汽车保有量(分省市)
表:2007-2013年中国每百户城镇家庭家用汽车保有量增速(分省市)
图:2006-2018年中国加油站数量,机动车、汽车及民用汽车保有量对比
图:2007-2018年中国加油站数量增速,机动车、汽车及民用汽车保有量增速对比
图:2006-2018年中国平均每座加油站服务的机动车、汽车及民用汽车数量
表:2014年平均每座加油站服务的民用汽车数量(分省市)
表:LNG与CNG的优缺点比较
表:LNG汽车相对于CNG汽车优劣势
表:天然气加气站分类
表:2012-2014年中国天然气汽车相关政策
图:2006-2018年全球天然气汽车保有量及同比增长
表:2006-2013年全球各区域天然气汽车保有量增速
表:2006-2013年全球Top20天然气汽车保有量国家
图:2006-2018年中国天然气汽车保有量及同比增长
图:2006-2018年中国天然气汽车保有量在汽车保有量中占比
图:2011-2018年中国CNG汽车及LNG汽车保有量
图:2007-2018年全球天然气加气站数量及同比增长
表:2007-2013年全球Top20天然气加气站数量国家
图:2007-2018年全球平均每座天然气加气站服务的天然气汽车数量
图:2007-2018年中国天然气加气站数量及同比增长
图:2011-2018年中国CNG加气站及LNG加气站数量
图:2011-2018年中国平均每座加气站服务的天然气汽车数量
表:2012-2013年中国CNG汽车保有量(分省市)
表:2012-2013年中国CNG加气站数量(分省市)
表:2012-2013年中国每座CNG加气站服务的CNG汽车数量(分省市)
图:2009-2014年壳牌石油营业收入及同比增长
图:2009-2014年壳牌石油净利润及同比增长
图:壳牌主要业务
表:2010-2014年壳牌石油营收构成(分业务)
表:2010-2014年壳牌石油营收构成(分区域)
表:2012-2014年壳牌净利润(分业务)
表:2014年壳牌上游业务财务指标
表:2014年壳牌下游业务财务指标
表:2012-2014年壳牌已探明原油和天然气储量(分区域)
表:2012-2014年壳牌原油产量(分区域)
表:2012-2014年壳牌天然气产量(分区域)
表:2009-2014年壳牌油品销量(分产品和区域)
图:2007-2020年壳牌LNG产能
图:壳牌LNG业务地位
表:截至2014年年底壳牌LNG液化工厂分布
表:2012-2014年壳牌LNG销量(分区域)
图:2009-2013年壳牌石油加油站数量(分区域)
图:截至2014年底壳牌石油在华加油站数量(分省市)
图:2009-2014年BP营业收入及同比增长
图:2009-2014年BP净利润及同比增长
图:2008-2013年BP营收构成(分业务)
表:2012-2014年BP上游业务主要财务指标
表:2012-2014年BP下游业务主要财务指标
表:2012-2014年BP其他业务主要财务指标
表:2012-2014年BP原油和天然气探明储量
表:2012-2014年原油和天然气产量
表:2009-2014年BP油品销量(分产品和区域)
图:2010-2014年BP加油站数量(分区域)
表:截至2014年底BP在广东加油站数量(分城市)
图:2009-2014年埃克森美孚营业收入及同比增长
图:2009-2014年埃克森美孚净利润及同比增长
表:2010-2014年埃克森美孚主要财务指标
图:2012-2013年埃克森美孚营收构成(分业务)
表:2010-2014年埃克森美孚营收构成(分区域)
表:截至2014年底埃克森美孚原油和天然气探明储量(分区域)
表:2012-2014年埃克森美原油和天然气产量(分区域)
图:2009-2014年埃克森美孚油品销量(分产品和区域)
图:2009-2014年埃克森美孚加油站数量(分区域)
图:2009-2014年道达尔营业收入及同比增长
图:2009-2014年道达尔净利润及同比增长
表:2012-2014年道达尔主要财务指标
表:2012-2014年道达尔营收构成(分业务)
表:2012-2014年道达尔营收构成(分区域)
表:2009-2013年道达尔原油和天然气探明储量(分区域)
表:2009-2013年道达尔原油和天然气产量(分区域)
表:2010-2013年道达尔油品销量(分产品和区域)
图:道达尔LNG业务(分区域)
表:2009-2013年道达尔LNG销量(分区域)
表:2009-2013年道达尔管道气销量(分区域)
图:2010-2014年道达尔加油站数量(分区域)
图:2009-2014年中国石化营业收入及同比增长
图:2009-2014年中国石化净利润及同比增长
表:2009-2014年中国石化营收构成(分业务)
图:2009-2014年中国石化毛利率(分业务)
表:2006-2014年中国石化原油和天然气探明储量
表:2006-2014年中国石化原油、天然气、成品油产量(分产品)
表:2009-2014年中国石化原油、天然气、成品油销量(分产品)
表:2006-2014年中国石化油品平均销售价格(分产品)
图:2006-2018年中国石化加油站数量及市场份额
图:2000-2014年中国石化加油站数量构成
图:2006-2018年中国石化单座加油站年均加油量及同比增长
图:2008-2018年中国石化加油站非油品业务收入及同比增长
表:中石化混合所有制改革引入的25家投资者
图:2015-2018年中国石化营业收入及同比增长
图:2009-2014年中国石油营业收入及同比增长
图:2009-2014年中国石油净利润及同比增长
表:2009-2014年中国石油营收构成(分业务)
图:2009-2014年中国石油营收构成(分区域)
表:2009-2014年中国石油毛利率(分业务)
表:2006-2014年中国石油原油和天然气探明储量
表:2006-2014年中国石油原油、天然气、成品油产量(分产品)
表:2006-2014年中国石油原油、天然气、成品油销量(分产品)
表:2006-2014年中国石油油品平均销售价格(分产品)
图:2006-2018年中国石油加油站数量及市场份额
图:2006-2014年中国石油加油站数量构成
图:2006-2018年中国石油加油站单站年均加油量及同比增长
图:2015-2018年中国石油营业收入及同比增长
图:2009-2014年中国海洋石油营业收入及同比增长
图:2009-2014年中国海洋石油净利润及同比增长
图:2009-2014年中国海洋石油营收构成(分业务)
图:截至2014年底中国海洋石油营销网络分布
图:2009-2018年中国海洋石油加油站数量及同比增长
图:2015-2018年中国海洋石油营业收入及同比增长
图:2007-2018年中国加油站与天然气加气站数量对比
图:2008-2018年中国加油站与天然气加气站数量增速对比
图:2007-2018年中国平均每座加油站服务的汽车数量及平均每座天然气加气站服务的天然气汽车数量对比
图:2009-2014年全球及中国主要石油公司营业收入对比
图:2009-2014年全球及中国主要石油公司营业收入增速对比
图:2009-2014年全球及中国主要石油公司净利润对比
表:2010-2014年全球及中国主要石油公司净利润增速对比
图:2010-2014年中国主要石油公司加油站数量对比
Classification of Filling Stations by Grade
Consumption Characteristics and Habits of Major Filling Station Clients
China's Refined Oil Output and YoY Growth, 2006-2018E
China's Refined Oil Sales Volume and YoY Growth, 2006-2018E
China's Refined Oil Apparent Consumption and YoY Growth, 2006-2018E
China's Refined Oil Output Structure, 2006-2014
China's Refined Oil Apparent Consumption Structure, 2006-2014
China's Refined Oil Import dependency and self-sufficiency Ratios, 2006-2014
China's Diesel Output and YoY Growth, 2006-2014
China's Diesel Sales Volume and YoY Growth, 2006-2014
China's Diesel Apparent Consumption and YoY Growth, 2006-2014
% of China's Diesel in Refined Oil by Output and Apparent Consumption, 2006-2014
China's Gasoline Output and YoY Growth, 2006-2014
China's Gasoline Sales Volume and YoY Growth, 2006-2014
China's Gasoline Apparent Consumption and YoY Growth, 2006-2014
% of China's Gasoline in Refined Oil by Output and Apparent Consumption, 2006-2014
China’s Kerosene Output and YoY Growth, 2006-2014
China’s Kerosene Sales Volume and YoY Growth, 2006-2014
China’s Kerosene Apparent Consumption and YoY Growth, 2006-2014
% of China's Kerosene in Refined Oil by Output and Apparent Consumption, 2006-2014
China's 90 # Lead-free Gasoline Wholesale and Retail Prices, 2009-2014
China's 93 # Gasoline Wholesale and Retail Prices, 2009-2014
China's 93 # Lead-free Gasoline Wholesale and Retail Prices, 2009-2014
China's 97 # Gasoline Wholesale and Retail Prices, 2009-2014
Difference between China's 93 # and 97 # Gasoline Wholesale and Retail Prices, 2009-2014
China's 0 # Diesel Wholesale and Retail Prices, 2009-2014
Difference between China's 0 # Diesel Wholesale and Retail Prices, 2009-2014
Number of Refined Oil Wholesale, Storage and Retail Enterprises in China, 2006-2014
Number of State-owned, Private and Foreign Refined Oil Enterprises in China, 2012-2013
Number of Employees Working for State-owned, Private and Foreign Refined Oil Wholesale, Storage and Retail Enterprises in China, 2012-2013
China's Refined Oil Wholesale Volume, Storage Volume and Retail Sales Volume, 2011-2014
Number of Filling Stations and YoY Growth in China, 2006-2018E
Number of Filling Stations in China (by Annual Retail Sales Volume), 2012-2014
Regional Distribution of Filling Stations in China, 2012-2014
Number and YoY Growth of Filling Stations Conducting Non-oil Business in China, 2009-2018
Non-oil Revenue and YoY Growth of Filling Stations in China, 2009-2018E
Total Number of Headquarters and YoY Growth of Filling Station Chains in China, 2009-2014
Number of Stores and YoY Growth of Filling Station Chains in China, 2006-2014
Business Area and YoY Growth of Filling Station Chains in China, 2006-2014
Number of Employees of Filling Station Chains in China, 2006-2014
Procurement and YoY Growth of Filling Station Chains in China, 2006-2014
Revenue and YoY Growth of Filling Station Chains in China, 2009-2014
Difference between Revenue and Procurement of Filling Station Chains in China, 2009-2014
Market Share of State-owned, Private and Foreign Filling Stations in China by Number, 2010-2014
Entry Time and Layout Area of Foreign Companies in Chinese Filling Station Market
Number of Filling Stations of Major Enterprises in China (by Province/Municipality), by the end of 2014
China’s Motor Vehicle Ownership and YoY Growth, 2006-2018E
China’s Motor Vehicle Ownership Structure, 2014
China’s Motor Vehicle Ownership and Market Share (by Province/Municipality), 2014
China’s Automobile Sales Volume and YoY Growth, 2006-2018E
China’s Passenger Car and Commercial Vehicle Sales Volume, 2006-2018E
China's Automobile Sales Volume Structure (by Power), 2006-2014
China's Passenger Car Sales Volume Structure (by Power), 2006-2014
China's Commercial Vehicle Sales Volume Structure (by Power), 2006-2014
China's New Energy Vehicle Sales Volume and YoY Growth, 2010-2018E
% of New Energy Vehicle Sales Volume in China's Total Automobile Sales Volume, 2010-2018E
China's New Energy Vehicle Sales Volume Structure (by Technology), 2011-2014
China’s Automobile Ownership and YoY Growth, 2006-2018E
China’s Civilian Automobile Ownership and YoY Growth, 2006-2018E
Family Car Ownership per 100 Urban Families in China and YoY Growth, 2006-2018E
China’s Civilian Vehicle Ownership (by Province/Municipality), 2006-2014
YoY Growth of China’s Civilian Automobile Ownership (by Province/Municipality), 2007-2014
Family Car Ownership per 100 Urban Families in China (by Province/ Municipality), 2006-2013
YoY Growth of Family Car Ownership per 100 Urban Families in China (by Province/Municipality), 2007-2013
Number of Filling Stations, Motor Vehicles, Automobiles and Civilian Automobiles in China, 2006-2018E
Growth Rates of Filling Stations, Motor Vehicles, Automobiles and Civilian Automobiles in China, 2007-2018E
Number of Motor Vehicles, Automobiles and Civilian Automobiles Served by Each Filling Station in China, 2006-2018E
Number of Civilian Automobiles Served by Each Filling Station (by Province/Municipality), 2014
Merits and Demerits of LNG and CNG
Advantages and Disadvantages of LNG and CNG Vehicles
Classification of Natural Gas Stations
Policies on Natural Gas Vehicle in China, 2012-2014
Global Natural Gas Vehicle Ownership and YoY Growth, 2006-2018E
Growth Rate of Global Natural Gas Vehicle Ownership by Region, 2006-2013
Global Top 20 Countries by Natural Gas Vehicle Ownership, 2006-2013
China’s Natural Gas Vehicle Ownership and YoY Growth, 2006-2018E
% of Natural Gas Vehicle Ownership in China’s Total Automobile Ownership, 2006-2018E
China’s LNG and CNG Vehicle Ownership, 2011-2018E
Number of Global Natural Gas Stations and YoY Growth, 2007-2018E
Global Top 20 Countries by Number of Natural Gas Stations, 2007-2013
Number of Natural Gas Vehicles Served by Each Natural Gas Station in the World, 2007-2018E
Number of Natural Gas Stations and YoY Growth in China, 2007-2018E
Number of CNG and LNG Gas Stations in China, 2011-2018E
Number of Natural Gas Vehicles Served by Each Natural Gas Station in China, 2011-2018E
China’s CNG Vehicle Ownership (by Province/Municipality), 2012-2013
Number of CNG Gas Stations in China (by Province / Municipality), 2012-2013
Number of CNG Vehicles Served by Each CNG Gas Station in China (by Province / Municipality), 2012-2013
Shell's Revenue and YoY Growth, 2009-2014
Shell's Net Income and YoY Growth, 2009-2014
Shell's Main Business
Shell's Revenue Structure (by Business), 2010-2014
Shell's Revenue Structure (by Region), 2010-2014
Shell's Net Income (by Business), 2012-2014
Financial Indicators of Shell's Upstream Business, 2014
Financial Indicators of Shell's Downstream Business, 2014
Shell's Proven Crude Oil and Natural Gas Reserves (by Region), 2012-2014
Shell's Crude Oil Output (by Region), 2012-2014
Shell's Natural Gas Output (by Region), 2012-2014
Shell's Oil Product Sales Volume (by Product and Region), 2009-2014
Shell's LNG Capacity, 2007-2020E
Shell's Status in LNG Business
Distribution of Shell's LNG Liquefaction Plants, by the end of 2014
Shell's LNG Sales Volume (by Region), 2012-2014
Number of Shell's Filling Stations (by Region), 2009-2013
Number of Shell's Filling Stations in China (by Province / Municipality), by the end of 2014
BP's Revenue and YoY Growth, 2009-2014
BP's Net Income and YoY Growth, 2009-2014
BP's Revenue Structure (by Business), 2008-2013
Key Financial Indicators of BP's Upstream Business, 2012-2014
Key Financial Indicators of BP's Downstream Business, 2012-2014
Key Financial Indicators of BP's Other Business, 2012-2014
BP's Proven Crude Oil and Natural Gas Reserves, 2012-2014
BP's Output of Crude Oil and Natural Gas, 2012-2014
BP's Oil Product Sales Volume (by Product and Region), 2009-2014
Number of BP's Filling Stations (by Region), 2010-2014
Number of BP's Filling Stations in Guangdong (by City), by the end of 2014
ExxonMobil’s Revenue and YoY Growth, 2009-2014
ExxonMobil’s Net Income and YoY Growth, 2009-2014
ExxonMobil's Key Financial Indicators, 2010-2014
ExxonMobil's Revenue Structure (by Business), 2012-2013
ExxonMobil's Revenue Structure (by Region), 2010-2014
ExxonMobil's Proven Crude Oil and Natural Gas Reserves (by Region), by the end of 2014
ExxonMobil's Output of Crude Oil and Natural Gas (by Region), 2012-2014
ExxonMobil's Oil Product Sales Volume (by Product and Region), 2009-2014
Number of ExxonMobil's Filling Stations (by Region), 2009-2014
Total's Revenue and YoY Growth, 2009-2014
Total's Net Income and YoY Growth, 2009-2014
Total's Key Financial Indicators, 2012-2014
Total's Revenue Structure (by Business), 2012-2014
Total's Revenue Structure (by Region), 2012-2014
Total's Proven Crude Oil and Natural Gas Reserves (by Region), 2009-2013
Total's Output of Crude Oil and Natural Gas (by Region), 2009-2013
Total's Oil Product Sales Volume (by Product and Region), 2010-2013
Total's LNG Business (by Region)
Total's LNG Sales Volume (by Region), 2009-2013
Total's Pipeline Gas Sales Volume (by Region), 2009-2013
Number of Total's Filling Stations (by Region), 2010-2014
Sinopec's Revenue and YoY Growth, 2009-2014
Sinopec's Net Income and YoY Growth, 2009-2014
Sinopec's Revenue Structure (by Business), 2009-2014
Sinopec's Gross Margin (by Business), 2009-2014
Sinopec's Proven Crude Oil and Natural Gas Reserves, 2006-2014
Sinopec's Output of Crude Oil, Natural Gas and Refined Oil (by Product), 2006-2014
Sinopec's Sales Volume of Crude Oil, Natural Gas and Refined Oil (by Product), 2009-2014
Average Selling Price of Sinopec's Oil Products (by Product), 2006-2014
Number and Market Share of Sinopec's Filling Stations, 2006-2018E
Structure of Sinopec's Filling Stations by Number, 2000-2014
Average Annual Filling Volume and YoY Growth of Each Filling Station under Sinopec, 2006-2018E
Non-oil Revenue and YoY Growth of Sinopec's Filling Stations, 2008-2018E
25 Investors Introduced by Sinopec's Mixed Ownership Reform
Sinopec's Revenue and YoY Growth, 2015-2018E
PetroChina's Revenue and YoY Growth, 2009-2014
PetroChina's Net Income and YoY Growth, 2009-2014
PetroChina's Revenue Structure (by Business), 2009-2014
PetroChina's Revenue Structure (by Region), 2009-2014
PetroChina's Gross Margin (by Business), 2009-2014
PetroChina's Proven Crude Oil and Natural Gas Reserves, 2006-2014
PetroChina's Output of Crude Oil, Natural Gas and Refined Oil (by Product), 2006-2014
PetroChina's Sales Volume of Crude Oil, Natural Gas and Refined Oil (by Product), 2006-2014
Average Selling Price of PetroChina's Oil Products (by Product), 2006-2014
Number and Market Share of PetroChina's Filling Stations, 2006-2018E
Structure of PetroChina's Filling Stations by Number, 2006-2014
Average Annual Filling Volume and YoY Growth of Each Filling Station under PetroChina, 2006-2018E
PetroChina's Revenue and YoY Growth, 2015-2018E
CNOOC's Revenue and YoY Growth, 2009-2014
CNOOC's Net Income and YoY Growth, 2009-2014
CNOOC's Revenue Structure (by Business), 2009-2014
CNOOC's Marketing Network, by the end of 2014
Number and YoY Growth of CNOOC's Filling Stations, 2009-2018E
CNOOC's Revenue and YoY Growth, 2015-2018E
Number of Filling Stations and Natural Gas Stations in China, 2007-2018E
Growth Rates of Number of Filling Stations and Natural Gas Stations in China, 2008-2018E
Number of Automobiles and Natural Gas Vehicles Served by Each Filling Station and Natural Gas Station in China Respectively, 2007-2018E
Revenue Comparison between Global and Chinese Major Oil Companies, 2009-2014
Revenue Growth Comparison between Global and Chinese Major Oil Companies, 2009-2014
Net Income Comparison between Global and Chinese Major Oil Companies, 2009-2014
Net Income Growth Comparison between Global and Chinese Major Oil Companies, 2010-2014
Comparison between Major Oil Companies in China by Number of Filling Stations, 2010-2014
如果这份报告不能满足您的要求,我们还可以为您定制报告,请 留言说明您的详细需求。
|