|
|
|
报告导航:研究报告—
TMT产业—电子半导体
|
|
2014-2015年全球及中国电子合约制造(EMS/ODM)行业研究报告 |
 |
字数:2.1万 |
页数:140 |
图表数:170 |
|
中文电子版:8000元 |
中文纸版:4000元 |
中文(电子+纸)版:8500元 |
|
英文电子版:2300美元 |
英文纸版:2500美元 |
英文(电子+纸)版:2600美元 |
|
编号:ZYW206
|
发布日期:2015-04 |
附件:下载 |
 |
|
|
《2014-2015年全球及中国电子合约制造(EMS/ODM)行业研究报告》包含以下内容:
1、电子合约制造(EMS/ODM)行业简介
2、电子合约制造(EMS/ODM)行业市场与产业分析
3、电子合约制造(EMS/ODM)行业排名
4、27家典型电子合约制造(EMS/ODM)厂家研究
2014年得益于苹果、华为、小米手机厂家出货量大增,带动整个电子合约制造(EMS/ODM)市场增长5%,而2013年市场则是下跌0.5%。2014年手机市场的增长填补了笔记本电脑市场的下降。2015年苹果手机依然具备强大的增长潜力,但增幅已经不能和2014年相比。RAN(Radio Access Networks)的4G建设在2014年已达到巅峰,预计从2015年至2019年期间,RAN市场都会处于快速下滑阶段。2014年,移动互联的数据量大增,数据中心或云计算服务市场也强劲增长。综合考虑,2015年整个电子合约制造(EMS/ODM)市场增长3.1%。未来智能手机饱和、RAN市场下滑,整个电子合约制造(EMS/ODM)市场增幅将逐年下滑。
最大驱动力还是以数据中心或云计算服务为核心的IT基础设施领域,服务器出货量将在2015年赢得强力增长,预计整体出货量增幅达13.5%,白牌服务器(ODM-Direct)增幅可达20%。服务器代工领域和白牌服务器基本被台湾厂家垄断,全球市场占有率超过90%,台湾有着完善的服务器产业链,而服务器可以看作是电脑的延伸,这是台湾厂家最擅长的领域。台湾厂家的技术能力也越来越强,未来服务器+Routing+Storge+Switching的整体机柜型解决方案将会获得更多的市场空间。
欧美电子合约制造(EMS/ODM)厂家则致力于提升盈利能力,降低电信和通信基础设施所占收入的比例,加大工业、医疗、汽车领域的拓展,以此来提高盈利能力。同时欧美厂家也进一步加强零组件领域的不足,向产业链上游进军。不过相对于台湾厂家,欧美电子合约制造(EMS/ODM)厂家的零组件领域能力差的很远。欧美EMS/ODM厂家可能会采取并购来弥补这个缺点,如Jabil收购Nypro。
Global and China EMS/ODM Industry Report, 2014-2015 is primarily concerned with the following:
1, Overview of EMS/ODM industry;
2, EMS/ODM market and industry;
3, Ranking in the EMS/ODM industry;
4, 27 typical EMS/ODM manufacturers.
In 2014, thanks to a surge in shipments of mobile phone vendors such as Apple, Huawei, and Xiaomi, the EMS/ODM market rose by 5%, in contrast to a 0.5% drop in 2013. In 2014, the growth in mobile phone offset the drop in notebook computer market. In 2015, Apple mobile phone will still have strong growth potential, but with the growth rate dwarfed by that in 2014. The 4G construction of Radio Access Networks reached the peak in 2014. It is projected that the RAN market will be on the decline in 2015-2019. Moreover, the data size of mobile Internet surged, data center or cloud computing services market grew robustly. Consequently, the EMS/ODM market in 2015 increased by 3.1%. In future, smartphones will be saturated and RAN market will decline, which would prompt the growth rate of EMS/ODM to drop year by year.
IT infrastructure, with data center or cloud computing services as the core, will constitute the biggest driving force. The server shipments will grow robustly in 2015, with an overall shipment estimated to increase by 13.5%. In particular, the ODM-Direct will rise by 20%. Server OEM and ODM-Direct are basically monopolized by the Taiwanese vendors, with a global market share of over 90%. Taiwan has a complete industrial chain of server, which is viewed as an extension of the computer. As the Taiwanese vendors have stronger and stronger technical ability, the future equipment cabinet solution of Server+Routing+Storge+Switching will gain more market space.
However, the European and US EMS/ODM vendors are dedicated to improving profitability by reducing the revenue proportion of telecom and communication infrastructure, and intensifying the expansion to industrial, medical, and automotive sectors. Meanwhile, they have also strengthened the weakness in components, and ventured into the upstream sector of industrial chains. But compared with the Taiwanese vendors, the European and US EMS/ODM peers lagged far behind in the field of components. They would make up for the shortcomings through M&A, with, for example, Jabil’s acquisition of Nypro.
第一章、电子合约制造简介
1.1、电子合约制造定义
1.2、EMS产业背景
第二章、电子合约制造下游市场
2.1、电子合约制造市场规模
2.2、无线接入网设备
2.3、云服务市场
2.3.1、云服务简介
2.3.2、Cloud Service Market Size
2.3.3、Datacenter Workload
2.4、存储
2.4.1、存储市场规模
2.4.2、存储产业
2.5、数据中心
2.6、服务器
2.6.1、服务器市场
2.6.2、服务器产业
2.7、全球手机市场与产业
2.8、中国手机市场
2.9、笔记本电脑市场
2.10、平板电脑市场
2.11、HDD市场
2.12、HDD产业
第三章、电子合约制造产业
3.1、全球电子合约制造产业概况
3.2、电子合约制造业排名
3.3、中小电子合约制造企业一览
第四章、电子合约制造企业研究
4.1、鸿海
4.2、比亚迪电子
4.3、Flextronics
4.4、Jabil
4.5、广达Quanta Computer
4.6、仁宝Compal
4.7、纬创Wistron
4.8、英业达Inventec
4.9、和硕Pegatron
4.10、Celestica
4.11、泰金宝
4.12、Benchmark
4.13、Sanmina
4.14、环隆电气
4.14.1、环旭电子
4.15、SIIX
4.16、Plexus
4.17、深圳长城开发科技
4.18、Venture
4.19、Zollner
4.20、UMC
4.21、SUMITRONICS
4.22、精成科技
4.23、伟易达集团
4.24、3CEMS
4.25、卓翼科技
4.26、柏能集团
4.27、富智康
1 Introduction to EMS and ODM
1.1 Definition
1.2 Background
2 EMS and ODM Downstream Market
2.1 EMS and ODM Market Size
2.2 Wireless Access Network Equipment
2.3 Cloud Service Market
2.3.1 Cloud Service Overview
2.3.2 Cloud Service Market Size
2.3.3 Datacenter Workload
2.4 Memory
2.4.1 Memory Market Size
2.4.2 Memory Industry
2.5 Data Center
2.6 Server
2.6.1 Server Market Size
2.6.2 Server Industry
2.7 Global Mobile Phone Market and Industry
2.8 China Mobile Phone Market
2.9 Laptop Computer Market
2.10 Tablet PC Market
2.11 HDD Market
2.12 HDD Industry
3 EMS and ODM Industry
3.1 Overview
3.2 Ranking
3.3 SMEs
4 EMS and ODM Vendors
4.1 Hon Hai
4.2 BYD Electronic
4.3 Flextronics
4.4 Jabil
4.5 Quanta Computer
4.6 Compal
4.7 Wistron
4.8 Inventec
4.9 Pegatron
4.10 Celestica
4.11 Cal-Comp
4.12 Benchmark
4.13 Sanmina
4.14 Universal Scientific Industrial (USI)
4.14.1 USI Shanghai
4.15 SIIX
4.16 Plexus
4.17 Shenzhen Kaifa Technology Co., Ltd.
4.18 Venture
4.19 Zollner
4.20 UMC
4.21 SUMITRONICS
4.22 GBM
4.23 VTech
4.24 3CEMS
4.25 Shenzhen Zowee Technology
4.26 PC Partner Group
4.27 FIH Mobile Limited
EMS与ODM(电子合约制造)流程
2011-2017年电子合约制造市场规模
2013、2017年电子合约制造市场下游分布
2013年全球移动通信基础设备主要厂家市场占有率
2013年全球4G移动通信基础设备主要厂家市场占有率
2014年全球移动通信基础设备主要厂家市场占有率
Essential Characteristics of Cloud
Cloud Service Models—IaaS, PaaS, and SaaS
2008-2020 Global Public Cloud Market Size
2013-2018 Cloud Computing Infrastructure and platform market
2013-2018 Cloud Platform TAM and pool of the enterprise spend
Workload Distribution: 2013–2018
2013-2018 Public vs. Private Cloud Growth
SaaS Most Highly Deployed Global Cloud Service by 2018
SaaS Gains Momentum in Private Cloud 2013-2018
2013-2018 IaaS and PaaS Gain Public Cloud Share of Workloads
2009-2017存储市场规模(USD in billions)
2013-2018 Personal Cloud Storage—Growth in Users
2013-2018 Consumer Cloud Storage Traffic Growth
2014 Worldwide ECB Disk Storage Vendor Revenue
Worldwide ECB Disk Storage Vendor Revenue
2013 Worldwide ECB Disk Storage Vendor Revenue
2013-2018 Regional Distribution of Total Data Center Workloads, in Millions
2013-2018 Regional Distribution of Cloud Workloads, in Millions
2013-2018 Regional Distribution of Traditional Data Center Workloads, in Millions
2013-2018年全球服务器市场规模
2013 Top 5 Corporate Family, Worldwide Server Systems Factory Revenue
Top 5 Corporate Family, Worldwide Server Systems Factory Revenue, Fourth Quarter of 2014
Worldwide: Server Vendor Shipments , 4Q14 (Units)
Worldwide: Server Vendor Revenue 4Q14 (U.S. Dollars)
EMEA Server Vendor Revenue 4Q14 (U.S. Dollars)
EMEA Server Shipment , 4Q14 (Units)
2015年全球服务器品牌市场占有率
2015年全球服务器生产厂家市场占有率
代工厂与服务器品牌厂供应关系
2007-2015年全球手机出货量
2011-2014年全球3G/4G手机出货量地域分布
Worldwide Smartphone Sales to End Users by Vendor in 2014 (Thousands of Units)
Worldwide Smartphone Sales to End Users by Operating System in 2014 (Thousands of Units)
2014年全球前十大手机厂家出货量
2013年1月-2014年12月中国手机市场月度出货量
2014年中国智能手机市场主要厂家市场占有率
2014年中国4G手机市场主要厂家市场占有率
2008-2015年笔记本电脑出货量
2010-2014年全球主要笔记本电脑ODM厂家出货量
2011-2016年全球平板电脑出货量
Top Five Tablet Vendors, Shipments Fourth Quarter 2014
Top Five Tablet Vendors, Shipments, Market Share, and Growth, Calendar Year 2014
2012年4季度-2014年4季度每季度HDD出货量
2009-2015年HDD出货量
2014年全球HDD主要厂家市场占有率
2010-2019年全球HDD出货量下游分布
2013年全球电子合约制造业产值地域分布
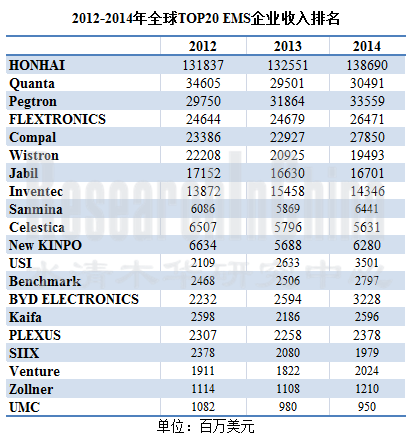
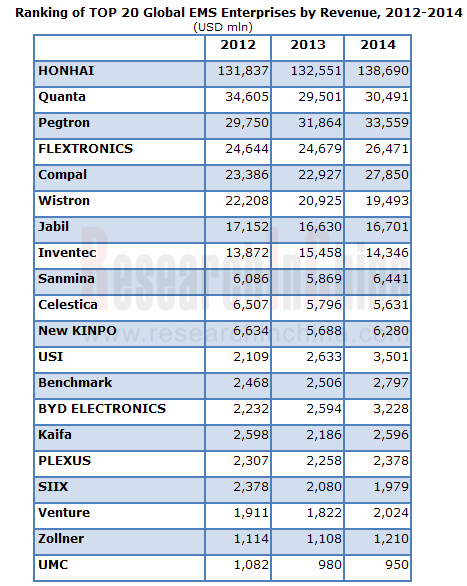
2012-2014年前20大EMS企业收入排名
2012-2014年全球前18大电子合约制造企业毛利率统计
2007-2014年鸿海收入与毛利率
2013年3月-2015年3月鸿海月度收入
2013年鸿海收入客户分布
2008-2014年比亚迪电子收入与毛利率
2006-2014年比亚迪电子收入业务分布
2013年比亚迪电子Component&Module事业收入产品分布
2013年比亚迪电子收入客户分布
2014年比亚迪电子收入客户分布
2009-2015财年Flextronics收入与毛利
2009-2014财年Flextronics资产负债表
2013年1季度-2014年4季度Flextronics季度收入与毛利率
2011-2014财年Flextronics收入分布(按地域)
2012-2014财年Flextronics Property and equipment收入分布(按地域)
2011-2014财年Flextronics收入分布(按业务)
FY2010-FY2014 INS部门收入
FY2010-FY2014 IEI部门收入
FY2010-FY2014 HRS部门收入
FY2010-FY2014 CTG部门收入
Flextronics Global Manufacturing Footprint
2015 Flextronics 员工地域分布
2009-2015财年Jabil收入与营业利润率
2009-2014财年Jabil资产负债表
2013财年1季度-2015财年2季度Jabil季度收入与毛利率
2011-2014财年Jabil收入业务分布
2012-2014财年Jabil收入地域分布
2013-2014财年Jabil Long-lived assets地域分布
Jabil全球分布
2015财年投资领域
2005-2013年Quanta收入与毛利率
2013年3月-2015年3月广达月度收入与增幅
2004-2014年广达笔记本电脑出货量及增幅
2013-2014年Quanta收入产品分布
Quanta Computer Group Organization
仁宝2005-2015年收入与毛利率
2013年3月-2015年3月仁宝收入与同比增幅
2007-2014年仁宝笔记本电脑出货量与增幅
2014年仁宝收入产品分布
Compal全球分布
仁宝集团结构
纬创2003-2015年收入与毛利率
2013年3月-2015年3月纬创月度收入
纬创2004-2014年笔记本电脑出货量与增幅
2015年纬创收入产品分布
英业达集团结构
英业达2005-2015年收入与毛利率
2013年3月-2015年3月英业达收入与每月增幅
和硕集团结构
2008-2015年和硕收入与毛利率
2011年12月-2013年12月和硕月度收入
2013年和硕收入产品分布
2013年1季度-2014年4季度和硕季度收入下游分布
2008-2014年Celestica收入与毛利率
2010-2014年Celestica收入下游分布
2010-2014年Celestica收入地域分布
金宝集团组织结构
2007-2015年泰金宝收入与毛利率
2013年3月-2015年3月泰金宝月度收入
2013年泰金宝收入产品分布
泰金宝集团结构
2008-2014年Benchmark收入与毛利率
2010-2014年Benchmark收入下游分布
2009-2015财年Sanmina收入与营业利润率
2012财年4季度-2015财年1季度Sanmina收入与毛利率
2011-2013财年Sanmina收入下游分布
Sanmina 2014Q1-2015Q1收入业务分布
2011-2014财年Sanmina收入地域分布
Sanmina 最近5季度Balance Sheet Metrics
Sanmina生产基地一览
2008-2014年环隆电气收入与毛利率
2013年1季度-2014年4季度环隆电气季度收入与毛利率
2013年1季度-2014年4季度环隆电气季度收入产品分布
2008-2014年环旭电子收入与营业利润率
2011-2014年环旭电子收入下游分布
2011-2014年环旭电子各项产品产量
2014年环旭电子成本结构
2010-2014年SIIX Capital structure
2010-2014年SIIX Cash Flow
SIIX Organizational
SIIX 商业模式
2014-2015年SIIX收入下游分布
2014-2015年SIIX Sales bridge
2014年 SIIX 销售地域分布
2009-2014财年Plexus收入与毛利率
2011-2014财年Plexus收入下游分布
2011-2014财年Plexus收入地域分布
2007-2014年深圳长城开发科技收入与毛利率
2012-2014年深圳长城开发科技收入业务分布
2008-2014年Venture收入与毛利率
2013-2014年Venture收入业务分布
2011-2014年Venture收入业务分布
Zollner主要客户
SUMITRONICS主要产品
SUMITRONICS全球分布
精成科技组织结构
2007-2015年精成科技收入与毛利率
2013年3月-2015年3月精成科技月度收入
2009-2015财年 VTech收入与税前利润率
2010-2015财年Vtech收入业务分布
2014财年Vtech ELP业务收入地域分布
2014财年Vtech Phone业务收入地域分布
2012-2013年Vtech的CMS业务收入产品分布
2014财年Vtech的CMS事业部收入地域分布
CMS事业部主要产品
CMS制造能力
2011-2014年CMS产能扩展
3CEMS主要产品
3CEMS PCB能力
3CEMS 工厂分布
2009-2014年卓翼科技收入与毛利率
2009-2014年卓翼科技收入产品分布
2009-2014年柏能集团收入与毛利率
2009-2014年柏能集团收入产品分布
2009-2014年柏能集团收入地域分布
2003-2015年富智康收入与运营利润率
2014年富智康收入客户分布
2005-2014年富智康收入地域分布
Downstream Distribution of EMS and ODM Market, 2013 vs 2017E
Market Share of Major Global Mobile Communication Equipment Companies, 2013
Market Share of Major Global 4G Mobile Communication Equipment Companies, 2013
Market Share of Major Global Mobile Communication Equipment Companies, 2014
Essential Characteristics of Cloud
Cloud Deployment Models
Cloud Service Models—IaaS, PaaS, and SaaS
Global Public Cloud Market Size, 2008-2020E
Cloud Computing Infrastructure and Platform Market Size, 2013-2018E
Cloud Platform TAM and Pool of the Enterprise Spend, 2013-2018E
Global Workload Distribution, 2013–2018E
Public vs. Private Cloud Growth, 2013-2018E
SaaS Most Highly Deployed Global Cloud Service by 2018E
SaaS Gains Momentum in Private Cloud, 2013-2018E
IaaS and PaaS Gain Public Cloud Share of Workloads, 2013-2018E
Memory Market Size, 2009-2017E
Personal Cloud Storage—Growth in Users, 2013-2018E
Consumer Cloud Storage Traffic Growth, 2013-2018E
Worldwide ECB Disk Storage Vendor Revenue,2014
Worldwide ECB Disk Storage Vendor Revenue, 2012-2013
Worldwide ECB Disk Storage Vendor Revenue, 2013
Regional Distribution of Total Data Center Workloads, 2013-2018E
Regional Distribution of Cloud Workloads, 2013-2018E
Regional Distribution of Traditional Data Center Workloads, 2013-2018E
Global Server Market Size, 2013-2018E
Top 5 Corporate Family, Worldwide Server Systems Factory Revenue, 2013
Top 5 Corporate Family, Worldwide Server Systems Factory Revenue, 2014Q4
Worldwide Server Vendor Shipments, 2014Q4
Worldwide Server Vendor Revenue, 2014Q4
EMEA Server Vendor Revenue, 2014Q4
EMEA Server Shipment, 2014Q4
Market Share of Global Server Brand Vendors, 2015
Market Share of Global Server Manufacturers, 2015
Supply Relationship between OEM and Server Brand Vendors
Global 3G/4G Mobile Phone Shipment by Region, 2011-2014
Worldwide Smartphone Sales to End Users by Vendor, 2014
Worldwide Smartphone Sales to End Users by Operating System, 2014
Shipments of Global Top10 Mobile Phone Vendors, 2014
Monthly Shipment of Mobile Phone in China, Jan.2013-Dec.2014
Market Share of Major Vendors in Chinese Smart Phone Market, 2014
Market Share of Major Vendors in Chinese 4G Mobile Phone Market, 2014
Laptop Computer Shipments, 2008-2015E
Shipments of Global Major Laptop Computer ODM Companies, 2010-2014
Global Tablet PC Shipments, 2011-2016E
Shipments of Top5 Tablet PC Vendors, 2014 Q4
Shipments, Market Share, and Growth of Top5 Tablet PC Vendors, 2014
Quarterly HDD Shipment, 2012Q4-2014Q4
HDD Shipment, 2009-2015
Market Share of Global Major HDD Vendors, 2014
HDD Shipment by Application, 2010-2019E
Global EMS and ODM Output Value by Region, 2013
Ranking of Global Top 20 EMS and ODM Vendors by Revenue, 2012-2014
Gross Margin of Global Top 18 EMS and ODM Vendors, 2012-2014
Hon Hai’s Revenue and Gross Margin, 2007-2015
Hon Hai’s Monthly Revenue, Mar.2013-Mar.2015
Hon Hai’s Revenue by Client, 2013
Revenue and Gross Margin of BYD Electronic, 2008-2014
Revenue of BYD Electronic by Business, 2006-2014
Revenue of BYD Electronic’s Component & Module Division by Product, 2013
Revenue of BYD Electronic by Client, 2013
Revenue of BYD Electronic by Client, 2014
Revenue and Gross Profit of Flextronics, FY2009-FY2015
Balance Sheet of Flextronics, FY2009-FY2014
Quarterly Revenue and Gross Margin of Flextronics, Q1 2013-Q4 2014
Revenue of Flextronics by Region, FY2011-FY2014
Property and Equipment of Flextronics by Region, FY2012-FY2014
Revenue of Flextronics by Business, FY2011-FY2014
Top 10 Clients of Flextronics
Revenue from INS Segment of Flextronics, FY2010-FY2014
Revenue from IEI Segment of Flextronics, FY2010-FY2014
Revenue from HRS Segment of Flextronics, FY2010-FY2014
Revenue from CTG Segment of Flextronics, FY2010-FY2014
Global Manufacturing Footprint of Flextronics
Employee of Flextronics by Region, 2015
Jabil’s Revenue and Operating Margin, FY2009-FY2015
Balance Sheet of Jabil, FY2009-FY2014
Jabil’s Quarterly Revenue and Gross Margin, Q1 FY2013-Q2 FY2015
Jabil’s Revenue by Business, FY2011-FY2014
Jabil’s Revenue by Region, FY2012-FY2014
Jabil’s Long-lived Assets by Region, FY2013-FY2014
Global Presense of Jabil
Investment Fields of Jabil, 2015
Quanta’s Revenue and Gross Margin, 2005-2014
Quanta’s Monthly Revenue, and Growth Rate Mar.2013-Mar.2015
Quanta’s Laptop Computer Shipment and Growth Rate, 2004-2014
Quanta’s Revenue by Product, 2013-2014
Quanta Computer Group Organization
Compal’s Revenue and Gross Margin, 2005-2015
Compal’s Monthly Revenue and YoY Growth Rate, Mar.2013-Mar.2015
Compal’s Laptop Computer Shipment and Growth Rate, 2007-2014
Revenue of Compal by Product, 2014
Compal's Global Presence
Compal's Structure
Wistron’s Revenue and Gross Margin, 2003-2015
Wistron’s Monthly Revenue, Mar.2013-Mar.2015
Wistron’s Laptop Shipment and Growth Rate, 2004-2014
Wistron’s Revenue by Product, 2015
Inventec’s Structure
Revenue and Gross Margin of Inventec, 2005-2015
Inventec’s Monthly Revenue, Mar.2013-Mar.2015
Pegatron’s Structure
Pegatron’s Revenue and Gross Margin, 2008-2015
Pegatron’s Monthly Revenue, Dec 2011- Dec 2013
Pegatron’s Revenue by Product, 2013
Quarterly Revenue of Pegatron by Downstream Application, 2013Q1 -2014Q4
Celestica’s Revenue and Gross Margin, 2008-2014
Celestica’s Revenue by Application, 2010- 2014
Celestica’s Revenue by Region, 2010-2014
Kinpo’s Organizational Structure
Cal-Comp's Revenue and Gross Margin, 2007-2015
Cal-Comp's Monthly Revenue, Mar.2013-Mar.2015
Cal-Comp's Revenue by Product, 2013
Benchmark’s Revenue and Gross Margin, 2008-2014
Benchmark’s Revenue by Application, 2010-2014
Sanmina’s Revenue and Operating Margin, FY2009-FY2015
Sanmina’s Revenue and Gross Margin, Q4 FY2012-Q1 FY2015
Sanmina’s Revenue by Application, FY2011-FY2013
Sanmina’s Revenue by Business, Q1 FY2014-Q1 FY2015
Sanmina’s Revenue by Region, FY2011-FY2014
Sanmina’s Balance Sheet Metrics, Q1 FY2014-Q1 FY2015
Sanmina’s Production Bases
Revenue and Gross Margin of Universal Scientific Industrial, 2008-2014
Quarterly Revenue and Gross Margin of Universal Scientific Industrial, Q1 2013-Q4 2014
Quarterly Revenue of Universal Scientific Industrial by Product, Q1 2013-Q4 2014
Revenue and Operating Margin of Universal Scientific Industrial (Shanghai), 2008-2014
Revenue of Universal Scientific Industrial (Shanghai) by Application, 2011-2014
Output of Universal Scientific Industrial (Shanghai) by Product, 2011-2014
Cost Structure of Universal Scientific Industrial (Shanghai), 2014
SIIX’s Revenue and Gross Margin, 2008-2014
SIIX’s Capital structure, 2010-2014
SIIX’s Cash Flow, 2010-2014
SIIX Organizational Structure
SIIX’s Commercial Pattern
SIIX’s Revenue by Application, 2014-2015
SIIX’s Sales bridge, 2014-2015
SIIX’s Sales Structure by Region,2014
SIIX Distribution
SIIX’s Expansion in Mexico
Revenue and Gross Margin of Plexus, FY2009-FY2014
Revenue of Plexus by Application, FY2011-FY2014
Revenue of Plexus by Region, FY2011-FY2014
Revenue and Gross Margin of Shenzhen Kaifa Technology Co., Ltd., 2007-2014
Revenue of Shenzhen Kaifa Technology Co., Ltd. by Business, 2012-2014
Venture’s Revenue and Gross Margin, 2008-2014
Venture’s Revenue by Segment, 2013-2014
Venture’s Revenue by Business, 2011-2014
Zollner’s Major Clients
Major Products of SUMITRONICS
Global Presence of SUMITRONICS
GBM’s Organizational Structure
GBM’s Revenue and Gross Margin, 2007-2015
GBM’s Monthly Revenue, Mar.2012-Mar.2015
VTech’s Revenue and Pre-tax Profit Margin, FY2009-FY2015
Major Products and Services of Vtech
Vtech’s Revenue by Business, FY2010-FY2015
Revenue of Vtech’s ELP Business by Region, FY2014
Revenue of Vtech’s Phone Business by Region, FY2014
Revenue of Vtech’s CMS Business by Product, FY2012-FY2013
Revenue of Vtech’s CMS Business by Region, FY2014
Major Products of Vtech’s CMS Division
CMS Manufacturing Capacity of Vtech
Vtech’s CMS Manufacturing Capacity Expansion, FY2011-FY2014
Major Products of 3CEMS
PCB Capacity of 3CEMS
Plants of 3CEMS
Revenue and Gross Margin of Shenzhen Zowee Technology, 2009-2014
Revenue of Shenzhen Zowee Technology by Product, FY2009-FY2014
Revenue and Gross Margin of PC Partner Group, FY2009-FY2014
Revenue of PC Partner Group by Product, FY2009-FY2014
Revenue of PC Partner Group by Region, FY2009-FY2014
Revenue and Operating Margin of FIH, 2006-2015
Revenue Structure of FIH by Client, 2014
Revenue Structure of FIH by Region, 2005-2014
如果这份报告不能满足您的要求,我们还可以为您定制报告,请 留言说明您的详细需求。
|