|
|
|
报告导航:研究报告—
制造业—化工
|
|
2014-2017年全球及中国溶解浆行业研究报告 |
 |
字数:3.3万 |
页数:106 |
图表数:131 |
|
中文电子版:8500元 |
中文纸版:4250元 |
中文(电子+纸)版:9000元 |
|
英文电子版:2300美元 |
英文纸版:2450美元 |
英文(电子+纸)版:2600美元 |
|
编号:HK058
|
发布日期:2015-04 |
附件:下载 |
 |
|
|
溶解浆是纤维素含量在90%以上的浆粕,主要包括木浆粕、竹浆粕和棉浆粕(本报告溶解浆特指木(竹)浆粕),下游需求领域主要为粘胶纤维。
2014年,全球新增溶解浆产能较多,包括Sappi在北美的33万吨产能、泰国双A的17.5万吨产能、日本王子集团的11万吨产能等。然而溶解浆下游粘胶纤维市场却持续低迷,导致溶解浆销售价格持续下滑,到2014年底已降至800美元/吨左右。
2015年,全球仍有多个溶解浆项目在建,如Lenzing溶解浆产能仍在持续扩产、Aditya Birla在老挝新建20万吨溶解浆项目等。
全球溶解浆行业集中度较高,主要生产商包括Sappi、Aditya Birla、Lenzing、Bracell、Rayonier等,2014年这五家厂商溶解浆产能之和约占全球总产能的53.3%。其中Sappi溶解浆产能为134万吨,占全球总产能的18.9%,在南非和北美拥有生产基地。
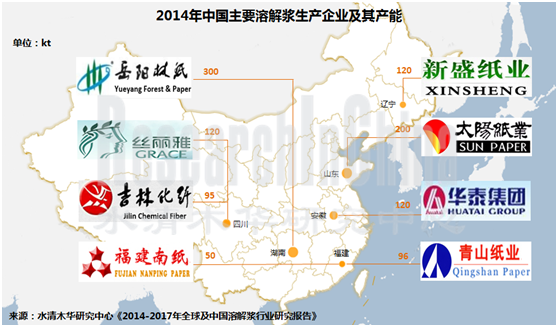
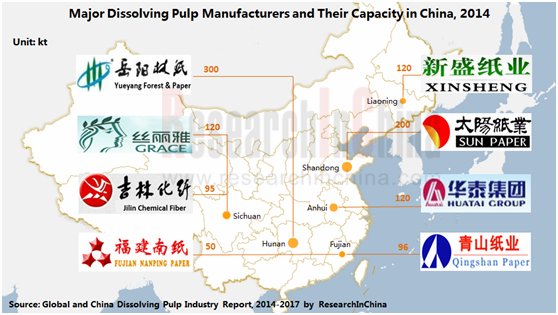
中国溶解浆产能从2011年开始急速扩张,到2014年底已达到120万吨左右,约占全球总产能的17%。但是由于中国森林资源短缺,溶解浆生产成本较高,竞争力不强。
2014年,中国溶解浆下游粘胶纤维行业不景气,加上国际低价溶解浆对国内市场的冲击,导致溶解浆行业全面亏损,部分溶解浆装置开始转产或停产。如太阳纸业溶解浆装置于4月转产纸浆,岳阳林纸溶解浆装置于7月转产漂白针叶浆,福建南纸溶解浆装置停产。
2014年4月,中国商务部公布反倾销调查终裁决议,未来5年内对原产于美国、加拿大、巴西的进口溶解浆分别征收17%、13%和6.8%的反倾销关税。并且,未来几年中国新增溶解浆产能较少,届时供过于求的局面有望得到缓解,中国溶解浆行业将逐步走出低谷。
中国拥有溶解浆生产装置的企业主要为大中型造纸企业和化纤企业。造纸企业主要为岳阳林纸、太阳纸业和华泰股份,产品主要为木溶解浆,产能分别为30万吨/年、20万吨/年和12万吨/年;化纤企业为丝丽雅集团和吉林化纤,产品主要为竹溶解浆,其中吉林化纤9.5万吨/年的竹溶解浆项目于2014年9月进入试运行阶段。
水清木华研究中心《2014-2017年全球及中国溶解浆行业研究报告》主要包括以下几个内容:
 全球溶解浆行业市场规模、竞争格局、价格分析等; 全球溶解浆行业市场规模、竞争格局、价格分析等;
中国溶解浆行业市场规模、竞争格局、进出口、价格分析及发展预测等;
中国粘胶纤维行业市场规模、竞争格局、进出口、价格分析及发展预测等;
全球及中国13家溶解浆生产企业的经营情况、溶解浆业务分析、预测与展望等。
Dissolving pulp refers to the pulp with cellulose content above 90%, mainly including wood pulp, bamboo pulp and cotton pulp (dissolving pulp in this report just involves wood and bamboo pulps), and finding application mainly in viscose fiber downstream.
In 2014, there were a great number of newly-added capacities for dissolving pulp, such as Sappi’s 330 t/a capacity in North America, Double A (Thailand)’s 175 kt/a capacity, and 110 kt/a capacity of OJI (Japan). However, due to constantly-depressed downstream viscose fiber market, price of dissolving pulp continued to drop, being USD800/ton around at the end of 2014.
In 2015, there are still several dissolving pulp projects under construction, for instance, Lenzing is expanding its dissolving pulp capacity, Aditya Birla builds a 200 kt/a capacity in Laos.
The world’s dissolving pulp industry features quite high concentration and key industrial players consist of Sappi, Aditya Birla, Lenzing, Bracell, Rayonier, etc. In 2014, the total dissolving pulp capacity of the aforesaid five producers accounted for roughly 53.3% of global total, in particular, Sappi owned 1.34 million t/a capacity, holding 18.9% in global total, and set up production bases in South Africa and North America.
China’s dissolving pulp capacity soared from 2011, and had climbed to 1.2 million tons around at the end of 2014, making up 17% of the global total, but due to lack of forest resources, Chinese dissolving pulp requires high production costs and thus shows weak competitiveness.
In 2014, influenced by sluggish downstream viscose fiber industry in China and cheap dissolving pulp in international market, China dissolving pulp industry suffered a huge loss, so some dissolving pulp devices were switched to other products or even halted production, for example, Sun Paper’s dissolving pulp devices were switched to production of paper pulp in April, equipment of Yueyang Forest & Paper began to produce bleached softwood pulp in July, and Fujian Nanping Paper’s devices stopped production.
In April, 2014, Ministry of Commerce of PRC publicized final judge on anti-dumping investigation, which indicated that China would impose anti-dumping rate of 17%, 13% and 6.8% on dissolving pulp imported from United States, Canada and Brazil in the next five years. In addition, newly-added dissolving pulp capacity in China will be relatively few in the future, at that time, excessive supply is predicted to be eased and China dissolving pulp industry will gradually bottom out.
In China, companies owning dissolving pulp production devices are mainly medium and large paper-making enterprises and chemical fiber manufacturers; wherein, the paper-making enterprises is chiefly composed of Yueyang Forest & Paper, Sun Paper and Huatai Paper which mainly provide wood dissolving pulp, and possess 300 kt/a capacity, 200 kt/a capacity and 120 kt/a capacity respectively; and chemical fiber enterprises include Yibin Grace Group and Jilin Chemical Fiber Group whose major product is bamboo dissolving pulp, among which the 95 kt/a bamboo dissolving pulp project of Jilin Chemical Fiber had started trial operation in September, 2014.
Global and China Dissolving Pulp Industry Report, 2014-2017 released by ResearchInChina highlights the followings:
 Market size, competitive landscape, price analysis, etc. of global dissolving pulp industry; Market size, competitive landscape, price analysis, etc. of global dissolving pulp industry;
Market size, competition pattern, import & export, price analysis, development forecast, etc. of China dissolving pulp industry;
Market size, competition pattern, import & export, price analysis, development forecast, etc. of China viscose fiber industry;
Operation, dissolving pulp business analysis, prediction & prospects, etc. of 13 global and Chinese dissolving pulp manufacturers.
第一章 溶解浆产业概述
1.1 定义及分类
1.2 产业链
第二章 全球溶解浆行业概况
2.1 发展现状
2.2 价格分析
第三章 中国溶解浆行业分析
3.1 发展现状
3.2 反倾销调查
3.3 供给分析
3.4 需求分析
3.5 进出口分析
3.5.1 进出口量
3.5.2 进口国家及地区
3.6 竞争格局
3.7 价格分析
第四章 下游粘胶纤维市场分析
4.1 产能分析
4.2 产量分析
4.3 进出口分析
4.3.1 进出口量
4.3.2 进出口国家
4.3.3 进出口地区
4.4 价格分析
第五章 全球溶解浆主要生产企业
5.1 Bracell
5.1.1 公司介绍
5.1.2 经营情况
5.1.3 营收构成
5.1.4 毛利率
5.1.5 溶解浆业务
5.1.6 在华业务
5.2 萨佩
5.2.1 公司简介
5.2.2 经营情况
5.2.3 营收构成
5.2.4 溶解浆业务
5.2.5 在华业务
5.3 博拉集团
5.3.1 公司介绍
5.3.2 Grasim经营情况
5.3.3 Grasim溶解浆业务
5.3.4 在华业务
5.4 兰精
5.4.1 公司介绍
5.4.2 经营情况
5.4.3 纤维部门经营情况
5.4.4 溶解浆业务
5.4.5 在华业务
第六章 中国溶解浆主要生产企业
6.1 太阳纸业
6.1.1 公司简介
6.1.2 经营情况
6.1.3 营收构成
6.1.4 毛利率
6.1.5 溶解浆业务
6.1.6 预测与展望
6.2 吉林化纤
6.2.1 公司简介
6.2.2 经营情况
6.2.3 营收构成
6.2.4 毛利率
6.2.5 溶解浆业务
6.2.6 预测与展望
6.3 福建南纸
6.3.1 公司简介
6.3.2 经营情况
6.3.3 营收构成
6.3.4 毛利率
6.3.5 溶解浆业务
6.3.6 预测与展望
6.4 石岘纸业
6.4.1 公司简介
6.4.2 经营情况
6.4.3 营收构成
6.4.4 毛利率
6.4.5 客户及供应商
6.4.6 溶解浆业务
6.4.7 预测与展望
6.5 青山纸业
6.5.1 公司简介
6.5.2 经营情况
6.5.3 营收构成
6.5.4 毛利率
6.5.5 溶解浆业务
6.5.6 预测与展望
6.6 岳阳林纸
6.6.1 公司简介
6.6.2 经营情况
6.6.3 营收构成
6.6.4 毛利率
6.6.5 溶解浆业务
6.6.6 预测与展望
6.7 晨鸣纸业
6.7.1 公司简介
6.7.2 经营情况
6.7.3 营收构成
6.7.4 毛利率
6.7.5 客户及供应商
6.7.6 溶解浆业务
6.7.7 预测与展望
6.8 华泰股份
6.8.1 公司简介
6.8.2 经营情况
6.8.3 营收构成
6.8.4 毛利率
6.8.5 溶解浆业务
6.8.6 预测与展望
6.9 丝丽雅集团
6.9.1 公司介绍
6.9.2 溶解浆业务
第七章 总结及预测
7.1 总结
7.2 发展预测
7.2.1 供需预测
7.2.2 下游预测
1. Overview of Dissolving Pulp Industry
1.1 Definition & Classification
1.2 Industrial Chain
2. Global Dissolving Pulp Industry
2.1 Status Quo
2.2 Price Analysis
3. China Dissolving Pulp Industry
3.1 Status Quo
3.2 Anti-dumping Investigation
3.3 Supply
3.4 Demand
3.5 Import & Export
3.5.1 Import Volume & Export Volume
3.5.2 Importing Sources & Importing Regions
3.6 Competition Pattern
3.7 Price Analysis
4. Downstream Viscose Fiber Market
4.1 Capacity
4.2 Output
4.3 Import & Export
4.3.1 Import Volume & Export Volume
4.3.2 Importing Sources & Export Destinations
4.3.3 Importing & Exporting Provinces
4.4 Price Analysis
5. Major Dissolving Pulp Companies Worldwide
5.1 Bracell
5.1.1 Profile
5.1.2 Operation
5.1.3 Revenue Structure
5.1.4 Gross Margin
5.1.5 Dissolving Pulp Business
5.1.6 Business in China
5.2 Sappi
5.2.1 Profile
5.2.2 Operation
5.2.3 Revenue Structure
5.2.4 Dissolving Pulp Business
5.2.5 Business in China
5.3 Aditya Birla Group
5.3.1 Profile
5.3.2 Operation of Grasim
5.3.3 Dissolving Pulp Business of Grasim
5.3.4 Business in China
5.4 Lenzing Group
5.4.1 Profile
5.4.2 Operation
5.4.3 Operation of Fiber Business Division
5.4.4 Dissolving Pulp Business
5.4.5 Business in China
6. Main Dissolving Pulp Producers in China
6.1 Sun Paper
6.1.1 Profile
6.1.2 Operation
6.1.3 Revenue Structure
6.1.4 Gross Margin
6.1.5 Dissolving Pulp Business
6.1.6 Prediction & Outlook
6.2 Jilin Chemical Fiber Group
6.2.1 Profile
6.2.2 Operation
6.2.3 Revenue Structure
6.2.4 Gross Margin
6.2.5 Dissolving Pulp Business
6.2.6 Prediction & Outlook
6.3 Fujian Nanping Paper
6.3.1 Profile
6.3.2 Operation
6.3.3 Revenue Structure
6.3.4 Gross Margin
6.3.5 Dissolving Pulp Business
6.3.6 Prediction & Outlook
6.4 Yanbian Shixian Bailu Papermaking
6.4.1 Profile
6.4.2 Operation
6.4.3 Revenue Structure
6.4.4 Gross Margin
6.4.5 Clients & Suppliers
6.4.6 Dissolving Pulp Business
6.4.7 Prediction & Outlook
6.5 Fujian Qingshan Paper Industry
6.5.1 Profile
6.5.2 Operation
6.5.3 Revenue Structure
6.5.4 Gross Margin
6.5.5 Dissolving Pulp Business
6.5.6 Prediction & Outlook
6.6 Yueyang Forest & Paper
6.6.1 Profile
6.6.2 Operation
6.6.3 Revenue Structure
6.6.4 Gross Margin
6.6.5 Dissolving Pulp Business
6.6.6 Prediction & Outlook
6.7 Shandong Chenming Paper Holdings
6.7.1 Profile
6.7.2 Operation
6.7.3 Revenue Structure
6.7.4 Gross Margin
6.7.5 Clients & Suppliers
6.7.6 Dissolving Pulp Business
6.7.7 Prediction & Outlook
6.8 Huatai Paper
6.8.1 Profile
6.8.2 Operation
6.8.3 Revenue Structure
6.8.4 Gross Margin
6.8.5 Dissolving Pulp Business
6.8.6 Prediction & Outlook
6.9 Yibin Grace Group Company
6.9.1 Profile
6.9.2 Dissolving Pulp Business
7 Conclusion & Prediction
7.1 Conclusion
7.2 Prediction
7.2.1 Supply & Demand Prediction
7.2.2 Downstream Prediction
图:溶解木浆的主流产业链
表:溶解浆其他下游产品及用途
表:2014年全球主要溶解浆生产商及其产能
表:2015年全球主要的溶解浆拟/在建项目
图:2011-2015年全球溶解浆价格走势
图:2010-2014年中国溶解浆产能及产量
表:2014年中国溶解浆生产企业产能
图:2010-2014年中国溶解浆表观消费量
图:2010-2014年中国溶解浆进出口量
图:2010-2014年中国溶解浆进出口平均价格
图:2014年中国溶解浆进口来源结构(按进口量)
图:2014年中国溶解浆进口平均价格(按国家)
图:2014年中国溶解浆主要进口省市及其进口量占比
图:2014年中国溶解浆生产企业及其产能占比
图:2012-2015年中国溶解浆市场价格
表:2014年中国粘胶纤维主要生产厂家及产能
图:2014年中国粘胶短纤主要生产企业及其产能占比
图:2006-2014年中国粘胶纤维产量及同比增长
图:2010-2014年中国粘胶短纤进出口量
图:2010-2014年中国粘胶短纤进出口平均价格
图:2014年中国粘胶短纤出口目的地分布(按出口量)
图:2014年中国粘胶短纤进口来源分布(按进口量)
图:2014年中国主要粘胶短纤出口城市的出口量占比
图:2014年中国主要粘胶短纤进口城市的进口量占比
图:2008-2015年中国粘胶短纤和粘胶长丝市场价格
图:Bracell产品链及产品用途
图:2010-2014年Bracell营业收入和净利润
表:2012-2014年Bracell(分产品)营业收入
图:2012-2014年Bracell(分产品)营业收入占比
图:2010-2014年Bracell主营产品毛利率
表:Bracell集团溶解木浆的种类及用途
图:2013-2014年Bracell溶解浆业务收入及EBITDA
表:2013-2014年Bracell溶解浆业务(分地区)收入
图:2013-2014年Bracell溶解浆业务(分地区)收入占比
图:2013-2014年Bracell溶解木浆产量及销售量
图:2013-2014年粘胶浆销售量及占溶解浆销量的比例
图:2013-2014年特种浆销售量及占木溶解浆销量的比例
图:2010-2014年Bracell木溶解浆平均销售价格
表:2014年Sappi三大生产基地生产工厂及其主营产品产能
图:2010-2014年Sappi销售收入和EBITDA
表:2012-2014年Sappi(按分支机构)销售收入
图:2012-2014年Sappi(按分支机构)销售收入占比
图:2013-2014年Sappi(分产品)销售收入占比
表:2012-2014年Sappi(分地区)销售收入
图:2012-2014年Sappi(分地区)销售收入占比
表:2014年Sappi 溶解浆生产工厂及其产能
图:2012-2014年Sappi溶解浆业务销售收入及EBITDA
图:FY2010-FY2014 Grasim净收入及净利润
图:FY2012-FY2014 Grasim公司(分产品)净收入占比
表:2014年Grasim主营产品生产工厂及其产能
图:FY2010-FY2014 Grasim粘胶短纤及溶解浆业务净收入及增长率
图:2010-2014年兰精公司销售收入及EBITDA
图:2012-2014年兰精公司(分部门)销售收入占比
图:2012-2014年兰精公司(分地区)销售收入占比
图:2010-2014年兰精公司纤维部门销售收入及EBITDA
表:2012-2014年兰精公司纤维部门(分产品)销售收入
图:2012-2014年兰精公司纤维部门(分产品)销售收入占比
表:2014年兰精公司溶解浆相关子公司及其产能
图:2010-2014年兰精(南京)纤维营业收入及净利润
图:2010-2014年太阳纸业营业收入及净利润
表:2012-2014年太阳纸业(分产品)营业收入
图:2012-2014年太阳纸业(分产品)营业收入占比
表:2012-2014年太阳纸业(分地区)营业收入
图:2012-2014年太阳纸业(分地区)营业收入占比
图:2012-2014年太阳纸业主营产品毛利率
图:2013-2017年太阳纸业营业收入及净利润预测
表:2014年吉林化纤主营产品产能
图:2010-2014年吉林化纤营业收入和净利润
表:2012-2014年吉林化纤(分产品)营业收入
图:2012-2014年吉林化纤(分产品)营业收入占比
表:2012-2014年吉林化纤(分地区)营业收入
图:2012-2014年吉林化纤(分地区)营业收入占比
表:2012-2014年吉林化纤主营产品毛利率
图:2013-2017年吉林化纤营业收入及净利润预测
图:2010-2014年福建南纸营业收入及净利润
表:2012-2014年福建南纸(分产品)营业收入
图:2012-2014年福建南纸(分产品)营业收入占比
表:2012-2014年福建南纸(分地区)营业收入
图:2012-2014年福建南纸(分地区)营业收入占比
图:2012-2014年福建南纸主营产品毛利率
表:福建南纸溶解浆产品及特点
图:2010-2014年石岘纸业营业收入及净利润
表:2012-2014年石岘纸业(分产品)营业收入
图:2012-2014年石岘纸业(分产品)营业收入占比
表:2012-2014年石岘纸业(分地区)营业收入
图:2012-2014年石岘纸业(分地区)营业收入占比
图:2012-2014年石岘纸业主营产品毛利率
图:2012-2014年石岘纸业前五名客户贡献收入及占比
图:2014H1石岘纸业前五名客户名称、收入贡献及占比
图:2013-2014年石岘纸业前五名供应商采购金额及占比
图:2014H1石岘纸业前五名供应商名称、采购金额及占比
图:2012-2014年石岘纸业溶解浆产销量
图:2013-2017年石岘纸业营业收入及净利润预测
图:2010-2014年青山纸业营业收入及净利润
表:2012-2014年青山纸业(分产品)营业收入
图:2012-2014年青山纸业(分产品)营业收入占比
表:2012-2014年青山纸业(分地区)营业收入
图:2012-2014年青山纸业(分地区)营业收入占比
图:2012-2014年青山纸业主营产品毛利率
图:2013-2017年青山纸业营业收入及净利润预测
图:2010-2014年岳阳林纸营业收入及净利润
表:2013-2014年岳阳林纸(分产品)营业收入
图:2013-2014年岳阳林纸(分产品)营业收入占比
表:2012-2014年岳阳林纸(分地区)营业收入
图:2012-2014年岳阳林纸(分地区)营业收入占比
图:2014年岳阳林纸主营产品毛利率
图:2011-2014年湖南骏泰营业收入和净利润
图:2013-2017年岳阳林纸营业收入和净利润预测
图:2010-2014年晨鸣纸业营业收入及净利润
表:2012-2014年晨鸣纸业(分产品)营业收入
图:2012-2014年晨鸣纸业(分产品)营业收入占比
表:2012-2014年晨鸣纸业(分地区)营业收入
图:2012-2014年晨鸣纸业(分地区)营业收入占比
图:2012-2014年晨鸣纸业主营产品毛利率
图:2012-2014年晨鸣纸业前五名客户贡献收入及占比
图:2014年晨鸣纸业前五名客户名称、收入贡献及占比
图:2012-2014年晨鸣纸业前五名供应商采购金额及占比
图:2014年晨鸣纸业前五名供应商名称、采购金额及占比
图:2013-2017年晨鸣纸业营业收入和净利润预测
图:2010-2014年华泰股份营业收入及净利润
表:2012-2014年华泰股份(分产品)营业收入
图:2012-2014年华泰股份(分产品)营业收入占比
表:2012-2014年华泰股份(分地区)营业收入
图:2012-2014年华泰股份(分地区)营业收入占比
图:2012-2014年华泰股份主营产品毛利率
图:2012-2014年安徽华泰营业收入和净利润
图:2013-2017年华泰股份营业收入和净利润预测
表:2014年丝丽雅集团主营产品产能
表:2013-2014年全球及中国溶解浆生产企业经营情况对比
图:2013-2017年中国溶解浆行业供需预测
图:2013-2017年中国粘胶纤维行业供需预测
Mainstream Industrial Chain of Dissolving Wood Pulp
Other Downstream Products and Applications of Dissolving Pulp
Major Dissolving Pulp Manufacturers Worldwide and Their Capacities, 2014
Major Dissolving Pulp Projects Planned or Under Construction Worldwide, 2015
Price Tendency of Dissolving Pulp Worldwide, 2011-2015
Capacity and Output of Dissolving Pulp in China, 2010-2014
Capacities of Dissolving Pulp Manufacturers in China, 2014
Apparent Consumption of Dissolving Pulp in China, 2010-2014
Import & Export Volume of Dissolving Pulp in China, 2010-2014
Average Import & Export Price of Dissolving Pulp in China, 2010-2014
Import Source Structure of Dissolving Pulp in China by Import Volume, 2014
Average Import Price of Dissolving Pulp in China by Country, 2014
Major Dissolving Pulp Import Provinces/Municipalities and Their Import Volume in China (%), 2014
Dissolving Pulp Manufacturers in China and Their Capacities (%), 2014
Dissolving Pulp Market Price in China, 2012-2015
Major Viscose Fiber Manufacturers in China and Their Capacities, 2014
Major Viscose Staple Fiber Manufacturers in China and Their Capacities (%), 2014
Output and YoY Growth Rate of Viscose Fiber in China, 2006-2014
Import and Export Volume of Viscose Staple Fiber in China, 2010-2014
Average Import and Export Price of Viscose Staple Fiber in China, 2010-2014
Export Destinations of Viscose Staple Fiber in China by Export Volume, 2014
Import Sources of Viscose Staple Fiber in China by Import Volume, 2014
Major Viscose Staple Fiber Export Cities and Their Export Volume in China (%), 2014
Major Viscose Staple Fiber Import Cities and Their Import Volume in China (%), 2014
Market Price of Viscose Staple Fiber and Viscose Filament Yarn in China, 2008-2015
Bracell’s Product Chain and Product Application
Revenue and Net Income of Bracell, 2010-2014
Revenue of Bracell by Product, 2012-2014
Revenue Structure of Bracell by Product, 2012-2014
Gross Margin of Primary Products of Bracell, 2010-2014
Categories and Application of Bracell’s Dissolving Wood Pulp
Revenue and EBITDA of Bracell’s Dissolving Pulp Business, 2013-2014
Revenue of Bracell’s Dissolving Pulp Business by Region, 2013-2014
Revenue Structure of Bracell’s Dissolving Pulp Business by Region, 2013-2014
Output and Sales Volume of Bracell’s Dissolving Wood Pulp, 2013-2014
Viscose Pulp Sales Volume and % in Total of Bracell’s Dissolving Pulp Business, 2013-2014
Special Pulp Sales Volume and % in Total of Bracell’s Dissolving Wood Pulp Business, 2013-2014
Average Selling Price of Sateri’s Dissolving Wood Pulp Product, 2010-2014
Three Major Production Bases of Sappi and Capacities of Its major Products, 2014
Sales and EBITDA of Sappi, 2010-2014
Sales of Sappi by Branch, 2012-2014
Sales Structure of Sappi by Branch, 2012-2014
Sales Structure of Sappi by Product, 2013-2014
Sales of Sappi by Region, 2012-2014
Sales Structure of Sappi by Region, 2012-2014
Dissolving Pulp Plants of Sappi and Their Capacities, 2014
Revenue and EBITDA of Sappi’s Dissolving Pulp Business, 2012-2014
Revenue and Net Income of Grasim, FY2010-FY2014
Revenue Structure of Grasim by Product, FY2012-FY2014
Major Plants of Grasim’s Primary Products and Their Capacities, 2014
Revenue and YoY Growth Rate of Grasim’s Viscose Staple Fiber and Dissolving Pulp Business, FY2010-FY2014
Sales and EBITDA of Lenzing Group, 2010-2014
Sales Structure of Lenzing Group by Segment, 2012-2014
Sales Structure of Lenzing Group by Region, 2012-2014
Sales and EBITDA from Fiber Business Division of Lenzing Group, 2010-2014
Sales from Fiber Business Division of Lenzing Group by Product, 2012-2014
Sales Structure from Fibre Business Division of Lenzing Group by Product, 2012-2014
Dissolving-pulp-related Subsidiaries of Lenzing Group and Their Capacities, 2014
Revenue and Net Income of Lenzing Group (Nanjing), 2010-2014
Revenue and Net Income of Sun Paper, 2010-2014
Revenue of Sun Paper by Product, 2012-2014
Revenue Structure of Sun Paper by Product, 2012-2014
Revenue of Sun Paper by Region, 2012-2014
Revenue Structure of Sun Paper by Region, 2012-2014
Gross Margin of Sun Paper’s Hit Products, 2012-2014
Revenue and Net Income of Sun Paper, 2013-2017E
Capacities of Jilin Chemical Fiber Group’s Hit Products, 2014
Revenue and Net Income of Jilin Chemical Fiber Group, 2010-2014
Revenue of Jilin Chemical Fiber Group by Product, 2012-2014
Revenue Structure of Jilin Chemical Fiber Group by Product, 2012-2014
Revenue of Jilin Chemical Fiber Group by Region, 2012-2014
Revenue Structure of Jilin Chemical Fiber Group by Region, 2012-2014
Gross Margin of Jilin Chemical Fiber Group’s Major Products, 2012-2014
Revenue and Net Income of Jilin Chemical Fiber Group, 2013-2017E
Revenue and Net Income of Fujian Nanping Paper, 2010-2014
Revenue of Fujian Nanping Paper by Product, 2012-2014
Revenue Structure of Fujian Nanping Paper by Product, 2012-2014
Revenue of Fujian Nanping Paper by Region, 2012-2014
Revenue Structure of Fujian Nanping Paper by Region, 2012-2014
Gross Margin of Fujian Nanping Paper’s Main Products, 2012-2014
Dissolving Pulp Products and Features of Fujian Nanping Paper
Revenue and Net Income of Yanbian Shixian Bailu Papermaking, 2010-2014
Revenue of Yanbian Shixian Bailu Papermaking by Product, 2012-2014
Revenue Structure of Yanbian Shixian Bailu Papermaking by Product, 2012-2014
Revenue of Yanbian Shixian Bailu Papermaking by Region, 2012-2014
Revenue Structure of Yanbian Shixian Bailu Papermaking by Region, 2012-2014
Gross Margin of Yanbian Shixian Bailu Papermaking’s Main Products, 2012-2014
Yanbian Shixian Bailu Papermaking’s Revenue from Top Five Clients and % of Total Revenue, 2012-2014
Name List and Revenue Contribution of Yanbian Shixian Bailu Papermaking’s Top 5 Clients, 2014H1
Yanbian Shixian Bailu Papermaking’s Procurement from Top Five Suppliers and % in Total, 2013-2014
Name List and Procurment Proportion of Yanbian Shixian Bailu Papermaking’s Top Five Suppliers, 2014H1
Output and Sales Volume of Yanbian Shixian Bailu Papermaking’s Dissolving Pulp, 2012-2014
Revenue and Net Income of Yanbian Shixian Bailu Papermaking, 2013-2017E
Revenue and Net Income of Fujian Qingshan Paper Industry, 2010-2014
Revenue of Fujian Qingshan Paper Industry by Product, 2012-2014
Revenue Structure of Fujian Qingshan Paper Industry by Product, 2012-2014
Revenue of Fujian Qingshan Paper Industry by Region, 2012-2014
Revenue Structure of Fujian Qingshan Paper Industry by Region, 2012-2014
Gross Margin of Fujian Qingshan Paper Industry’s Main Products, 2012-2014
Revenue and Net Income of Fujian Qingshan Paper Industry, 2013-2017E
Revenue and Net Income of Yueyang Forest & Paper, 2010-2014
Revenue of Yueyang Forest & Paper by Product, 2013-2014
Revenue Structure of Yueyang Forest & Paper by Product, 2013-2014
Revenue of Yueyang Forest & Paper by Region, 2012-2014
Revenue Structure of Yueyang Forest & Paper by Region, 2012-2014
Gross Margin of Yueyang Forest & Paper’s Main Products, 2014
Revenue and Net Income of Hunan Juntai Pulp & Paper, 2011-2014
Revenue and Net Income of Yueyang Forest & Paper, 2013-2017E
Revenue and Net Income of Shandong Chenming Paper Holdings, 2010-2014
Revenue of Shandong Chenming Paper Holdings by Product, 2012-2014
Revenue Structure of Shandong Chenming Paper Holdings by Product, 2012-2014
Revenue of Shandong Chenming Paper Holdings by Region, 2012-2014
Revenue Structure of Shandong Chenming Paper Holdings by Region, 2012-2014
Gross Margin of Shandong Chenming Paper Holdings’s Major Products, 2012-2014
Shandong Chenming’s Revenue from Top Five Clients and % of Total Revenue, 2012-2014
Name List and Revenue Contribution of Shandong Chenming’s Top 5 Clients, 2014
Shandong Chenming’s Procurement from Top Five Suppliers and % in Total, 2012-2014
Name List and Procurement Proportion of Shandong Chenming’s Top Five Suppliers, 2014
Revenue and Net Income of Shandong Chenming. 2013-2017E
Revenue and Net Income of Shandong Huatai Paper, 2010-2014
Revenue of Shandong Huatai Paper by Product, 2012-2014
Revenue Structure of Shandong Huatai Paper by Product, 2012-2014
Revenue of Shandong Huatai Paper by Region, 2012-2014
Revenue Structure of Shandong Huatai Paper by Region, 2012-2014
Gross Margin of Shandong Huatai Paper’s Major Products, 2012-2014
Revenue and Net Income of Anhui Huatai, 2012-2014
Revenue and Net Income of Shandong Huatai Paper, 2013-2017E
Capacities of Yibin Grace Group Company’s Main Products, 2014
Operation Comparison among Major Dissolving Pulp Manufacturers in China and Worldwide, 2013-2014
Supply and Demand of China Dissolving Pulp Industry, 2013-2017E
Supply and Demand of China Viscose Fiber Industry, 2013-2017E
如果这份报告不能满足您的要求,我们还可以为您定制报告,请 留言说明您的详细需求。
|