|
|
|
报告导航:研究报告—
生命科学—生物科技
|
|
2015-2018年中国血液制品行业研究报告 |
 |
字数:4.8万 |
页数:135 |
图表数:138 |
|
中文电子版:8500元 |
中文纸版:4250元 |
中文(电子+纸)版:9000元 |
|
英文电子版:2500美元 |
英文纸版:2650美元 |
英文(电子+纸)版:2800美元 |
|
编号:ZYM063
|
发布日期:2015-04 |
附件:下载 |
 |
|
|
虽然重组血液制品在国外已发展多年,但中国血液制品生产均是从人体血液中分离提取的各类蛋白质。因此,血浆资源的储备和控制是中国血液制品企业发展的关键之一。
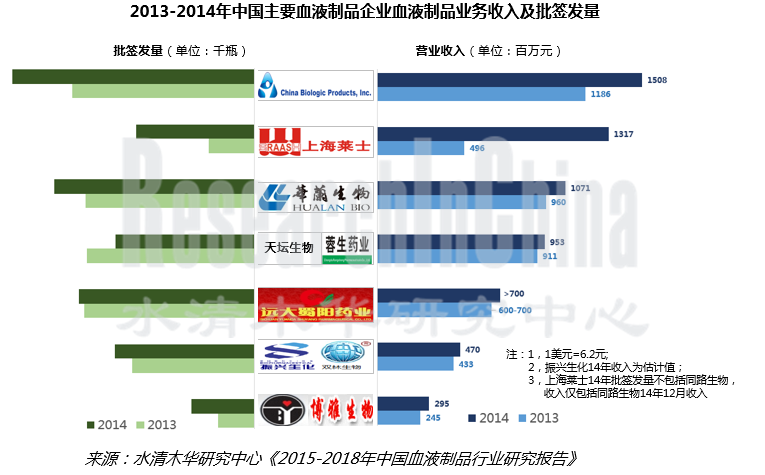
受行业高景气度和利好政策等影响,2014年中国血浆投浆量突破4000吨,批签发总量5240万瓶,同比增长15%。按批签发量计,人血白蛋白、狂犬病人免疫球蛋白、静注人免疫球蛋白和破伤风免疫球蛋白为2014年中国血液制品前四产品,批发签量分别占同期血液制品总量的59.8%、14.6%、13.6%和4.1%。
与此同时,市场需求强劲的人凝血因子VIII、人凝血酶原复合物等小制品近两年供应与研发能力也在不断提高。2014年这两种产品批签发量分别同比增长43.9%、46.3%。并且成都蓉生、广东丹霞、远大蜀阳、山西康宝等企业的人凝血因子VIII已于2014年获得临床批准。
由于国内新建血浆站要求严格,资金相对雄厚、研发能力较强且浆站资源相对丰富的上海莱士、中国生物制品(山东泰邦和贵州泰邦)、华兰生物、天坛生物(包括成都蓉生)、远大蜀阳等已成为中国血液制品行业前五企业。2014年这五家投浆量合计约占全国总量的61.3%;营业收入占同期中国血液制品市场的33.6%。
其中,上海莱士是通过两次并购同行企业一跃成为中国血液制品的龙头。2014 年,上海莱士分别斥资18 亿元、47.58 亿元收购邦和药业(现名郑州莱士)与同路药业。收购兼并后,上海莱士的血液制品品种由原先的7个增加至11个,公司下属单采血浆站由12家扩增至28家,采浆能力从400吨增长到900吨。
《2015-2018年中国血液制品行业研究报告》主要包括以下几个方面:
 中国血液制品疫苗行业市场特点、运行环境、总体现状等; 中国血液制品疫苗行业市场特点、运行环境、总体现状等;
中国血液制品行业市场供需、竞争格局、进出口及发展预测等;
中国人血白蛋白、静丙、破伤风人免疫球蛋白、凝血因子等8种血液制品细分产品的市场供需、竞争格局等;
中国12家主要血液制品企业的经营状况、血液制品业务及发展前景等。
Recombinant blood products have developed for many years in foreign countries, but China’s blood products are still proteins extracted from human blood. Thus, reserves and control of plasma resources are the key to the development of Chinese blood product enterprises.
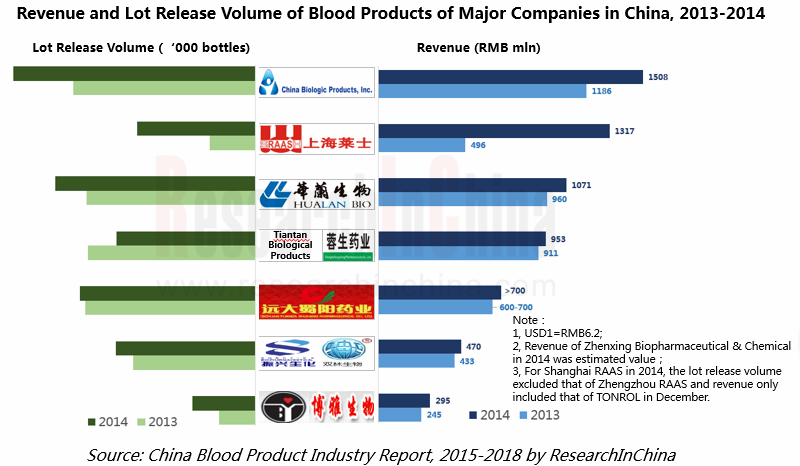
Amid the industrial prosperity and favorable policies, China’s production-use plasma volume broke through 4,000 tons and the total lot release volume jumped by 15% year on year to 52.4 million bottles in 2014. By lot release volume, human albumin, human rabies immunoglobulin, human immunoglobulin (ph4) for intravenous injection and tetanus immunoglobulin were the most popular blood products in China in 2014, accounting for 59.8%, 14.6%, 13.6% and 4.1% of the total lot release volume respectively.
At the same time, the supply and R & D capabilities of human blood coagulation factor VIII, human prothrombin complex and other small products in rigid demand have been intensified in recent years. In 2014, the lot release volume of the above two products ascended by 43.9% and 46.3% year on year respectively. Chengdu Rongsheng, Guangdong Danxia, Yuanda Shuyang, Shanxi Kangbao and other enterprises obtained clinical approval for their human blood coagulation factor VIII in 2014.
Given stringent requirements on new domestic plasma stations, Shanghai RAAS, China Biologic Products (Shandong Taibang and Guizhou Taibang), Hualan Biological Engineering, Tiantan Biological (including Chengdu Rongsheng) and Yuanda Shuyang which boast abundant capital, powerful R&D strength and rich plasma station resources have become the top five companies in China blood product industry, contributing 61.3% to China’s production-use plasma volume and 33.6% to China’s blood product revenue in 2014.
Shanghai RAAS turns to be a Chinese blood product leader through two acquisitions. In 2014, it took over Banghe Pharmaceutical (now known as Zhengzhou RAAS) and TONROL for RMB1.8 billion and RMB4.758 billion separately, so that the blood product varieties of the company increased from 7 to 11, the number of plasma collection stations rose from 12 to 28, and its plasma collection capacity expanded from 400 tons to 900 tons.
China Blood Product Industry Report, 2015-2018 focuses on the followings:
 Market characteristics, operating environments, status quo, etc. of China blood product industry; Market characteristics, operating environments, status quo, etc. of China blood product industry;
Supply and demand, competitive landscape, import & export, development forecast, etc. of China blood product industry;
Supply and demand, competitive landscape, etc. of 8 blood product segments, including human albumin, human immunoglobulin (pH4) for intravenous injection, blood coagulation factor and tetanus human immunoglobulin.
Operation, blood product business and development prospects of 12 major Chinese blood product companies.
第一章 血液制品行业概述
1.1血液制品定义
1.2血液制品分类
1.3重组血液制品
1.4血液制品产业链
1.5血液制品特点
第二章 中国血液制品行业总体概述
2.1市场规模
2.2发展现状
2.3 市场供需
2.3.1 市场供给
2.3.2 市场需求
2.4 市场竞争
2.5运行环境
2.5.1国际市场
2.5.2政策环境
2.5.3国内生物制药市场
2.6进出口分析
第三章 中国血液制品细分市场分析
3.1人血白蛋白
3.1.1 市场供需
3.1.2 竞争格局
3.1.3 发展前景
3.2静注人免疫球蛋白(ph4)
3.2.1 市场供需
3.2.2竞争格局
3.3凝血因子VIII
3.3.1 市场供需
3.3.2 竞争格局
3.3.3 发展前景
3.4乙肝免疫球蛋白
3.4.1 市场供需
3.4.2竞争格局
3.5人免疫球蛋白
3.5.1 市场供需
3.5.2 竞争格局
3.6人凝血酶原复合物
3.6.1 市场供需
3.6.2竞争格局
3.7破伤风免疫球蛋白
3.7.1 市场供需
3.7.2竞争格局
3.8狂犬病人免疫球蛋白
3.8.1 市场供需
3.8.2 竞争格局
第四章 国内主要厂商
4.1中国生物制品有限公司(NASDAQ :CBPO)
4.1.1公司介绍
4.1.2经营状况
4.1.3 营收构成
4.1.4 客户及供应商
4.1.5 研发与投资
4.1.6 山东泰邦生物制品有限公司
4.1.7 贵州泰邦生物制品有限公司
4.1.8 西安回天血液制品有限责任公司
4.1.9 前景及预测
4.2华兰生物工程股份有限公司(002007.SZ)
4.2.1公司介绍
4.2.2 经营状况
4.2.3 营收构成
4.2.4 毛利率
4.2.5 客户与供应商
4.2.6 研发与投资
4.2.7 血液制品
4.2.8 前景及预测
4.3上海莱士血液制品股份有限公司(002252.SZ)
4.3.1 公司介绍
4.3.2 经营状况
4.3.3 营收构成
4.3.4 毛利率
4.3.5 客户及供应商
4.3.6 研发及投资
4.3.7 前景及预测
4.4北京天坛生物制品股份有限公司(600161.SH)
4.4.1公司介绍
4.4.2 经营状况
4.4.3 营收构成
4.4.4 客户与供应商
4.4.5 毛利率
.4.4.6 研发和投资
4.4.7 血液制品(成都蓉生药业有限公司)
4.4.8 前景及预测
4.5振兴生化股份有限公司(000403.SZ)
4.5.1 公司介绍
4.5.2 经营状况
4.5.3 营收构成
4.5.4 毛利率
4.5.5 客户及供应商
4.5.6 研发及投资
4.5.7 血液制品(广东双林生物制药有限公司)
4.5.8 前景及预测
4.6江西博雅生物制药有限公司(300294.SZ)
4.6.1公司介绍
4.6.2经营状况
4.6.3 营收构成
4.6.4 毛利率
4.6.5 客户及供应商
4.6.6 研发及投资
4.6.7 前景及预测
4.7四川远大蜀阳药业股份有限公司
4.7.1公司介绍
4.7.2血液制品业务
4.8上海生物制品研究所
4.8.1公司介绍
4.8.2血液制品业务
4.9山西康宝生物制品股份有限公司
4.9.1公司介绍
4.9.2血液制品业务
4.10绿十字
4.10.1公司介绍
4.10.2血液制品业务
4.11 武汉人福医药集团股份有限公司(600079.SH)
4.11.1公司简介
4.11.2 经营状况
4.11.3 血液制品(武汉中原瑞德生物制品有限责任公司)
4.12 云南沃森生物技术股份有限公司(300142.SZ)
4.12.1 公司简介
4. 12.2 经营状况
4.12.3 血液制品(河北大安制药有限公司)
第五章 总结与预测
5.1 公司分析
5.2 发展预测
1. Overview of Blood Product Industry
1.1 Definition
1.2 Classification
1.3 Recombinant Blood Products
1.4 Industry Chain
1.5 Features
2. Overview of China Blood Product Industry
2.1 Market Size
2.2 Status Quo
2.3 Supply and Demand
2.3.1 Supply
2.3.2 Demand
2.4 Market Competition
2.5 Operating Environment
2.5.1 International Market
2.5.2 Policy
2.5.3 Domestic Biopharmaceutical Market
2.6 Import and Export
3. Blood Product Market Segments in China
3.1 Human Albumin
3.1.1 Supply and Demand
3.1.2 Competitive Landscape
3.1.3 Development Prospect
3.2 Human Immunoglobulin (pH4) for Intravenous Injection
3.2.1 Supply and Demand
3.2.2Competitive Landscape
3.3 Blood Coagulation Factor VIII
3.3.1 Supply and Demand
3.3.2 Competitive Landscape
3.3.3 Development Prospect
3.4 Hepatitis B Immunoglobulin
3.4.1 Supply and Demand
3.4.2Competitive Landscape
3.5 Human Immunoglobulin
3.5.1 Supply and Demand
3.5.2 Competitive Landscape
3.6 Human Prothrombin Complex
3.6.1 Supply and Demand
3.6.2 Competitive Landscape
3.7 Tetanus Immunoglobulin
3.7.1 Supply and Demand
3.7.2Competitive Landscape
3.8 Human Rabies Immunoglobulin
3.8.1 Supply and Demand
3.8.2 Competitive Landscape
4. Major Chinese Manufacturers
4.1 China Biologic Products Inc. (NASDAQ: CBPO)
4.1.1 Profile
4.1.2 Operation
4.1.3 Revenue Structure
4.1.4 Customers and Suppliers
4.1.5 R & D and Investment
4.1.6 Shandong Taibang Biological Products Co., Ltd.
4.1.7 Guizhou Taibang Biological Products Co., Ltd.
4.1.8 Xi'an Huitian Blood Products Co., Ltd.
4.1.9 Prospect and Forecast
4.2 Hualan Biological Engineering Inc. (002007.SZ)
4.2.1 Profile
4.2.2 Operation
4.2.3 Revenue Structure
4.2.4 Gross Margin
4.2.5 Customers and Suppliers
4.2.6 R & D and Investment
4.2.7 Blood Products
4.2.8 Prospect and Forecast
4.3 Shanghai RAAS Blood Products Co., Ltd. (002252.SZ)
4.3.1 Profile
4.3.2 Operation
4.3.3 Revenue Structure
4.3.4 Gross Margin
4.3.5 Customers and Suppliers
4.3.6 R & D and Investment
4.3.7 Prospect and Forecast
4.4 Beijing Tiantan Biological Products Co., Ltd. (600161.SH)
4.4.1 Profile
4.4.2 Operation
4.4.3 Revenue Structure
4.4.4 Customers and Suppliers
4.4.5 Gross Margin
.4.4.6 R & D and Investment
4.4.7 Blood Products (Chengdu Rongsheng Pharmaceutical Co., Ltd.)
4.4.8 Prospect and Forecast
4.5 Zhenxing Biopharmaceutical and Chemical Co., Ltd. (000403.SZ)
4.5.1 Profile
4.5.2 Operation
4.5.3 Revenue Structure
4.5.4 Gross Margin
4.5.5 Customers and Suppliers
4.5.6 R & D and Investment
4.5.7 Blood Products (Guangdong Shuanglin Bio-Pharmacy Co., Ltd.)
4.5.8 Prospect and Forecast
4.6 Jiangxi Boya Bio-Pharmaceutical Co., Ltd. (300294.SZ)
4.6.1 Profile
4.6.2 Operation
4.6.3 Revenue Structure
4.6.4 Gross Margin
4.6.5 Customers and Suppliers
4.6.6 R & D and Investment
4.6.7 Prospect and Forecast
4.7 Sichuan Yuanda Shuyang Pharmaceutical Co., Ltd.
4.7.1 Profile
4.7.2 Blood Products
4.8 Shanghai Institute of Biological Products Co., Ltd.
4.8.1 Profile
4.8.2 Blood Products
4.9 Shanxi Kangbao Biological Product Co., Ltd.
4.9.1 Profile
4.9.2 Blood Products
4.10 Green Cross
4.10.1 Profile
4.10.2 Blood Products
4.11 Humanwell Healthcare Group Co., Ltd. (600079.SH)
4.11.1 Profile
4.11.2 Operation
4.11.3 Blood Products (Wuhan Zhongyuan Ruide Biological Product Co., Ltd.)
4.12 Walvax Biotechnology Co, Ltd. (300142.SZ)
4.12.1 Profile
4. 12.2 Operation
4.12.3 Blood Products (Hebei Da’an Pharmaceutical Co., Ltd.)
5. Summary and Forecast
5.1 Company Analysis
5.2 Forecast
图:血液的基本组成
图:血浆蛋白分离程序
表:血液制品的分类及作用
表:基因重组类血制品与传统血制品对比
表:国内外重组血液制品产品种类及对比
图:血液制品产业链
图:血浆采集与分离的生产工艺耗时
图:血液制品企业与化学制药企业运营成本及费用对比
表:2014年中国部分血液制品价格
图:2003-2014年中国血液制品市场规模
表:2008-2014年中国血液制品(分产品)批签发量
图:2009-2014年中国血液制品产品结构(按批签发量计)
图:2002-2014年中国血浆年投浆量
图:截止2014年底中国血浆站资源地域分布
表:中国主流血液制品医保覆盖情况
表:中国与发达国家血液制品人均使用量的对比
表:2014年中国主要血液制品企业血浆站分布、投浆量及血液制品业务收入
表:中国血液制品生产企业产品线对比
图:2013年全球血液制品企业竞争格局
图:全球血液制品产品结构
表:国外上市的血液制品
表:全球血液制品生产商
表:中国血液制品主要政策
表:2014年中国药品最高零售价相关政策
图:2008-2014年中国进口人血白蛋白批签发量
图:2005-2014年中国样本医院人血白蛋白平均采购价格
图:2007-2014年中国人血白蛋白国产与进口比例(按批签发量计)
表:2008-2014年中国人血白蛋白主要厂商市场份额(按批签发量计)
表:2013年世界各国每千人静丙消费量
图:2005-2014年中国样本医院人血白蛋白平均采购价格
图:2007-2014年中国静丙(ph4)的批签发数量及增长率
图:中国与其他国家静丙(ph4)价格对比
图:2007-2014年中国静注人免疫球蛋白主要厂商市场份额(按批签发量计)
图:2008-2014年中国凝血因子VIII批签发数量及增长率
图:2008-2014年中国人凝血因子VIII厂商市场份额(按批签发量计)
表:人源性凝血因子VIII与重组凝血因子VIII的比较
图:世界主要国家人均重组Ⅷ因子与血浆Ⅷ因子的使用量
图:2009-2014年中国乙肝免疫球蛋白的批签发数量及增长率
图:2008-2014年中国乙肝免疫球蛋白市场主要厂商市场份额(按批签发量计)
表:2014年中国各剂型人免疫球蛋白价格
图:2008-2014年中国人免疫球蛋白批签发数量及增长率
图:2008-2014年中国人免疫球蛋白批签发量主要厂商市场份额(按批签发量计)
图:2008-2014年中国人凝血酶原复合物批发签量及增长率
图:2008-2014年中国人凝血酶原复合物厂商市场份额(按批签发量计)
图:2008-2014年中国破伤风免疫球蛋白批签发数量及增长率
图:2008-2014年中国破伤风免疫球蛋白主要厂商市场份额(按批签发数量计)
图:2008-2014年中国狂犬病人免疫球蛋白批签发数量及增长率
图:2008-2014年中国狂犬病人免疫球蛋白主要厂商市场份额(按批签发量计)
图:截至2014年底中国生物制品股权结构图
表:2014年中国生物制品血液制品生产基地及浆站分布
图:2007-2014年中国生物制品营业收入和营业利润
图:2011-2014年中国生物制品毛利率
表:2011-2014年中国生物制品(分产品)营业收入
图:2010-2014年中国生物制品(分产品)营业收入构成
图:2008-2014年中国生物制品前五客户收入贡献及占总营业收入的比重
图:2010-2014年中国生物制品研发投入及占营业收入的比重
表:截止2014年底中国生物制品在研新品
表:2008-2014年山东泰邦血液制品批签发量
表:2008-2014年贵阳黔峰血液制品批签发量(单位:千瓶)
表:2008-2014年西安回天血液制品批签发量
图:2014-2018年中国生物制品营业收入与营业利润
图:2007-2014年华兰生物营业收入和营业利润
表:2007-2014年华兰生物(分行业)营业收入
表:2007-2014年华兰生物(分产品)毛利率
图:2007-2014年华兰生物前五客户收入贡献及占总营业收入的比重
图:2007-2014年华兰生物前五供应商采购金额及占总采购金额的比重
表;2014年华兰生物前五供应商名称、采购金额及其占比
图:2007-2014年华兰生物研发投入及占营业收入的比重
表:华兰生物血液制品种类及规格
表:截止2014年底华兰生物采浆站分布
表:2008-2014年华兰生物血液制品批发签量
图:2007-2014年华兰生物血液制品营业收入及毛利率
表:2007-2014年华兰生物血液制品(分产品)营业收入及毛利率
图:2014-2018年华兰生物营业收入与营业利润
表:截止2014年底上海莱士血浆站分布情况
图:2008-2014年上海莱士营业收入和营业利润
表:2008- 2014 年上海莱士血液制品批发签量
表:2008-2014年同路生物血液制品批签发量
表:2008-2014年上海莱士(分产品)主营业收入
表: 2008-2014年上海莱士(分地区)营业收入
图:2008-2014年上海莱士(分产品)毛利率
图:2007-2014年上海莱士前五客户收入贡献及其占比
图:2007-2014年上海莱士前五供应商采购额占总采购金额的比重
图:2007-2014年上海莱士研发投入及占营业收入的比重
图:2014-2018年上海莱士营业收入与营业利润
表:2014天坛生物子公司及其收入、利润(百万元)
图:2007-2014年天坛生物营业收入和营业利润
图:2007-2014年天坛生物(分行业)营业收入
表:2007-2014年天坛生物(分地区)营业收入
图:2008-2014年天坛生物前五供应商及其采购金额占总采购金额比重
图:2008-2014年天坛生物前五客户收入贡献及占总营业收入的比重
图: 2008-2014年天坛生物(分行业)毛利率
图:2009-2014年天坛生物研发成本及占营业收入的比重
表:截至2014年底天坛生物采浆站分布
图:2007-2014年天坛生物血液制品营业收入及毛利率
表:2008-2013年成都蓉生和天坛生物血液制品批发签量
图:2014-2018年天坛生物营业收入与营业利润
图:2008-2014年ST生化营业收入与营业利润
表:2009-2014年ST生化(分产品)主营业收入
表:2009-2014年ST生化(分产品)毛利率
图:2009-2014年ST生化前五客户收入贡献及占同期营业收入的比重
表:2013年ST生化前五供应商购金额及占同期采购总额的比重
图:2009-2014年ST生化研发投入及占同期营业收入的比重
图:2010-2014年双林生物投浆量
表:截至2014年6月底双林生物采浆站分布
表:2008-2014年双林生物血液制品批发签量
图:2009-2014年ST生化血液制品营业收入与毛利率
图:2014-2018年ST生化营业收入与营业利润预测
图:2008-2014年博雅生物采浆量
图:2008-2014年博雅生物营业收入和营业利润
表:2009-2014年博雅生物(分产品)营业收入
表:2011-2014年博雅生物主要血液制品批签发量
表:2009-2014年博雅生物(分地区)主营业收入
图:2009-2014年博雅生物(分产品)毛利率
图:2009-2013年博雅生物前五客户收入贡献及占营业收入的比重
表:2014年博雅生物前五客户名称、收入贡献及占比
图:2009-2014年博雅生物前五供应商采购金额及占总采购金额的比重
图:2009-2014年博雅生物研发投入及占营业收入比重
图:2014-2018年博雅生物营业收入与营业利润预测
表:截止2014年底蜀阳药业血浆站分布
表:2008-2014年远大蜀阳血液制品批签发量
表:2008-2014年上海所血液制品批签发量
表:截止2014年底上海所血浆站分布
表:截止2014年底山西康宝血浆站分布
表:2008-2014年康宝生物血液制品批签发量
表:截止2014年底绿十字(中国)血浆站分布
表:2008-2014年绿十字(中国)血液制品批签发量
图:2009-2014年人福医药营业收入与营业利润
表:2008-2014年武汉瑞德血液制品批发签量
图:沃森生产产业布局
图:2009-2014年沃森生物营业收入与营业利润
表:2009-2014年沃森生物(分产品)营业收入
图:截止2014年12月中国主要血液制品企业浆站分布
图:2014年中国主要血液制品企业投浆量
图:2011-2014年中国主要血液制品企业的血液制品收入
表:2008-2014年中国血液制品行业主要并购事件
图:2013-2018年中国血液制品市场规模
图:2011-2014年中国主要血液制品企业毛利率
Basic Composition of Blood
Plasma Protein Separation Procedure
Classification and Efficacy of Blood Products
Comparison between Gene Recombinant Blood Products and Traditional Blood Products
Comparison between Chinese and Overseas Recombinant Blood Products in Types
Blood Product Industry Chain
Time Length of Plasma Collection and Separation Process
Comparison between Blood Product Companies and Chemical & Pharmaceutical Enterprises in Operating Costs and Expenses
Prices of Some Blood Products in China, 2014
Chinese Blood Product Market Size, 2003-2014
Lot Release Volume of Blood Products in China (by Product), 2008-2014
Blood Product Structure in China (by Lot Release Volume), 2009-2014
Annual Production-use Plasma Volume in China, 2002-2014
Geographical Distribution of Plasma Collection Stations in China by the End of 2014
Main Blood Products with Medical Insurance Coverage in China
Comparison between China and Developed Countries in Per Capita Consumption of Blood Products
Plasma Station Distribution, Production-use Plasma Volume and Blood Product Revenue of Major Blood Product Manufacturers in China, 2014
Product Line Comparison between Blood Product Manufacturers in China
Competitive Landscape of Global Blood Product Enterprises, 2013
Product Structure of Global Blood Products
Blood Products Available in Foreign Countries
Global Blood Product Manufacturers
Major Policies on Blood Products in China
Policies on Maximum Retail Prices of Drugs in China, 2014
Lot Release Volume of Imported Human Albumin in China, 2008-2014
Average Human Albumin Purchase Price of Sample Hospitals in China, 2005-2014
Ratio of Domestically-produced to Imported Human Albumin in China (by Lot Release Volume), 2007-2014
Market Share of Major Human Albumin Manufacturers in China (by Lot Release Volume), 2008-2014
Consumption of Human Immunoglobulin (pH4) for Intravenous Injection Per 1,000 People by Country, 2013
Average Human Albumin Purchase Price of Sample Hospitals in China, 2005-2014
Lot Release Volume and Growth Rate of Human Immunoglobulin (pH4) for Intravenous Injection in China, 2007-2014
Price Comparison between Chinese and Overseas Human Immunoglobulin (pH4) for Intravenous Injection
Market Share of Major Manufacturers of Human Immunoglobulin (pH4) for Intravenous Injection in China (by Lot Release Volume), 2007-2014
Lot Release Volume and Growth Rate of Blood Coagulation Factor VIII in China, 2008-2014
Market Share of Major Human Blood Coagulation Factor VIII Manufacturers in China (by Lot Release Volume), 2008-2014
Comparison between Human Blood Coagulation Factor VIII and Recombinant Blood Coagulation Factor VIII
Per Capita Consumption of Recombinant VIII Factor and Plasma VIII Factor in Major Countries
Lot Release Volume and Growth Rate of Hepatitis B Immunoglobulin in China, 2009-2014
Market Share of Major Hepatitis B Immunoglobulin Manufacturers in China (by Lot Release Volume), 2008-2014
Prices of Human Immunoglobulin in China by Dosage, 2014
Lot Release Volume and Growth Rate of Human Immunoglobulin in China, 2008-2014
Market Share of Major Human Immunoglobulin Manufacturers in China (by Lot Release Volume), 2008-2014
Lot Release Volume and Growth Rate of Human Prothrombin Complex in China, 2008-2014
Market Share of Major Human Prothrombin Complex Manufacturers in China (by Lot Release Volume), 2008-2014
Lot Release Volume and Growth Rate of Tetanus Immunoglobulin in China, 2008-2014
Market Share of Major Tetanus Immunoglobulin Manufacturers in China (by Lot Release Volume), 2008-2014
Lot Release Volume and Growth Rate of Human Rabies Immunoglobulin in China, 2008-2014
Market Share of Major Human Rabies Immunoglobulin Manufacturers in China (by Lot Release Volume), 2008-2014
Equity Structure of China Biologic Products by the End of 2014
Distribution of Blood Product Production Bases and Plasma Stations of China Biologic Products, 2014
Revenue and Operating Income of China Biologic Products, 2007-2014
Gross Margin of China Biologic Products, 2011-2014
Revenue of China Biologic Products by Product, 2011-2014
Revenue Structure of China Biologic Products by Product, 2010-2014
Revenue of China Biologic Products from Top 5 Customers and % of Total Revenue, 2008-2014
R&D Costs and % of Total Revenue of China Biologic Products, 2010-2014
New Products of China Biologic Products under Research by the End of 2014
Lot Release Volume of Blood Products of Shandong Taibang, 2008-2014
Lot Release Volume of Blood Products of Guiyang Qianfeng, 2008-2014
Lot Release Volume of Blood Products of Xi’an Huitian Blood Products, 2008-2014
Revenue and Operating Income of China Biologic Products, 2014-2018E
Revenue and Operating Income of Hualan Biological, 2007-2014
Revenue of Hualan Biological by Sector, 2007-2014
Gross Margin of Hualan Biological by Product, 2007-2014
Revenue of Hualan Biological from Top 5 Customers and % of Total Revenue, 2007-2014
Procurement of Hualan Biological from Top Five Suppliers and % of Total Procurement, 2007-2014
Name List and Procurement of Hualan Biological's Top 5 Suppliers, 2014
R&D Costs and % of Total Revenue of Hualan Biological, 2007-2014
Varieties and Specifications of Blood Products of Hualan Biological
Plasma Collection Station Distribution of Hualan Biological by the End of 2014
Lot Release Volume of Blood Products of Hualan Biological, 2008-2014
Revenue and Gross Margin of Blood Products of Hualan Biological, 2007-2014
Revenue and Gross Margin of Hualan Biological by Product, 2007-2014
Revenue and Operating Income of Hualan Biological, 2014-2018E
Distribution of Plasma Collection Stations of Shanghai RAAS by the End of 2014
Revenue and Operating Income of Shanghai RAAS, 2008-2014
Lot Release Volume of Blood Products of Shanghai RAAS, 2008-2014
Lot Release Volume of TONROL's Blood Products, 2008-2014
Operating Revenue of Shanghai RAAS by Product, 2008-2014
Revenue of Shanghai RAAS by Region, 2008-2014
Gross Margin of Shanghai RAAS by Product, 2008-2014
Revenue of Shanghai RAAS from Top 5 Customers and % of Total Revenue, 2007-2014
Procurement of Shanghai RAAS from Top 5 Suppliers and % of Total Procurement, 2007-2014
R&D Costs and % of Total Revenue of Shanghai RAAS, 2007-2014
Revenue and Operating Income of Shanghai RAAS, 2014-2018E
Revenue and Profit of Tiantan Biological's Subsidiaries, 2014
Revenue and Operating Income of Tiantan Biological, 2007-2014
Revenue of Tiantan Biological by Sector, 2007-2014
Revenue of Tiantan Biological by Region, 2007-2014
Procurement of Tiantan Biological from Top 5 Suppliers and % of Total Procurement, 2008-2014
Revenue of Tiantan Biological from Top 5 Customers and % of Total Revenue, 2008-2014
Gross Margin of Tiantan Biological by Sector, 2008-2014
R&D Costs and % of Total Revenue of Tiantan Biological, 2009-2014
Distribution of Blood Plasma Collection Stations of Tiantan Biological by the End of 2014
Revenue and Gross Margin of Blood Products of Tiantan Biological, 2007-2014
Lot Release Volume of Blood Products of Chengdu Rongsheng and Tiantan Biological, 2008-2013
Revenue and Operating Income of Tiantan Biological, 2014-2018E
Revenue and Operating Income of Zhenxing Biopharmaceutical and Chemical, 2008-2014
Operating Revenue of Zhenxing Biopharmaceutical and Chemical by Product, 2009-2014
Gross Margin of Zhenxing Biopharmaceutical and Chemical by Product, 2009-2014
Revenue of Zhenxing Biopharmaceutical and Chemical from Top 5 Customers and % of Total Revenue, 2009-2014
Procurement of Zhenxing Biopharmaceutical and Chemical from Top 5 Suppliers and % of Total Procurement, 2013
R&D Costs and % of Total Revenue of Zhenxing Biopharmaceutical and Chemical, 2009-2014
Production-use Plasma Volume of Shuanglin Bio-Pharmacy, 2010-2014
Distribution of Plasma Collection Stations of Shuanglin Bio-Pharmacy by Jun 2014
Lot Release Volume of Blood Products of Shuanglin Bio-Pharmacy, 2008-2014
Revenue and Gross Margin of Blood Products Business of Zhenxing Biopharmaceutical and Chemical, 2009-2014
Revenue and Operating Income of Zhenxing Biopharmaceutical and Chemical, 2014-2018E
Plasma Collection Volume of Jiangxi Boya Bio-Pharmaceutical, 2008-2014
Revenue and Operating Income of Jiangxi Boya Bio-Pharmaceutical, 2008-2014
Revenue of Jiangxi Boya Bio-Pharmaceutical by Product, 2009-2014
Lot Release Volume of Main Blood Products of Jiangxi Boya Bio-Pharmaceutical, 2011-2014
Operating Revenue of Jiangxi Boya Bio-Pharmaceutical by Region, 2009-2014
Gross Margin of Jiangxi Boya Bio-Pharmaceutical by Product, 2009-2014
Revenue of Jiangxi Boya Bio-Pharmaceutical from Top 5 Customers and % of Total Revenue, 2009-2013
Name List and Revenue Contribution of Top 5 Customers of Jiangxi Boya Bio-Pharmaceutical, 2014
Procurement of Jiangxi Boya Bio-Pharmaceutical from Top 5 Suppliers and % of Total Procurement, 2009-2014
R&D Costs and % of Total Revenue of Jiangxi Boya Bio-Pharmaceutical, 2009-2014
Revenue and Operating Income of Jiangxi Boya Bio-Pharmaceutical, 2014-2018E
Distribution of Blood Plasma Collection Stations of Yuanda Shuyang by the End of 2014
Lot Release Volume of Blood Products of Yuanda Shuyang, 2008-2014
Lot Release Volume of Blood Products of CNBG Shanghai Institute of Biological Products, 2008-2014
Distribution of Blood Plasma Collection Stations of CNBG Shanghai Institute of Biological Products by the End of 2014
Distribution of Blood Plasma Collection Stations of Shanxi Kangbao Biological Product by the End of 2014
Lot Release Volume of Blood Products of Shanxi Kangbao Biological Product, 2008-2014
Distribution of Blood Plasma Collection Stations of Green Cross China by the End of 2014
Lot Release Volume of Blood Products of Green Cross China, 2008-2014
Revenue and Operating Income of Humanwell Healthcare (Group), 2009-2014
Lot Release Volume of Blood Products of Wuhan Zhongyuan Ruide Biological Product, 2008-2014
Production Industry Layout of Walvax Biotechnology
Revenue and Operating Income of Walvax Biotechnology, 2009-2014
Revenue of Walvax Biotechnology by Sector, 2009-2014
Distribution of Plasma Stations of Major Blood Products Manufacturers in China by Dec 2014
Production-use Plasma Volume of Major Blood Product Manufacturers in China, 2014
Blood Product Revenue of Major Blood Product Manufacturers in China, 2011-2014
Main M & A Cases in China Blood Product Industry, 2008-2014
Chinese Blood Product Market Size, 2013-2018E
Gross Margin of Major Blood Products Manufacturers in China, 2011-2014
如果这份报告不能满足您的要求,我们还可以为您定制报告,请 留言说明您的详细需求。
|