|
|
|
报告导航:研究报告—
TMT产业—电子半导体
|
|
2014-2015年全球及中国存储器(Memory)行业研究报告 |
 |
字数:1.3万 |
页数:95 |
图表数:148 |
|
中文电子版:8000元 |
中文纸版:4000元 |
中文(电子+纸)版:8500元 |
|
英文电子版:2100美元 |
英文纸版:2300美元 |
英文(电子+纸)版:2400美元 |
|
编号:ZYW207
|
发布日期:2015-05 |
附件:下载 |
 |
|
|
《2014-2015年全球及中国存储器(Memory)行业研究报告》包含以下内容:
1、存储器(Memory)技术发展趋势
2、存储器(Memory)市场分析
3、存储器(Memory)产业分析
4、19家典型存储器(Memory)产业链厂家研究
经历两年衰退之后,2013和2014年全球存储器市场出现了飞跃,连续两年市场规模增幅超过20%,2013年增幅为20.5%,2014年为22.1%,是所有半导体产品中增幅最高的。2015年增幅大大放缓,预计2015年存储器市场规模达838亿美元,增幅只有2.3%。
增幅下滑的原因几点,首先是DRAM的价格下滑。DRAM价格自2012年10月开始上涨,一直持续到2014年6月,价格上涨刺激供应增加,供需越来越平衡,2014年7月DRAM现货价开始全面下跌。
其次是需求下滑,智能手机增幅放缓,平板电脑出货量明显下滑,Desktop PC出货量下滑。随着全球经济复苏再次陷入不明朗,中国经济增速大幅度放缓,需求将在2016年出现更大幅度的下滑,预计智能手机也会出现明显下滑。而各大存储器厂家的新产能陆续投产,特别是NAND领域,价格下滑程度将超出预期。预计2016年存储器行业再次衰退,下滑3.1%。
存储器产业可以分为两大阵营,一大阵营为韩国阵营,另一大阵营为日美台阵营。台湾拥有良好的科研基础,与日本关系很好,长期接受日本的技术支持,台湾得以形成了最完整的存储器产业链。尤其是封测领域,韩国厂家有时也要求助于台湾厂家。日本拥有最先进的技术,但缺乏强大的资金支持,于是多联合美国企业,而美国和日本企业都乐意和台湾企业合作。日美台形成联盟,东芝与SanDisk结盟,Micron与台塑结盟。韩国厂家在NAND技术领域仍然逊色于日本厂家,三星每年还要给东芝大约3%的专利费。韩国厂家的强项在于资金实力雄厚,生产技术优秀。
中国大陆一直是全球最大的存储器市场,中国每年要从韩国进口数百亿美元的存储器,中国试图改变这种状况,但困难重重。目前中国大陆基础工业和基础科研实力相对落后,中国大陆在半导体领域落后台湾10年以上。因为实业的回报率远远低于金融投机,大陆企业热衷于资本运作,实业投入较少。在大企业纷纷退出的NorFlash领域,中国大陆企业或许会有些成就,但在DRAM和NAND领域,还很难取得大的突破。
目前大部分新技术类内存都是低容量内存,一旦容量提高就面临成本过高或可靠性变差的瓶颈。预计到2020甚至到2025年,传统的DRAM和NAND还是会占据统治地位,在低容量内存领域可能会有新技术取代Nor Flash或SRAM,目前商业化速度最快的是STT –MRAM。
2014年10月前,Everspin就已经有4000万 STT MRAM出货,2014年10月开始,Everspin与GLOBAL FOUNDRIES合作生产STT MRAM,采用40纳米技术。
Intel、IBM、三星、SK Hynix、高通等公司都在投入研发MRAM储存技术,不过日本公司在这个领域实力也很强大。除了东芝外,TDK也是重要的参与者,这次他们在日本Ceatec博览会上首次公开了MRAM晶圆,还有实际的性能演示。
Global and China Memory Industry Report, 2014-2015 covers the followings:
1. Memory technology trends
2. Memory market
3. Memory industry
4. 19 typical memory industry chain vendors
After two years of recession, the global memory market went forward by leaps and bounds in 2013-2014, with scale up more than 20% for two consecutive years i.e. 20.5% in 2013, 22.1% in 2014, the highest growth rate among all semiconductor products. In 2015, the growth rate slows evidently, only 2.3%, and the memory market size is expected to reach USD83.8 billion.
Causes for the decline in growth rate are the followings. The first comes to the falling prices of DRAM. DRAM price began to rise from October 2012, a trend lasting till June 2014, resulting in increased supply and a balance between supply and demand. However, spot prices of DRAM started falling in July 2014.
Second, the demand dropped. Smartphone growth slowed down, the shipment of tablet PC dived and that of desktop PC fell as well. As the world is just stuck in an ill-defined “economic recovery”, China’s economy has seen a slowdown in growth rate, with a sharper decline to occur in its demand in 2016, and so will smartphones then. With the commissioning of new capacities of major memory vendors, especially in the NAND field, the price will fall more than expected. The memory industry will probably suffer another recession in 2016, down 3.1%.
The memory industry can be divided into two camps: South Korean camp and Japanese/American/Taiwanese camp. Taiwan has good scientific research base, enjoying a sound relationship with Japan; technologically supported by the latter for a long time, Taiwan has the most complete industry chain of memory, especially in packing & testing, it sometimes helps South Korean peers. Japan boasts the most advanced technology but lacks strong financial support, mostly in association with US companies, and the two are willing to cooperate with Taiwanese companies. Japan, the United States and Taiwan formed an alliance – Toshiba with SanDisk, and Micron with Formosa Plastics. South Korean vendors still fade next to Japanese ones e.g. Samsung pays an about 3% patent fee to Toshiba each year, but they are competitive in financial strength and production technology.
Mainland China has been the world’s largest memory market, annually importing memory worth tens of billions of dollars from South Korea. China is trying to change this situation but beset with difficulties. The basic industry and basic scientific research strength are relatively backward in Chinese Mainland, even falling behind Taiwan by more than 10 years in field of semiconductor. Since the rate of return on industry is far lower than the monetary speculation, companies in the mainland are keen on capital operation instead of industrial investment. Chinese mainland enterprises may have some achievements in NorFlash sector from which large companies have retreated, but it is hard to make a big breakthrough in DRAM and NAND.
Currently, most of the new technical memories have low capacity, or else they may face bottlenecks of high costs and poor reliability when capacity is raised. It is projected that traditional DRAM and NAND will still occupy the dominant position from 2020 to 2025, NorFlash or SRAM may be replaced by new technologies in the low-capacity memory field. STT-MRAM now moves up fastest in commercialization.
Everspin had shipped 40 million STT MRAM before October 2014. Since then, it worked with GlobalFoundries in making STT MRAM (40 nm technology).
Intel, IBM, Samsung, SK Hynix and Qualcomm are developing MRAM storage technology while Japanese companies are pretty competitive in this area. In addition to Toshiba, TDK is also an important participant who showcased MRAM wafer with practical performance demonstration at CEATEC JAPAN for the first time.
第一章、内存技术发展趋势
1.1、TLC
1.2、3D NAND
1.3、新兴NVM内存EMERGING NVM
第二章、MEMORY市场
2.1、全球MEMORY市场
2.2、DRAM供求分析
2.3、NAND供需分析
2.4、全球手机市场与产业
2.5、中国手机市场
2.6、笔记本电脑市场
2.7、平板电脑市场
2.8、服务器
2.8.1、服务器市场
2.8.2、服务器产业
2.9、企业级SSD市场
第三章、内存产业
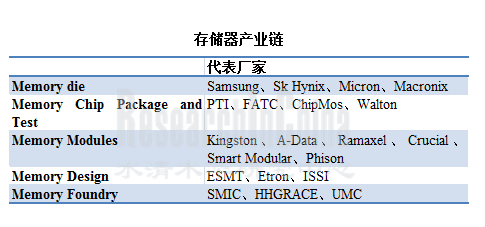
3.1、内存产业链
3.2、内存厂家市场占有率
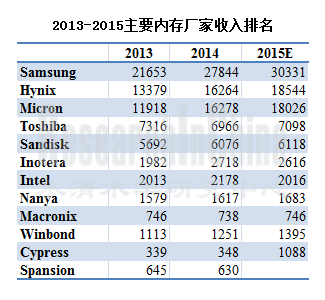
3.3、内存厂家排名
3.4、NORFLASH厂家市场占有率
3.5、中国大陆厂商进入主流内存领域困难重重
第四章、内存厂家研究
4.1、三星
4.2、SK HYNIX
4.3、MICRON
4.4、INOTERA
4.5、NANYA TECHNOLOGY
4.6、SANDISK
4.7、MACRONIX
4.8、ESMT
4.9、ETRON
4.10、ISSI
4.11、WINBOND ELECTRONIC
4.12、CYPRESS
4.13、兆易创新
4.14、东芝
第五章、内存产业链厂家研究
5.1、PTI
5.2、南茂CHIPMOS
5.3、福懋科技FATC
5.4、ADATA
5.5、慧荣SILICON MOTION TECHNOLOGY
1. Memory Technology Trends
1.1 TLC
1.2 3D NAND
1.3 Emerging NVM
2. Memory Market
2.1 Global Memory Market
2.2 DRAM Supply & Demand
2.3 NAND Supply & Demand
2.4 Global Mobile Phone Market and Industry
2.5 China Mobile Phone Market
2.6 Notebook Computer Market
2.7 Tablet PC Market
2.8 Server
2.8.1 Server Market
2.8.2 Server Industry
2.9 Enterprise SSD Market
3. Memory Industry
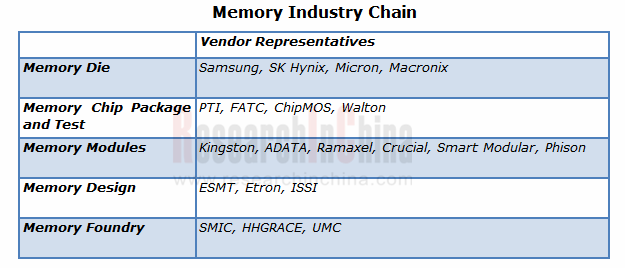
3.1 Memory Industry Chain
3.2 Memory Vendor Market Share
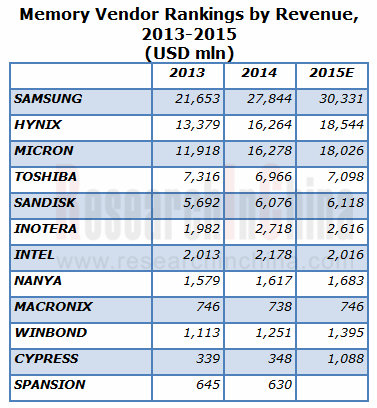
3.3 Memory Vendor Rankings
3.4 NorFlash Vendor Market Share
3.5 Chinese Mainland Vendors Beset with Difficulties into Mainstream Memory Areas
4. Memory Vendors
4.1 SAMSUNG
4.2 SK HYNIX
4.3 MICRON
4.4 INOTERA
4.5 NANYA TECHNOLOGY
4.6 SANDISK
4.7 MACRONIX
4.8 ESMT
4.9 ETRON
4.10 ISSI
4.11 WINBOND ELECTRONIC
4.12 CYPRESS
4.13 GIGADEVICE
4.14 TOSHIBA
5. Memory Industry Chain Vendors
5.1 PTI
5.2 CHIPMOS
5.3 FATC
5.4 ADATA
5.5 SILICON MOTION
Memory分类
各种Memory对比
2014-2020 Emerging NVM Time to market by Application
新旧内存对比
2009-2016年全球Memory市场规模
2014年Global Memory Market by type
2008-2015 Auotomotive Memory Market Size
2010-2015 Auotomotive Memory Market By Technology
2008-2015 DRAM Industry Capex
2013-2016 DRAM Oversupply Ratio
2013-2015 DRAM Demand by Devices
2013-2015 DRAM GB/SystemDRAM GB/System
2014年1季度-2016年4季度 DRAM Oversupply Ratio
2008-2015 NAND Industry Capex
2007-2015年全球手机出货量
2011-2014年全球3G/4G手机出货量地域分布
Worldwide Smartphone Sales to End Users by Vendor in 2014 (Thousands of Units)
Worldwide Smartphone Sales to End Users by Operating System in 2014 (Thousands of Units)
2014年全球前十大手机厂家出货量
2013年1月-2014年12月中国手机市场月度出货量
2014年中国智能手机市场主要厂家市场占有率
2014年中国4G手机市场主要厂家市场占有率
2008-2015年笔记本电脑出货量
2010-2014年全球主要笔记本电脑ODM厂家出货量
2011-2016年全球平板电脑出货量
Top Five Tablet Vendors, Shipments Fourth Quarter 2014
Top Five Tablet Vendors, Shipments, Market Share, and Growth, Calendar Year 2014
2013-2018年全球服务器市场规模
2013 Top 5 Corporate Family, Worldwide Server Systems Factory Revenue
Top 5 Corporate Family, Worldwide Server Systems Factory Revenue, Fourth Quarter of 2014
Worldwide: Server Vendor Shipments , 4Q14 (Units)
Worldwide: Server Vendor Revenue 4Q14 (U.S. Dollars)
EMEA Server Vendor Revenue 4Q14 (U.S. Dollars)
EMEA Server Shipment , 4Q14 (Units)
2015年全球服务器品牌市场占有率
2015年全球服务器生产厂家市场占有率
代工厂与服务器品牌厂供应关系
Memory Industry Chain
2014年1-4季度 Branded DRAM Vendor Market share
2014年1-4季度 Branded NAND Vendor Market share
2014年1-4季度 Mobile DRAM Vendor Market share
2013-2015主要内存厂家收入排名
内存设计公司收入与营业利润率
2013-2014主要内存厂家营业利润率
2012年主要NorFlash厂家市场占有率
2014年主要NorFlash厂家市场占有率
2010-2015年三星Memory事业部收入与营业利润率
2010-2015年三星Memory事业部收入breakdown by product
2014年三星Memory事业部收入breakdown by Application
2010-2015年三星DRAM/NAND 营业利润率
2012-2015年三星DRAM出货量
2012-2015年三星DRAM ASP
2013-2015 三星DRAM Fab Input(12inch Wafer)
2012-2015 三星NAND出货量
2012-2015 三星NAND ASP
2013-2015 三星NAND Fab Input(12inch Wafer)
2010-2015 三星SystemLSI收入与营业利润率
2008-2015 Sk Hynix Revenue vs Operation Margin
Q1/2013-Q4/2014 Sk Hynix 季度EBITDA、Net Margin
2008-2014 Sk Hynix Assets and Liabilities
2008-2014 Sk Hynix Revenue Mix by Product
Q1/2015 Sk Hynix Revenue Mix by Application
2013-2016 Sk Hynix DRAM Shipments vs ASP
2013-2016 Sk Hynix NAND Shipments vs ASP
FY2008-FY2015 Micron Revenue vs operation margin
FY2008-FY2015 Micron Revenue vs net income
FY2012-FY2015 Micron Revenue mix by segment
FY2012-FY2015 Micron 各部门毛利率
FY2012-FY2015 Micron Revenue mix by Location
Micron主要客户
Micron Roadmap
2008-2015 Inotera收入与毛利率
2015年1季度Inotera Balance Sheet & Key Indices
2015年1季度Inotera Cash Flow
2013年3月-2015年3月Inotera月度收入
Framework of Nanya, Micron & Inotera
2008-2015 Nanya 收入与毛利率
2012年2季度-2015年1季度Nanya 季度收入与毛利率
2013年1季度-2015年1季度Nanya Mix By Application
2012-2015 Nanya Mix By Application
2011-2015 Nanya Capex
2011-2015 Nanya Shipments
2009-2015 SanDisk Revenue vs Gross Margin
2009-2015 Sandisk Revenue Mix by Application
2011-2013 SanDisk Revenue by Location
Macronix Organization
2008-2015 Macronix收入与毛利率
2013-2015 Macronix收入 by segment
2011年1季度-2015年1季度Macronix ROM出货量
2013-2015 Macronix ROM Revenue mix by tech
2011年1季度-2015年1季度Macronix NOR出货量
2013-2015 Macronix NOR Revenue mix by tech
2015Q1 Macronix NOR Revenue breakdown
2013-2015 Macronix SLC NAND Shipment
2009-2015年 ESMT收入与毛利率
2013年3月-2015年3月ESMT月度收入
2009-2015 Etron 收入与毛利率
2013年3月-2015年3月Etron月度收入
2008-2015 ISSI收入与毛利率
2014 ISSI 收入by segment
ISSI主要客户
FY2009\FY2014 ISSI 收入by product
FY2009\FY2014 ISSI Automotive Market Reveune
Winbond Organization
2009-2015 Winbond收入与毛利率
2013年2季度2015年1季度Winbond季度收入与毛利率
2014-2015年Winbond收入By Application
2013-2015 Winbond Revenue by geometry
2010-2015 Winbond Capex
2011-2015 Winbond Revenue by Segment
2007-2014年Cypress收入与运营利润率
2009-2014年 Cypress收入业务分布
2009-2014年Cypress收入地域分布
2009-2013 Spansion 收入与毛利率
2011-2013 Spansion收入地域分布
新Cypress收入by application
2011-2013 GigaDevice资产负债表
2011-2013 GigaDevice 收入与营业利润
2011-2013 GigaDevice现金流
2011-2013 GigaDevice财务指标
2013年 GigaDevice客户分布
2013年 GigaDevice供应商分布
FY2011-2015 Toshiba Electronic Devices & Components Segment Revenue by product
PTI组织结构
2008-2015 PTI收入与毛利率
2013年3月-2015年3月PTI月度收入
2014年1季度-2015年1季度PTI收入mix by application
2003-2014年南茂科技收入与毛利率
2009-2014年南茂收入与营业利润率
2010-2014年南茂科技收入业务分布
2010-2014年南茂科技收入产品分布
2010-2014年南茂科技Utilization Rate 和EBITDA Margin
2009-2014年南茂科技Cash Flow 和CAPEX
2014-2016 ChipMOS Technology Roadmap
ChipMOS Technology Development & Business Alignment
台塑集团组织结构
福懋科技组织结构
2006-2015年福懋科技收入与运营利润率
2009-2015年福懋科技收入与毛利率
2013年3月-2015年3月福懋科技月度收入
2008-2015 A-DATA收入与毛利率
2013年3月-2015年3月A-DATA月度收入
2011-2015 A-DATA 收入by segment
A-DATA全球分布
2010-2015年SIMO收入与毛利率
Classification of Memory
Comparison between Various Types of Memory
Emerging NVM Time to Market by Application, 2014-2020
Comparison of Emerging Memory and Established Memory
Global Memory Market Size, 2009-2016E
Global Memory Market by Type, 2014
Automotive Memory Market Size, 2008-2015
Automotive Memory Market by Technology, 2010-2015
DRAM Industry CAPEX, 2008-2015
DRAM Oversupply Ratio, 2013-2016
DRAM Demand by Devices, 2013-2015
DRAM GB/SystemDRAM GB/System, 2013-2015
DRAM Oversupply Ratio, Q1/2014-Q4/2016
NAND Industry CAPEX, 2008-2015
Global Mobile Phone Shipments, 2007-2015
Global 3G/4G Mobile Phone Shipments by Region, 2011-2014
Worldwide Smartphone Sales to End Users by Vendor in 2014 (Thousands of Units)
Worldwide Smartphone Sales to End Users by Operating System in 2014 (Thousands of Units)
Shipments of Top 10 Mobile Phone Vendors Worldwide, 2014
Monthly Shipments of China Mobile Phone Market, Jan 2013-Dec 2014
Market Share of Major Smartphone Vendors in China, 2014
Market Share of Major 4G Mobile Phone Vendors in China, 2014
Notebook Computer Shipments, 2008-2015
Shipments of Major Notebook ODM Vendors Worldwide, 2010-2014
Global Tablet PC Shipments, 2011-2016E
Shipments of Top 5 Tablet PC Vendors, Q4/2014
Shipments, Market Share and Growth of Top 5 Tablet PC Vendors, 2014
Global Server Market Size, 2013-2018E
Top 5 Corporate Family, Worldwide Server Systems Factory Revenue, 2013
Top 5 Corporate Family, Worldwide Server Systems Factory Revenue, Q4/2014
Worldwide: Server Vendor Shipments, Q4/2014 (Units)
Worldwide: Server Vendor Revenue, Q4/2014 (U.S. Dollars)
EMEA Server Vendor Revenue, Q4/2014 (U.S. Dollars)
EMEA Server Shipment, Q4/2014 (Units)
Market Share of Server Brand Vendors Worldwide, 2015
Market Share of Server OEMs Worldwide, 2015
Supply Relationship between OEMs and Server Brand Vendors
Memory Industry Chain
Market Share of Branded DRAM Vendors, Q1-Q4/2014
Market Share of Branded NAND Vendors, Q1-Q4/2014
Market Share of Mobile DRAM Vendors, Q1-Q4/2014
Memory Vendor Rankings by Revenue, 2013-2015
Revenue and Operating Margin of Memory Design Companies
Operating Margin of Major Memory Vendors, 2013-2014
Market Share of Major NorFlash Vendors, 2012
Market Share of Major NorFlash Vendors, 2014
Revenue and Operating Margin of Samsung Memory Division, 2010-2015
Revenue Breakdown of Samsung Memory Division by Product, 2010-2015
Revenue Breakdown of Samsung Memory Division by Application, 2014
Samsung DRAM/NAND Operating Margin, 2010-2015
Samsung DRAM Shipments, 2012-2015
Samsung DRAM ASP, 2012-2015
Samsung DRAM Fab Input (12inch Wafer), 2013-2015
Samsung NAND Shipments, 2012-2015
Samsung NAND ASP, 2012-2015
Samsung NAND Fab Input (12inch Wafer), 2013-2015
Samsung System LSI Revenue vs Operating Margin, 2010-2015
SK Hynix Revenue vs Operating Margin, 2008-2015
SK Hynix EBITDA vs Net Margin, Q1/2013-Q4/2014
SK Hynix Assets vs Liabilities, 2008-2014
SK Hynix Revenue Mix by Product, 2008-2014
SK Hynix Revenue Mix by Application, Q1/2015
SK Hynix DRAM Shipments vs ASP, 2013-2016
SK Hynix NAND Shipments vs ASP, 2013-2016
Micron Revenue vs Operating Margin, FY2008-FY2015
Micron Revenue vs Net Income, FY2008-FY2015
Micron Revenue Mix by Segment, FY2012-FY2015
Micro Gross Margin by Segment, FY2012-FY2015
Micron Revenue Mix by Location, FY2012-FY2015
Micro Customers
Micron Roadmap
Inotera Revenue vs Gross Margin, 2008-2015
Inotera Balance Sheet & Key Indices, Q1/2015
Inotera Cash Flow, Q1/2015
Inotera Monthly Revenue, Mar 2013-Mar 2015
Framework of Nanya, Micron & Inotera
Nanya Revenue vs Gross Margin, 2008-2015
Nanya Quarterly Revenue vs Gross Margin, Q2/2012-Q1/2015
Nanya Mix by Application, Q1/2013-Q1/2015
Nanya Mix by Application, 2012-2015
Nanya CAPEX, 2011-2015
Nanya Shipments, 2011-2015
SanDisk Revenue vs Gross Margin, 2009-2015
Sandisk Revenue Mix by Application, 2009-2015
SanDisk Revenue by Location, 2011-2013
Macronix Organization
Macronix Revenue vs Gross Margin, 2008-2015
Macronix Revenue by Segment, 2013-2015
Macronix ROM Shipments, Q1/2011-Q1/2015
Macronix ROM Revenue Mix by Tech, 2013-2015
Macronix NOR Shipments, Q1/2011-Q1/2015
Macronix NOR Revenue Mix by Tech, 2013-2015
Macronix NOR Revenue Breakdown, Q1/2015
Macronix SLC NAND Shipments, 2013-2015
ESMT Revenue vs Gross Margin, 2009-2015
ESMT Monthly Revenue, Mar 2013-Mar 2015
Etron Revenue vs Gross Margin, 2009-2015
Etron Monthly Revenue, Mar 2013-Mar 2015
ISSI Revenue vs Gross Margin, 2008-2015
ISSI Revenue by Segment, 2014
ISSI Customers
ISSI Revenue by Product, FY2009\FY2014
ISSI Automotive Market Revenue, FY2009\FY2014
Winbond Organization
Winbond Revenue vs Gross Margin, 2009-2015
Winbond Quarterly Revenue vs Gross Margin, Q2/2013-Q1/2015
Winbond Revenue by Application, 2014-2015
Winbond Revenue by Geometry, 2013-2015
Winbond CAPEX, 2010-2015
Winbond Revenue by Segment, 2011-2015
Cypress Revenue vs Operating Margin, 2007-2014
Cypress Revenue by Business, 2009-2014
Cypress Revenue by Region, 2009-2014
Spansion Revenue vs Gross Margin, 2009-2013
Spansion Revenue by Region, 2011-2013
New Cypress Revenue by Application
GigaDevice Balance Sheet, 2011-2013
GigaDevice Revenue vs Operating Income, 2011-2013
GigaDevice Cash Flow, 2011-2013
GigaDevice Financial Indicators, 2011-2013
GigaDevice Customer Distribution, 2013
GigaDevice Supplier Distribution, 2013
Toshiba Revenue by Segment, FY2011-FY2015
Toshiba Electronic Devices & Components Segment Revenue by Product, FY2011-FY2015
PTI Organization
PTI Revenue vs Gross Margin, 2008-2015
PTI Monthly Revenue, Mar 2013-Mar 2015
PTI Revenue Mix by Application, Q1/2014-Q1/2015
ChipMOS Revenue vs Gross Margin, 2003-2014
ChipMOS Revenue vs Operating Margin, 2009-2014
ChipMOS Revenue by Business, 2010-2014
ChipMOS Revenue by Product, 2010-2014
ChipMOS Utilization Rate vs EBITDA Margin, 2010-2014
ChipMOS Cash Flow and CAPEX, 2009-2014
ChipMOS Roadmap, 2014-2016
ChipMOS Technology Development & Business Alignment
Formosa Plastics Organization
FATC Organization
FATC Revenue vs Operating Margin, 2006-2015
FATC Revenue vs Gross Margin, 2009-2015
FATC Monthly Revenue, Mar 2013-Mar 2015
ADATA Revenue vs Gross Margin, 2008-2015
ADATA Monthly Revenue, Mar 2013-Mar 2015
ADATA Revenue by Segment, 2011-2015
ADATA Worldwide
SIMO Revenue vs Gross Margin, 2010-2015
如果这份报告不能满足您的要求,我们还可以为您定制报告,请 留言说明您的详细需求。
|