|
|
|
报告导航:研究报告—
TMT产业—电子半导体
|
|
2014-2015年全球及中国射频系统 (Connectivity RF) 行业研究报告 |
 |
字数:1.1万 |
页数:92 |
图表数:106 |
|
中文电子版:8000元 |
中文纸版:4000元 |
中文(电子+纸)版:8500元 |
|
英文电子版:2150美元 |
英文纸版:2300美元 |
英文(电子+纸)版:2450美元 |
|
编号:ZYW208
|
发布日期:2015-06 |
附件:下载 |
 |
|
|
《2014-2015年全球及中国射频系统(Connectivity RF) 行业研究报告》包含以下内容:
1、Connectivity RF简介
2、Connectivity RF 市场分析
3、 Connectivity RF产业分析
4、20家Connectivity RF产业链厂家研究
Connectivity RF系统指电子器件连接网络的射频系统,目前市场集中在手机、平板电脑、笔记本电脑、WLAN/PAN领域,未来将大幅度扩展到IoT(物联网)领域。
2014年Connectivity RF系统市场规模大约75.16亿美元,比2013年大幅度增长23.4%。预计2015年市场规模达100.80亿美元,比2014年增长34.1%。预计到2016年仍然能够保持17.3%的增幅,是所有电子零部件系统增长速度最快的领域。
Connectivity RF系统市场飞速增长主要是4G手机的拉动,一台标准2G手机的Connectivity RF系统只有大约0.55美元的成本,3G手机达2.75美元,而4G手机达8美元,全球标准的4G手机达13美元以上。而4G手机普及速度最快的就是中国,2013年12月中国4G手机出货量仅占总出货量的2%,而到2014年12月则大增到71%,到2015年3月已超过80%。
2015年全球范围的4G换机潮也将加速,Connectivity RF系统市场飞速增长。
另一个驱动力是802.11ac的高速增长,2014年支持802.11ac的WiFi占比不到10%,预计2018年可达80%。而802.11ac的射频系统成本比目前主流的802.11a/b/g要高得多。LTE的下一个发展方向是Carrier aggregation (CA),2014年支持Carrier aggregation的手机出货量只有1.08亿部,预计到2018年可达11.85亿部,Carrier aggregation使射频系统更加复杂,成本更高。
Connectivity RF系统核心包括PA和滤波器。滤波器是增长最快的部分,LTE-FDD的Band 8、13、26需要使用TC-SAW。LTE-FDD的Band 4、5、12、17、20、27、28需要使用SAW。LTE-FDD的Band 2、3、7、23、25、30需要使用BAW,LTE-TDD的Band 38、10、41、42、43需要使用SAW。
Connectivity RF系统产业高度集中,前五大厂市场占有率超过97%,基本没有小厂的生存空间。一来是因为PA需用使用独特的GaAs Wafer,而非传统的Si Wafer,二来滤波器领域生产门槛很高,实验室试产都能做到,但只有极少数厂家能够做到大规模量产且保持高一致性和高质量,这当中以日本厂家为主。SAW主要厂家是Murata、TDK、Fujitsu。TC-SAW主要是松下、Qorvo。BAW主要是Avago、Qorvo、Taiyoyuden和TDK。
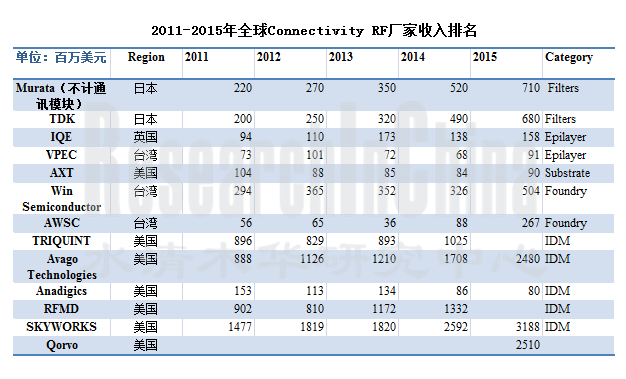
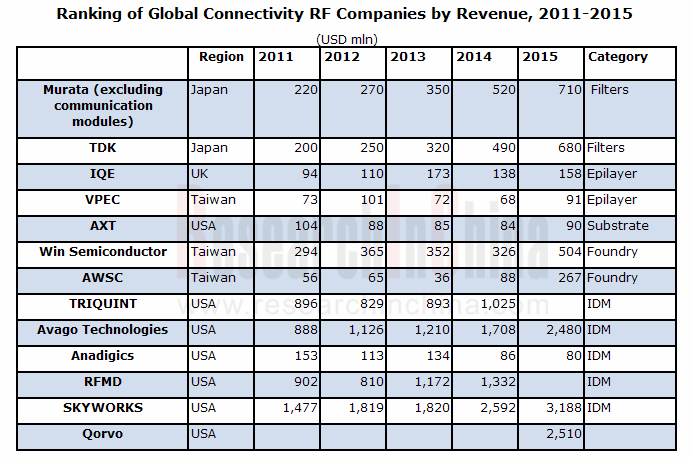
Qorvo是RFMD和Triquint合并后的新公司。2015年增长最快的是台湾厂家,Win和AWSC,这两家分别是Skyworks和Avago的代工厂。2015年Skyworks和Avago将产品大量外包,尤其Avago,由于其将大量资金用于收购,因此大幅度减少制造领域支出。因此AWSC在2015年收入增加至少200%。
The report covers the followings:
1, Introduction to Connectivity RF
2, Analysis on Connectivity RF Market
3, Analysis on Connectivity RF Industry
4. Research on 20 Connectivity RF Companies
A Connectivity RF system is a radio frequency system consisting of electronic devices connected to the network, mainly applied to mobile phones, tablet PCs, laptopsand WLAN / PAN now, and will find wide application in IoT (Internet of Things).
The Connectivity RF system market size reached approximately USD7.516 billion in 2014, showing a substantial rise of 23.4% over 2013. In 2015, the market size is expected to go up by 34.1% year on year to USD10.08 billion. It will maintain the growth rate of 17.3% by 2016, becoming the fastest growing field among all electronic components.
The rapid growth of the Connectivity RF system market is primarily prompted by 4G mobile phones. A standard 2G mobile phone requires a Connectivity RF system costing only about USD0.55, a 3G phone USD2.75, while a 4G phone up to USD8 and a global standard 4G phone USD13 or above. The penetration rate of 4G phones in China is the highest in the world. China’s 4G mobile phone shipment only accounted for 2% of the total mobile phone shipment in December 2013, but the proportion jumped to 71% in December 2014 and more than 80% in March 2015.
In 2015, a wave of 4G phone replacement will speed up worldwide, which will stimulate the Connectivity RF system market.
The rapid growth of 802.11ac is another driving engine. Less than 10% of WiFi supported 802.11ac in 2014, while the proportion is expected to be 80% in 2018. The Connectivity RF cost of 802.11ac is much higher than that of the current mainstream 802.11a/b/g. The next development direction of LTE will be carrier aggregation (CA). The shipment of mobile phones supporting carrier aggregation only amounted to 108 million units in 2014, and is expected to reach 1.185 billion units by 2018. Carrier aggregation makes Connectivity RF more complex and costly.
The core of a Connectivity RF system includes PA and filters (the fastest growing segment). LTE-FDD's Band 8, 13 and 26 need TC-SAW, Band 4, 5, 12, 17, 20, 27 and 28 require SAW, Band 2, 3, 7, 23, 25 and 30 demand BAW, while LTE-TDD’s Band 38, 10, 41, 42 and 43 use SAW.
In the highly concentrated Connectivity RF system industry, the top five companies enjoy over 97% market share, which is hard for small firmsto survive. One reason is that PA requires unique GaAs wafers instead of the traditional Si wafers; the other reason rests with the high production threshold in the filter field. All laboratories can accomplish trial production, but only a handful of companies (mainly Japanese companies) are capable to conduct mass production with high consistency and quality. Major SAW companies embrace Murata, TDK and Fujitsu. Panasonic and Qorvo target TC-SAW. Avago, Qorvo, Taiyoyuden and TDK focus on BAW.
Qorvo is a new company after the merger of RFMD and Triquint. Taiwanese companies witness the fastest growth in 2015. For example, Skyworks and Avago outsource considerable products to their foundries Win and AWSC respectively, especially Avago lavish huge capital on acquisitions to significantly reduce manufacturing costs, so that AWSC’s revenue will ascend by at least 200% in 2015.
第一章、CONNECTIVITY RF简介
1.1、CONNECTIVITY RF简介
1.2、GAAS简介
1.3、GAAS、GAN、SIGE对比
第二章、CONNECTIVITY RF产业
2.1、CONNECTIVITY RF市场规模
2.2、CONNECTIVITY RF产业链
2.3、ANALYSIS OF RF SYSTEM OF LATEST HANDSETS
2.4、手机滤波器(FILTER)产业
2.5、手机天线开关
2.6、 CONNECTIVITY RF厂家排名
第三章、 CONNECTIVITY RF下游市场
3.1、LTE手机市场
3.2、全球手机产业
3.3、中国手机市场
3.4、笔记本电脑市场
3.5、平板电脑市场
3.6、 BOARD CONNECTIVITY RF市场
第四章、CONNECTIVITY RF厂家研究
4.1、MURATA
4.2、KOPIN
4.3、住友电气半导体分部SEMICONDUCTOR DIVISION OF SUMITOMO ELECTRIC
4.4、FREIBERGER
4.5、AXT
4.6、IQE
4.7、稳懋WIN SEMICONDUCTOR
4.8、宏捷科技AWSC
4.9、全新光电VPEC
4.10、GCS
4.11、TRIQUINT
4.12、AVAGO
4.13、ANADIGICS
4.14、RFMD
4.15、锐迪科RDA
4.16、SKYWORKS
4.17、SEDI
4.18、HITTITE MICROWAVE
4.19、M/A-COM TECHNOLOGY
4.20、TDK
1 Overview of Connectivity RF
1.1 Brief Introduction to Connectivity RF
1.2Brief Introduction to GaAs
1.3Comparison between GaAs,Ganand Sige
2Connectivity RF Industry
2.1 Connectivity RF Market Size
2.2Connectivity RF Industry Chain
2.3Analysis of RF System of Latest Handsets
2.4 Mobile Phone Filter Industry
2.5 Mobile Phone Antenna Switch
2.6 Ranking of Connectivity RF Companies
3 Connectivity RF Downstream Markets
3.1 LTE Mobile Phone Market
3.2 Global Mobile Phone Industry
3.3 Chinese Mobile Phone Market
3.4 Laptop Market
3.5 Tablet PC Market
3.6 Board Connectivity RF Market
4 Connectivity RF Companies
4.1 Murata
4.2 Kopin
4.3 Semiconductor Division of Sumitomo Electric
4.4 Freiberger
4.5 AXT
4.6 IQE
4.7 WIN Semiconductor
4.8 AWSC
4.9 VPEC
4.10 GCS
4.11 TRIQUINT
4.12 AVAGO
4.13 ANADIGICS
4.14 RFMD
4.15 RDA
4.16 SKYWORKS
4.17 SEDI
4.18 Hittite Microwave
4.19 M/A-COM TECHNOLOGY
4.20 TDK
典型RF结构
2011-2017年Connectivity RF市场规模
2011-2017年Filters市场规模
2011-2017年Connectivity RF市场下游分布
Connectivity RF产业链产业链主要厂家
手机中RF System所占成本
Apple iPhone 5S LTE/WCDMA/CDMA/GSM Block Diagram
Samsung SM-G900S LTE/WCDMA/GSM Block Diagram
手机RF Filters 应用Band
手机RF Filters应用数量
BAW与SAW对比
2013-2017年手机用Duplexers/FABR Filters出货量
2015年SAW Filter主要厂家市场占有率
2010-2016年手机天线开关出货量技术分布
2012年全球手机天线开关主要厂家市场占有率
2011-2015年全球Connectivity RF厂家收入排名
2000-2018年Frequency bands per mobile handset device
2000-2018 Cellular terminal shipment forecast by cellular standard
2011-2018 LTE-enabled cellular terminal forecast
Worldwide Smartphone Sales to End Users by Vendor in 2014 (Thousands of Units)
Worldwide Smartphone Sales to End Users by Operating System in 2014 (Thousands of Units)
2014年全球前十大手机厂家出货量
2013年1月-2014年12月中国手机市场月度出货量
2014年中国智能手机市场主要厂家市场占有率
2014年中国4G手机市场主要厂家市场占有率
2008-2015年笔记本电脑出货量
2010-2014年全球主要笔记本电脑ODM厂家出货量
2011-2016年全球平板电脑出货量
Top Five Tablet Vendors, Shipments Fourth Quarter 2014
Top Five Tablet Vendors, Shipments, Market Share, and Growth, Calendar Year 2014
2012-2016 Total Wi-Fi Enabled Products 出货量
FY2009-FY2016 Murata Sales and Operation Margin
FY2013-FY2016 Murata sales by product
Murata Major Product
FY2013-FY2016 Murata sales by Application
FY2014-FY2015 Operation Income Bridge
2012年2季度-2015年1季度Murata Quarterly Sales,Order and Backlog
Kopin全球分布
2006-2011年KOPIN收入与运营利润率
2008-2011年KOPIN收入业务分布
2008-2011年KOPIN收入客户分布
2006-2015年AXT收入与运营利润率
2006-2013年AXT收入产品分布
2006-2014年AXT收入地域分布
2005-2013年IQE收入与运营利润率
2008-2014年IQE收入业务分布
2008-2014年IQE收入地域分布
稳懋组织结构
稳懋各部门职掌
2006-2015年稳懋收入与运营利润率
2013年2季度-2015年1季度稳懋季度收入
2013年2季度-2015年1季度稳懋季度毛利率,营业利润率与净利率
2013年4月-2015年4月稳懋月度收入
2014、2015年1季度稳懋收入产品分布
2005-2013年稳懋Manufacturing Capacity
稳懋核心竞争力
宏捷科技组织结构
2006-2015年宏捷科技收入与毛利率
2009-2016年宏捷科技收入与营业利润率
2013年4月-2015年4月宏捷科技月度收入
2007-2015年VPEC收入与运营利润率
2013年3月-2015年3月VPEC月度收入
2012年1季度-2013年4季度VPEC收入产品分布
2001-2013年TRIQUNIT收入与毛利率
2005-2012年TRIQUINT收入业务分布
2005-2012年TRIQUINT手机业务收入制式分布
2009年1季度-2011年4季度TRIQUINT德州厂GaAs产能
2009年1季度-2011年4季度TRIQUINT德州厂BAW产能
2009年1季度-2011年4季度TRIQUINT佛罗里达厂FLSAW产能
2009年1季度-2011年4季度TRIQUINT哥斯达黎加厂FLIP CHIP产能
智能手机RF架构趋势
FY2007-FY2015 AVAGO Revenue and Operation Margin
FY2010-FY2014 AVAGO 资产负债表
FY2007-FY2013 AVAGO Revenue by segment
Avago核心技术
FY2011-FY2014 Avago收入地域分布
2006-2015年ANADIGICS收入与毛利率
2011-2015年ANADIGICS收入与净利润
2007-2012年ANADIGICS收入客户分布
2005-2012年ANADIGICS收入业务分布
2008-2014年ANADIGICS收入地域分布
2002-2013财年RFMD收入与运营利润率
2009-2013财年RFMD收入部门分布
2010-2014财年RFMD收入地域分布
2007-2014年RDA收入与运营利润率
RDA Baseband Product Roadmap
RDA Product Roadmap
RDA Main Customer
RDA收入产品分布
FY2008-FY2015 Skyworks 收入,毛利率与营业利润率
FY2007-FY2014 Skyworks 各项支出
2013年2季度-2015年1季度Skyworks Quarterly 收入与营业利润率
FY2009-FY2014 SKYWORKS收入地域分布
FY2007-FY2014 SKYWORKS收入客户分布
FY2011\FY2014 Skyworks收入产品分布
2007-2013年Hittite Microwave收入与运营利润
2007-2015财年M/A-COM收入与运营利润
2010-2014财年M/A-COM收入应用分布
2006-2015财年TDK Net Sales
2006-2015财年TDK Operation Income
2006-2015财年TDK R&D 支出
2006-2015财年TDK Capex
2012-2015财年TDK Sales by application
2012-2015财年TDK Passive Components Sales by application
1Q/FY14-4Q/FY14 TDK Passive Components Quarterly Sales by application
1Q/FY14-4Q/FY14 TDK Passive Components Quarterly Sales by application
2014-2015财年TDK分部门销售收入
Typical RF Structure
Connectivity RF Market Size, 2011-2017E
Filter Market Size, 2011-2017E
Downstream Distribution of Connectivity RF Market, 2011-2017E
Major Companies in Connectivity RF Industry Chain
Costs of Mobile Phone RF System
LTE/WCDMA/CDMA/GSM Block Diagram of Apple iPhone 5S
LTE/WCDMA/GSM Block Diagram of Samsung SM-G900S
Bands Used for Mobile Phone RF Filters
Application Number of Mobile Phone RF Filters
Comparison between BAW and SAW
Shipment of Mobile Phone-use Duplexers / FABR Filters, 2013-2017E
Market Share of Major SAW Filter Companies, 2015
Mobile Phone Antenna Switch Shipment by Technology, 2010-2016E
Market Share of Major Global Mobile Phone Antenna Switch Companies, 2012
Ranking of Global Connectivity RF Companies by Revenue, 2011-2015
Frequency Bands per Mobile Handset Device, 2000-2018E
Cellular Terminal Shipment by Celluar Standard, 2000-2018E
LTE-enabled Cellular Terminal Shipment, 2011-2018E
Worldwide Smartphone Sales to End Users by Vendor, 2014
Worldwide Smartphone Sales to End Users by Operating System, 2014
Shipment of Top Ten Global Mobile Phone Companies, 2014
Monthly Shipment of Chinese Mobile Phone Market, 2013-2014
Market Share of Major Companies in Chinese Smart Phone Market, 2014
Market Share of Major Companies in Chinese 4G Mobile Phone Market, 2014
Laptop Computer Shipment, 2008-2015
Shipment of Major Global Laptop ODM Companies, 2010-2014
Global Tablet PC Shipment, 2011-2016E
Shipment of Top Five Tablet Vendors, Q4 2014
Shipment, Market Share and Growth of Top Five Tablet Vendors, 2014
Total Shipment of Wi-Fi Enabled Products, 2012-2016E
Murata’s Sales and Operation Margin, FY2009-FY2016
Murata’s Sales by Product, FY2013-2016
Murata’s Major Products
Murata's Sales by Application, FY2013-2016
Operating Income of Bridge of Murata, FY2014-2015
Murata's Quarterly Sales, Order and Backlog, Q2 2012-Q1 2015
Global Distribution of KOPIN
Revenue and Operating Margin of KOPIN, 2006-2011
Revenue of KOPIN by Business, 2008-2011
Revenue of KOPIN by Client, 2008-2011
Revenue and Operating Margin of AXT, 2006-2015
Revenue of AXT by Product, 2006-2013
Revenue of AXT by Region, 2006-2014
Revenue and Operating Margin of IQE, 2005-2013
Revenue of IQE by Business, 2008-2014
Revenue of IQE by Region, 2008-2014
Organizational Structure of WIN Semiconductor
Divisions of WIN Semiconductor
Revenue and Operating Margin of WIN Semiconductor, 2006-2015
Quarterly Revenue of WIN Semiconductor, Q2 2013-Q1 2015
Quarterly Gross Margin, Operating Margin and Net Profit Margin of WIN Semiconductor, Q2 2013-Q1 2015
Monthly Revenue of WIN Semiconductor, Apr 2013-Apr 2015
Revenue of WIN Semiconductor by Product, 2014-Q1 2015
Manufacturing Capacity of WIN Semiconductor, 2005-2013
Core Competitiveness of WIN Semiconductor
Organizational Structure of AWSC
Revenue and Gross Margin of AWSC, 2006-2015
Revenue and Operating Margin of AWSC, 2009-2016
Monthly Revenue of AWSC, Apr 2013-Apr 2015
Revenue and Operating Margin of VPEC, 2007-2015
Monthly Revenue of VPEC, Mar 2013- Mar 2015
Revenue of VPEC by Product, Q1 2012-Q4 2013
Revenue and Gross Margin of TRIQUNIT, 2001-2014
Revenue of TRIQUINT by Business, 2005-2014
TRIQUINT’s Mobile Phone Revenue by System, 2005-2012
GaAs Capacity of TRIQUINT’s Texas Plant, Q1 2009-Q4 2011
BAW Capacity of TRIQUINT’s Texas Plant, Q1 2009-Q4 2011
FLSAW Capacity of TRIQUINT’s Florida Plant, Q1 2009-Q4 2011
FLIP CHIP Capacity of TRIQUINT’s Costa Rica Plant, Q1 2009-Q4 2011
RF Framework Trend of Smart Phones
Revenue and Operation Margin of Avago, FY2007-FY2015
Balance Sheet of Avago, FY2010-FY2014
Revenue of Avago by segment, FY2007-FY2013
Core Technologies of Avago
Revenue of Avago by Region, FY2011-FY2014
Revenue and Gross Margin of ANADIGICS, 2006-2015
Revenue and Net Income of ANADIGICS, 2011-2015
Revenue of ANADIGICS by Client, 2007-2012
Revenue of ANADIGICS by Business, 2005-2012
Revenue of ANADIGICS by Region, 2008-2014
Revenue and Operating Margin of RFMD, FY2002-FY2013
Revenue of RFMD by Division, FY2009-FY2013
Revenue of RFMD by Region, FY2010-FY2014
Revenue and Operating Margin of RDA, 2007-2014
Baseband Product Roadmap of RDA
Product Roadmap of RDA
Main Customers of RDA
Revenue of RDA by Product
Revenue, Gross Margin and Operating Margin of Skyworks, FY2008-FY2015
Expenditures of Skyworks, FY2007-FY2014
Quarterly Revenue and Operating Margin of Skyworks, Q2 2013-Q1 2015
Revenue of Skyworks by Region, FY2009-FY2014
Revenue of Skyworks by Client, FY2007-FY2014
Revenue of Skyworks by Product, FY2011-FY2014
Revenue and Operating Income of Hittite Microwave, 2007-2013
Revenue and Operating Income of M / A-COM, FY2007-FY2015
Revenue of M / A-COM by Application, FY2010-FY2014
TDK’s Net Sales, FY2006-FY2015
TDK’s Operating Income, FY2006-FY2015
TDK’s R&D Costs, FY2006-FY2015
TDK’s Capex, FY2006-FY2015
TDK’s Sales by Application, FY2012-FY2015
TDK’s Passive Components Sales by Application, FY2012-FY2015
TDK’s Quarterly Sales by Application, FY2014-FY2015
Quarterly Sales of TDK’s Passive Components by Application, FY2014-FY2015
TDK’s Sales by Segment, FY2014-FY2015
如果这份报告不能满足您的要求,我们还可以为您定制报告,请 留言说明您的详细需求。
|