|
|
|
报告导航:研究报告—
TMT产业—电子半导体
|
|
2014-2015年全球及中国半导体设备行业研究报告 |
 |
字数:1.2万 |
页数:125 |
图表数:180 |
|
中文电子版:9000元 |
中文纸版:4500元 |
中文(电子+纸)版:9500元 |
|
英文电子版:2300美元 |
英文纸版:2500美元 |
英文(电子+纸)版:2600美元 |
|
编号:ZYW209
|
发布日期:2015-06 |
附件:下载 |
 |
|
|
《2014-2015年全球及中国半导体设备行业研究报告》包含以下内容:
1、全球半导体市场与产业分析
2、中国半导体市场与产业分析
3、全球与中国半导体设备市场与产业分析
4、15家半导体设备厂家研究
2014年全球半导体设备市场规模大约为380亿美元,比2013年增长10.4%。预计2015年全球半导体设备市场规模为405亿美元,比2014年增长6.7%,但是2016年该市场规模将比2015年衰退5.6%。
2016年半导体设备市场规模萎缩的原因有几点。首先是主要的电子产品如智能手机、平板电脑和笔记本电脑市场在2014年达到巅峰期,2015年市场出现停滞或下滑,平板电脑市场已经出现明显下滑。设备市场会稍微滞后,因此在2016年将出现下滑。
其次是全球范围内的通货紧缩,以石油铁矿石为首的大宗商品价格暴跌会引起连锁效应,同样会导致半导体设备价格下滑。再次是全球经济复苏态势恐停滞,美国2015年1季度GDP下滑0.7%,中国GDP增速也大大放缓。中美是全球经济主要驱动力,美国QE对经济的刺激效应开始消失,经济可能下滑。
未来难以出现类似智能手机这样的明星产品,因此半导体产业前景不明朗。
过去的2014年,半导体设备厂家都取得了不错的成绩,即使收入没有增加,营业利润都有大幅度增加。而Applied Material与Tokyo Electron合并被美国商务部否定,未来更多的并购恐怕面临来自政府领域的干涉,毕竟半导体设备市场是高度集中的市场。
2015年,中国半导体企业和机构大展神威,展开一系列并购。中国企业擅长资本操作,也热衷于资本操作,对实业缺乏兴趣,中国半导体设备市场规模在2015年为44亿美元,本土厂家只占14%,且都停留在低端设备上。
Global and China Semiconductor Equipment Industry Report, 2014-2015covers the following:
1. Global Semiconductor Market and Industry;
2. China Semiconductor Market and Industry;
3. Global and China Semiconductor Equipment Market and Industry;
4. Fifteen Semiconductor Equipment Vendors
In 2014, the global semiconductor equipment market size totaled USD38 billion, up 10.4% from 2013. It is predicted that in 2015 this figure will climb to USD40.5 billion, a rise of 6.7% from a year ago, and that the market size in 2016 will slump by 5.6% as compared to 2015. However, the possible shrinkage in 2016 might come from the following factors:
Firstly, following a peak in 2014, main electronic products such as smartphones and tablet and laptop PCs have stagnated or declined. This is particularly true of tablet PCs, which has presented a significant decline. On the other hand, equipment market delays being sluggish but will without doubt decline in 2016.
Secondly, due to the global deflation, prices for bulk commodity led by oil and iron ore plunged and would cause knock-on effect, which would in turn result in a fall in semiconductor equipment prices.
Thirdly, global economic recovery will probably come to a halt, with the US GDP dropping by 0.7% in 2015Q1. Moreover, China’s GDP growth slowed obviously. The both countries constituted the major driving force of the global economy. The stimulatory effect of US QE began to fade away, and therefore the economy might go down.
In the future, it is difficult to come up with a start product like smartphones. Thus, the prospects for the semiconductor industry remain uncertain.
In 2014, semiconductor equipment vendors made remarkable performance, with a substantial rise in operating profit, though their revenue did not increased. The merger of Applied Material and Tokyo Electron was rejected by the US Department of Commerce. In future, more of M&A plans may well be intervened by the government, after all semiconductor equipment market is a highly concentrated market.
In 2015, the Chinese semiconductor companies and institutions showed their strength, launching a series of mergers and acquisitions. The Chinese enterprises are adept in and fond of capital operation rather than industrial production. The semiconductor equipment market size in China will reach USD4.4 billion in 2015, of which the domestic companies, mostly engaged in low-end equipment, will account for just 14%.
第一章、全球半导体产业
1.1、全球半导体产业概况
1.2、存储器行业概况
1.3、DRAM供求分析
1.4、NAND供需分析
1.5、存储器产业链
1.6、内存厂家市场占有率
1.7、内存厂家排名
1.8、NorFlash厂家市场占有率
1.9、IC制造与晶圆代工
1.10、IC封测产业概况
1.11、中国IC市场
1.12、中国半导体产业
1.13、中国政府扶植半导体产业政策
1.14、中国近期半导体领域内并购
1.15、中国IC产业发展预测
第二章、半导体设备产业
2.1、半导体设备市场
2.2、半导体设备产业近况
2.3、刻蚀设备产业
2.4、薄膜沉积设备产业
2.5、光刻机设备产业
2.6、半导体进程控制设备
2.7、复合半导体设备市场
2.7.1、Aixtron
2.7.2、VEECO
2.8、半导体设备厂家排名
2.9、中国本土Local半导体设备产业
第三章、主要半导体设备厂家研究
3.1、Applied Materials
3.2、ASML
3.3、Tokyo Electron
3.4、KLA-Tencor
3.5、Lam Research
3.6、DAINIPPON SCREEN
3.7、尼康精机Nikon Precision
3.8、Advantest
3.9、Hitachi High-Technologies
3.10、ASM International N.V.
3.11、Teradyne
3.12、ASM太平洋
3.13、Kulicke & Soffa
3.14、中微半导体
3.15、北京七星电子
第四章、半导体下游市场研究
4.1、LTE手机市场
4.2、全球手机产业
4.3、中国手机市场
4.4、笔记本电脑市场
4.5、平板电脑市场
1 Global Semiconductor Industry
1.1 Overview
1.2 Memory Industry Overview
1.3 DRAM Supply and Demand
1.4 NAND Supply and Demand
1.5 Memory Industry Chain
1.6 Market Share of Memory Vendors
1.7 Ranking of Memory Vendors
1.8 Market Share of NorFlash Vendors
1.9 IC Fabrication and Wafer Foundry
1.10 Overview of IC Packaging and Testing Industry
1.11 Chinese IC Market
1.12 China’s Semiconductor Industry
1.13 China’s Policies for Fostering Semiconductor Industry
1.14 M&A Activities in China’s Semiconductor Industry
1.15 China’s IC Industry Development Forecast
2 Semiconductor Equipment Industry
2.1 Semiconductor Equipment Market
2.2 Latest Developments of Semiconductor Equipment
2.3 Etching Equipment Industry
2.4 Thin Film Deposition Equipment Industry
2.5 Lithography Equipment Industry
2.6 Semiconductor Process Control Equipment
2.7 Compound Semiconductor Equipment Market
2.7.1 Aixtron
2.7.2 VEECO
2.8 Ranking of Semiconductor Equipment Vendors
2.9 China’s Semiconductor Equipment Industry
3 Major Semiconductor Equipment Vendors
3.1 Applied Materials
3.2 ASML
3.3 Tokyo Electron
3.4 KLA-Tencor
3.5 Lam Research
3.6 DAINIPPON SCREEN
3.7 Nikon Precision
3.8 Advantest
3.9 Hitachi High-Technologies
3.10 ASM International N.V.
3.11 Teradyne
3.12 ASM PACIFIC
3.13 Kulicke & Soffa
3.14 AMEC
3.15 Sevenstar Electronics
4 Semiconductor Downstream Market
4.1LTE Mobile Phone Market
4.2Global Mobile Phone Industry
4.3 China’s Mobile Phone Market
4.4 Laptop PC Market
4.5 Tablet PC Market
2013-2019年全球半导体市场规模
2013-2016年全球半导体市场产品分布
2013-2016年全球半导体产品增幅
2008-2017年全球半导体设备资本支出额
2008-2017年全球半导体设备资本支出额下游分布
2014年Global Memory Market by type
2008-2015 Auotomotive Memory Market Size
2010-2015 Auotomotive Memory Market By Technology
2008-2015 DRAM Industry Capex
2013-2016 DRAM Oversupply Ratio
2013-2015 DRAM Demand by Devices
2013-2015 DRAM GB/SystemDRAM GB/System
2014年1季度-2016年4季度 DRAM Oversupply Ratio
2008-2015 NAND Industry Capex
Memory Industry Chain
2014年1-4季度 Branded DRAM Vendor Market share
2014年1-4季度 Branded NAND Vendor Market share
2014年1-4季度 Mobile DRAM Vendor Market share
2013-2015主要内存厂家收入排名
内存设计公司收入与营业利润率
2013-2014主要内存厂家营业利润率
2012年主要NorFlash厂家市场占有率
2014年主要NorFlash厂家市场占有率
2008-2017年全球Foundry市场规模
2012-2017 Foundry Revenue of Advanced Nodes
2013年全球十大晶圆厂产能
2005-2014年全球晶圆代工厂销售额排名
2012-2017年全球IC Packaging and Test市场规模
2012-2017年全球Outsourcing IC Packaging and Test市场规模
2012-2017年全球IC Packaging 市场规模
2012-2017年全球IC Test市场规模
2011-2017年中国IC市场规模
2006-2013年中国IC进口额
2006-2013年中国IC出口额
2008-2014 中国IC产业销售额
2008-2014 中国IC产业 Capex
2004、2014年中国十大IC设计公司销售额排名
中国集成电路基金会结构
半导体制造流程
2013-2019 Capital equipment spending
2010-2018年半导体设备市场规模
2010-2016年半导体设备市场规模地域分布
2007-2016全球Fab设备投入规模
2009-2015 Semiconductor Shipments to Japan vs. Japanese Electronic Equipment Production
1999-2015 N American Semiconductor Equipment Industry Book/Bill Ratio
2000-2015 Global Silicon Wafer vs. Semiconductor Shipments
2008-2012年Etching Market by Solution
2000\2005\2010\2013刻蚀设备市场主要厂家市场占有率
2000\2005\2010年全球CVD、PVD、ECD、CMP主要厂家市场占有率
2008-2012年Deposition market by Solution
2012 Deposition market share
1992-2011年全球光刻机厂家市场占有率
1995-2012年半导体进程控制设备市场增幅
2011-2017年Connectivity RF市场规模
手机中RF System所占成本
AIXTRON全球分布
2003-2015年AIXTRON收入与EBIT
1999-2014年AIXTRON收入下游应用分布
2013年1季度-2015年1季度AIXTRON新订单
2013年1季度-2015年1季度AIXTRON Order Backlog
AIXTRON TECHNOLOGY POSITION
Q1/2015 Aixtron Sales by end application
Q1/2015 Aixtron Sales by Business
2004-2015年VEECO收入与运营利润率
2007-2014年VEECO MOCVD市场占有率
VEECO Q1/15 Market Data
Q1/14-Q1/15 VEECO Revenue By End Market
Veeco PSP: Front-End Performance at Packaging Costs
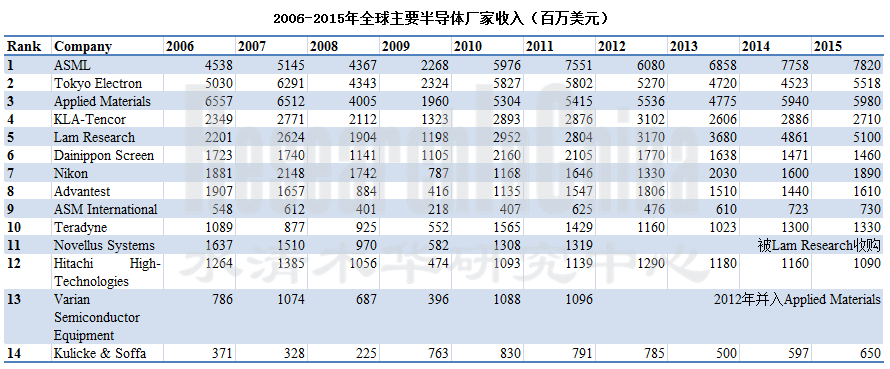
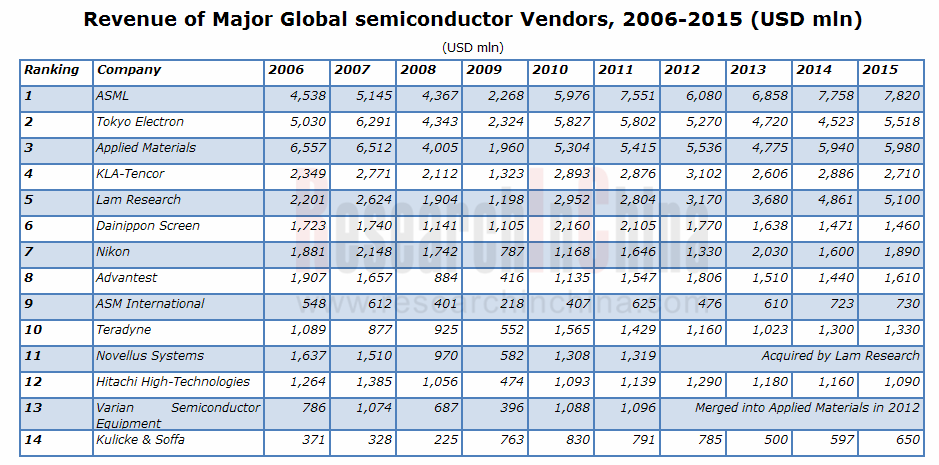
2006-2015年全球主要半导体厂家收入排名
2013-2015年全球主要半导体设备厂家营业利润率
2007-2015财年AMAT销售额与毛利率、运营利润率
FY2012-FY2014 AMAT Operation Profit by Segment
FY2007-FY2014 AMAT新订单额与在手订单额
2013年4季度-2015年1季度AMAT新订单额与运营利润
2013年4季度-2015年1季度AMAT销售额与运营利润率
FY2009-FY2015年AMAT新订单New orders地域分布
FY2009-FY2015年AMAT新订单New orders部门分布
FY2010-FY2013年AMAT在手订单Order backlog部门分布
FY2009-FY2015年AMAT销售额Net Sales地域分布
FY2009-FY2015年AMAT Net SalesBy Segment
FY2011-FY2014 Display部门收入地域分布
FY2009-FY2014年AMAT半导体设备部门新订单New orders业务分布
2007-2015年ASML销售额与毛利率
2010年1季度-2015年1季度ASML销售额
2010年1季度-2015年1季度ASML销售额下游分布
2015年1季度 ASML Backlog技术与地域分布
2013年4季度-2015年1季度 ASML季度销售额与运营利润率
2013年4季度-2015年1季度 ASML季度销量与ASP
2013年4季度-2015年1季度ASML季度销售额与Netbooking
2010-2015年ASML在手订单额Backlog in value地域分布
2010-2015年ASML在手订单额Backlog in value下游应用分布
2010-2013年ASML在手订单额Backlog in value技术分布
ASML路线图
2007-2016财年TEL销售额与运营利润率
TEL全球分布
2006-2015财年TEL收入业务分布
2006-2015财年TEL SEMI EQUIPMENT销售额地域分布
TEL清洗系统
TEL ETCH系统
2007-2015财年KLA-Tencor收入与运营利润率
2009-2015财年KLA-Tencor收入业务分布
2010-2015财年KLA-Tencor收入下游应用分布
2009-2015财年KLA-Tencor收入地域分布
2004-2013 SEMI Process Control Vendor Market Share
2002-2014 KLA-Tencor Annual R&D Spend
Foundry Fab: Normalized to $’s per 10k Wafer Starts per Month
2007-2015财年Lam Research收入与运营利润率
2007-2011年Novellus收入与净利润
2010年1季度-2011年4季度Novellus销售额与毛利
2010年1季度-2011年4季度Novellus Net Order与环比增幅
2009-2011年Novellus收入地域分布
2011-2015财年Lam Research收入下游应用分布
2009-2015财年Lam Research收入地域分布
DAINIPPON SCREEN MFG组织结构
2007-2016财年DAINIPPON SCREEN收入与运营利润率
FY2014-FY2015 DNP Net Sales by Segment
FY2014-FY2015 DNP Operation Profit by Segment
Q1/FY13-Q4/FY15 DNP Quarterly Net Sales by Segment
Q1/FY13-Q4/FY15 DNP Quarterly Orders Received and Order Backlog
Q1/FY13-Q4/FY15 DNP SE Segment Order Received by Application
Q4/FY15 DNP Quarterly SE Segment Order Received by Region
Q1/FY13-Q4/FY15 DNP Quarterly FT Segment Order Received by Application
Q4/FY15 DNP FT Segment Order Received by Region
2006-2014财年尼康精机销售额与运营利润率
FY2012-2016 NIKON Precision Equipment IC Steppers & Scanners Sales by Technology
FY2012-2016 NIKON Precision Equipment LCD Steppers & Scanners Sales by Generation
2013财年1季度-2014财年4季度Advantest毛利率与运营利润
2013财年1季度-2014财年4季度Advantest新订单部门分布
2013财年1季度-2014财年4季度Advantest新订单地域分布
2013财年1季度-2014财年4季度Advantest销售额部门分布
2013财年1季度-2014财年4季度Advantest销售额地域分布
2013财年1季度-2014财年4季度Advantest Capex/R&D /Depreciation
2015年1季度 Advantest 资产负债
Advantest全球分布
2007-2016财年Hitachi High-Technologies收入与运营利润率
2011-2016财年Hitachi High-Technologies收入部门分布
2011-2016财年Hitachi High-Technologies运营利润部门分布
2013-2014财年Hitachi High-Technologies Electronic Device Systems收入业务分布
2013-2014财年Hitachi High-Technologies Electronic Device Systems Front-end 收入Field 分布
2015-2016财年Hitachi High-Technologies Electronic Device Systems收入业务分布
2006-2014年ASM销售额与运营利润率
2006-2011年ASM销售额业务分布
ASM 2009年1季度-2015年1季度 Sales and EBIT
ASM 2011年1季度-2015年1季度Net Sales 和Working Capital
ASM 2009年1季度-2015年1季度Bookings/Backlog
2010-2014年ASM Front-end业务销售额地域分布
Universal Robots简介
2008-2014 Universal Robots出货量
2006-2015年Teradyne收入与营业利润率
2013年1季度-2015年1季度Teradyne Quarterly Orders
2013年1季度-2015年1季度Teradyne Quarterly Sales
2013年1季度-2015年1季度Teradyne Quarterly Gross Margin
2013年1季度-2015年1季度Teradyne Litepiont Quarterly Sales and Order
2015年1季度Teradyne Sales by Region
ASM分支结构
2008-2014年ASM太平洋收入与营业利润
ASM太平洋产品线
2012-2014年ASM太平洋收入业务分布
2013-2014年 ASM EBIT业务分布
2012-2014年ASM太平洋收入地域分布
2007-2015财年Kulicke & Soffa收入与运营利润率
2011-2013财年Kulicke & Soffa前10大客户
Kulicke & Soffa全球分布
2012年1季度-2015年1季度Kulicke & Soffa收入与运营利润率
2012年1季度-2015年1季度Kulicke & Soffa R&D
Kulicke & Soffa主要产品
2008-2017年Wire Bonder Equipment Market
2012-2017 Copper Bonder Unit
2008-2015年北京七星电子收入与营业利润
2009-2014年北京七星电子收入业务分布
2000-2018年Frequency bands per mobile handset device
2000-2018 Cellular terminal shipment forecast by cellular standard
2011-2018 LTE-enabled cellular terminal forecast
Worldwide Smartphone Sales to End Users by Vendor in 2014 (Thousands of Units)
Worldwide Smartphone Sales to End Users by Operating System in 2014 (Thousands of Units)
2014年全球前十大手机厂家出货量
2013年1月-2014年12月中国手机市场月度出货量
2014年中国智能手机市场主要厂家市场占有率
2014年中国4G手机市场主要厂家市场占有率
2008-2015年笔记本电脑出货量
2010-2014年全球主要笔记本电脑ODM厂家出货量
2011-2016年全球平板电脑出货量
Top Five Tablet Vendors, Shipments Fourth Quarter 2014
Top Five Tablet Vendors, Shipments, Market Share, and Growth, Calendar Year 2014
Global Semiconductor Market Size, 2013-2019E
Product Distribution of Global Semiconductor Market, 2013-2016E
Growth Rate of Global Semiconductor Products by Market Size, 2013-2016E
Capital Expenditure of Global Semiconductor Equipment, 2008-2017E
Capital Expenditure of Global Semiconductor Equipment by Downstream Application, 2008-2017E
Global Memory Market by Type, 2014
Automotive Memory Market Size, 2008-2015
Automotive Memory Market by Technology, 2010-2015
DRAM Industry Capex, 2008-2015
DRAM Oversupply Ratio, 2013-2016E
DRAM Demand by Device, 2013-2015
DRAM GB/System, 2013-2015
DRAM Oversupply Ratio, 2014Q1-2016Q4
NAND Industry Capex, 2008-2015
Memory Industry Chain
Branded DRAM Vendor Market Share, 2014Q1-Q4
Branded NAND Vendor Market share, 2014Q1-Q4
Mobile DRAM Vendor Market share, 2014Q1-Q4
Ranking of Major Memory Vendors by Revenue, 2013-2015
Revenue and Operating Margin of Memory Design Houses, 2013-2015
Operating Margin of Major Memory Vendors, 2013-2014
Market Share of Major NorFlash Vendors, 2012
Market Share of Major NorFlash Vendors, 2014
Global Foundry Market Size, 2008-2017E
Foundry Revenue of Advanced Nodes, 2012-2017E
Capacity of Top 10 IC Wafer Leaders, 2013
Ranking of Global Wafer Foundries by Sales, 2005-2014
Global IC Packaging and Testing Market Size, 2012-2017E
Global Outsourced IC Packaging and Testing Market Size, 2012-2017E
Global IC Packaging Market Size, 2012-2017E
Global IC Testing Market Size, 2012-2017E
China’s IC Market Size, 2011-2017E
China’s IC Import Value, 2006-2014
China’s IC Export Value, 2006-2014
Sales of China’s IC Industry, 2008-2014
China’s IC Industry Capex, 2008-2014
Ranking of Top 10 IC Design Houses by Sales, 2004/2014
National IC Fund Structure
Semiconductor Manufacturing Process
Capital Spending of Semiconductor Equipment, 2013-2019E
Semiconductor Equipment Market Size, 2010-2018E
Market Size of Semiconductor Equipment by Region, 2010-2016E
Global Fab Equipment Investment, 2007-2016E
Semiconductor Shipments to Japan vs. Japanese Electronic Equipment Production, 2009-2015
North American Semiconductor Equipment Industry Book/Bill Ratio, 1999-2015
Global Silicon Wafer vs. Semiconductor Shipments, 2000-2015
Etching Market by Solution, 2008-2012
Market Share of Major Etching Equipment Players , 2000\2005\2010\2013
Market Share of Major Global CVD, PVD, ECD, and CMP Vendors, 2000\2005\2010
Deposition market by Solution, 2008-2012
Deposition Market Share, 2012
Market Share of Global Lithography Equipment Vendors, 1992-2011
Growth Rate of Semiconductor Process Control Equipment Market, 1995-2012
Connectivity RF Market Size, 2011-2017E
Costs of Mobile Phone RF System
Global Presence of AIXTRON
AIXTRON’s Revenue and EBIT, 2003-2015
AIXTRON’s Revenue by Application, 1999-2014
AIXTRON’s Order Intake, 2013Q1-2015Q1
AIXTRON Order Backlog, 2013Q1-2015Q1
AIXTRON Technology Position
Aixtron Sales by End Application, Q1/2015
Aixtron Sales by Business, Q1/2015
VEECO’s Revenue and Operating Margin, 2004-2015
VEECO’s MOCVD Market Share, 2007-2014
VEECO’s Market Data, Q1/15
VEECO’s Revenue by End Market, Q1/14-Q1/15
Veeco PSP: Front-End Performance at Packaging Costs
Ranking of Global Semiconductor Equipment Vendors by Revenue, 2006-2015
Operating Margin of Major Global Semiconductor Equipment Vendors, 2013-2015
AMAT's Revenue, Gross Margin and Operating Margin, FY2007-FY2015
AMAT’s Operation Profit by Segment, FY2012-FY2014
Value of AMAT's New Orders and Order Backlog, FY2007-FY2014
AMAT's New Order Value and Operating Profit, 2013Q4-2015Q1
AMAT's Revenue and Operating Margin, 2013Q4-2015Q1
AMAT's New Orders by Region, FY2009-FY2015
AMAT's New Orders by Division, FY2009-FY2015
AMAT's Order Backlog by Division, FY2010-FY2013
AMAT's Net Sales by Region, FY2009-FY2015
AMAT’s Net Sales by Segment, FY2009-FY2015
AMAT’s Display Revenue by Region, FY2011-FY2014
New Orders of AMAT's Semiconductor Equipment Segment by Business, FY2009-FY2014
ASML's Revenue and Gross Margin, 2007-2015
ASML's Revenue, 2010Q1-2015Q1
ASML's Revenue by Application, 2010Q1-2015Q1
ASML’s Order Backlog by Technology and Region, 2015Q1
ASML's Quarterly Revenue and Operating Margin, 2013Q4-2015Q1
ASML's Quarterly Sales Volume and ASP, 2013Q4-2015Q1
ASML's Quarterly Revenue and Netbooking, 2013Q4-2015Q1
ASML's Order Backlog Value by Region, 2010-2015
ASML's Order Backlog Value by Application, 2010-2015
ASML's Order Backlog Value by Technology, 2010-2015
ASML's Roadmap
TEL’s Revenue and Operating Margin, FY2007-FY2016
Global Presence of TEL
TEL’s Revenue by Business, FY2006-FY2015
TEL’s Semi Equipment Revenue by Region, FY2006-FY2015
TEL’s Cleaning System
TEL’s ETCH System
KLA-Tencor’s Revenue and Operating Margin, FY2007-FY2015
KLA-Tencor’s Revenue by Business, FY2009-FY2015
KLA-Tencor’s Revenue by Application, FY2010-FY2015
KLA-Tencor’s Revenue by Region, FY2009-FY2015
SEMI Process Control Vendor Market Share, 2004-2013
KLA-Tencor Annual R&D Spending, 2002-2014
Foundry Fab: Normalized to $’s per 10k Wafer Starts per Month
Revenue and Operating Margin of Lam Research, FY2007-FY2015
Revenue and Net Income of Novellus, FY 2007- FY 2011
Revenue and Gross Profit of Novellus, 2010Q1-2011Q4
Net Orders and MoM Growth of Novellus, 2010Q1-2011Q4
Revenue of Novellus by Region, 2009-2011
Revenue of Lam Research by Application, FY2011-FY2015
Revenue of Lam Research by Region, FY2009-FY2015
Organizational Structure of DAINIPPON SCREEN MFG
Revenue and Operating Margin of DAINIPPON SCREEN, FY2007-FY2016
DNP Net Sales by Segment, FY2014-FY2015
DNP Operation Profit by Segment, FY2014-FY2015
DNP Quarterly Net Sales by Segment, Q1/FY13-Q4/FY15
DNP Quarterly Orders Received and Order Backlog, Q1/FY13-Q4/FY15
DNP SE Segment Order Received by Application, Q1/FY13-Q4/FY15
DNP Quarterly SE Segment Order Received by Region, Q4/FY15
DNP Quarterly FT Segment Order Received by Application, Q1/FY13-Q4/FY15
DNP FT Segment Order Received by Region, Q4/FY15
Balance Sheet of DNP, Q1/FY2015
Revenue and Operating Margin of Nikon Precision, FY2006-FY2016
NIKON Precision Equipment IC Steppers & Scanners Sales by Technology, FY2012-FY2016
NIKON Precision Equipment LCD Steppers & Scanners Sales by Generation, FY2012-FY2016
Advantest's Gross Margin and Operating Profit, FY2013Q1-FY2015Q4
Advantest's New Orders by Division, FY2013Q1-FY2015Q4
Advantest's New Orders by Region, FY2013Q1-FY2015Q4
Advantest's Revenue by Division, FY2013Q1-FY2015Q4
Advantest's Revenue by Region, FY2013Q1-FY2015Q4
Advantest Capex/R&D /Depreciation, FY2013Q1-FY2015Q4
Balance Sheet of Advantest, 2015Q1
Global Presence of Advantest
Revenue and Operating Margin of Hitachi High-Technologies, FY2007-FY2016
Revenue of Hitachi High-Technologies by Division, FY2011-FY2016
Operating Profit of Hitachi High-Technologies by Division, FY2011-FY2016
Electronic Device System Revenue of Hitachi High-Technologies by Business, FY2013-FY2014
Electronic Device System Front-end Revenue of Hitachi High-Technologies by Field, FY2013-FY2014
Hitachi High-Technologies’ Reverence from Electronic Device Systems by Business, FY2015-FY2016
ASM’s Revenue and Operating Margin, 2006-2014
ASM’s Revenue by Business, 2006-2012
ASM’s Sales and EBIT, 2009Q1-2015Q1
ASM’s Net Sales and Working Capital, 2011Q1-2015Q1
ASM’s Bookings/Backlog, 2009Q1-2015Q1
ASM’s Front-end Revenue by Region, 2010-2014
Profile of Universal Robots
Shipments of Universal Robots, 2008-2014
Teradyne’s Revenue and Operating Margin, 2006-2015
Teradyne’s Quarterly Orders, 2013Q1-2015Q1
Teradyne’s Quarterly Sales, 2013Q1-2015Q1
Teradyne’s Quarterly Gross Margin, 2013Q1-2015Q1
Teradyne Litepiont’s Quarterly Sales and Order, 2013Q1-2015Q1
Teradyne’s Sales by Region, 2015Q1
ASM PACIFIC’s Branches
ASM PACIFIC’s Revenue and Operating Profit, 2008-2014
ASM PACIFIC’s Product lines
ASM PACIFIC’s Revenue by Business, 2012-2014
ASM PACIFIC’s EBIT by Business, 2013-2014
ASM PACIFIC’s Revenue by Region, 2012-2014
Revenue and Operating Margin of Kulicke & Soffa, FY2007-FY2015
Top 10 Clients of Kulicke & Soffa, FY2011-FY2013
Global Presence of Kulicke & Soffa
Revenue and Operating Margin of Kulicke & Soffa, 2012Q1-2015Q1
Kulicke & Soffa R&D, 2012Q1-2015Q1
Kulicke & Soffa’s Main Products
K&S’s Share of Wire Bonder Equipment Market, 208-2017E
K&S’s Copper Bonder Unit, 2012-2017E
Revenue and Operating Profit of Sevenstar Electronics, 2008-2015
Revenue of Sevenstar Electronics by Business, 2009-2014
Frequency Bands per Mobile Handset Device, 2000-2018E
Cellular Terminal Shipment by Cellular Standard, 2000-2018E
LTE-enabled Cellular Terminal, 2011-2018E
Worldwide Smartphone Sales to End Users by Vendor, 2014 (Thousands of Units)
Worldwide Smartphone Sales to End Users by Operating System, 2014 (Thousands of Units)
Shipments of World’s Top 10 Mobile Phone Vendors, 2014
Monthly Shipments of Mobile Phones in China, Jan, 2013-Dec. 2014
Market Share of Major Smartphone Vendors in China, 2014
Market Share of Major 4G Mobile Phone Vendors in China, 2014
Laptop Computer Shipments, 2008-2015
Shipments of Major Laptop ODM Vendors Worldwide, 2010-2014
Global Tablet PC Shipments, 2011-2016E
Shipments of Top 5 Tablet Vendors, 2014Q4
Shipments, Market Share, and Growth of Top 5 Tablet Vendors, 2014
如果这份报告不能满足您的要求,我们还可以为您定制报告,请 留言说明您的详细需求。
|