|
|
|
报告导航:研究报告—
制造业—能源矿产
|
|
2014-2018年中国稀土行业研究报告 |
 |
字数:4.5万 |
页数:130 |
图表数:169 |
|
中文电子版:9000元 |
中文纸版:4500元 |
中文(电子+纸)版:9500元 |
|
英文电子版:2400美元 |
英文纸版:2600美元 |
英文(电子+纸)版:2700美元 |
|
编号:ZHP023
|
发布日期:2015-06 |
附件:下载 |
 |
|
|
稀土(又称稀土金属or稀土元素)是指化学元素周期表中的镧系元素(含15种元素)以及与之密切相关的钪和钇元素的合称。其主要蕴含在氟碳铈矿、磷钇矿、独居石等矿产中,是重要的战略资源。目前全球约35个国家拥有稀土资源,储量为13,000万吨,仅中国就占了42.3%。
为了保护和合理开发优势资源,自2006年起中国实行稀土开采总量控制政策,使2010-2013年稀土矿产量出现连续下滑。2014年,国家上调稀土开采总量指标,从而带动稀土矿产量同比增长14.5%至9.5万吨,约占全球产量的86.4%。
中国生产的稀土除供应国内需求,还出口至欧美、日韩等地区。2014年,中国出口稀土产品2.9万吨(75.5%为稀土永磁产品),约为生产量的32.1%。虽然近两年稀土产品出口量稳步增长,但受出口价格走低的影响,出口额持续下跌,2014年下跌35.7%至3.7亿美元。
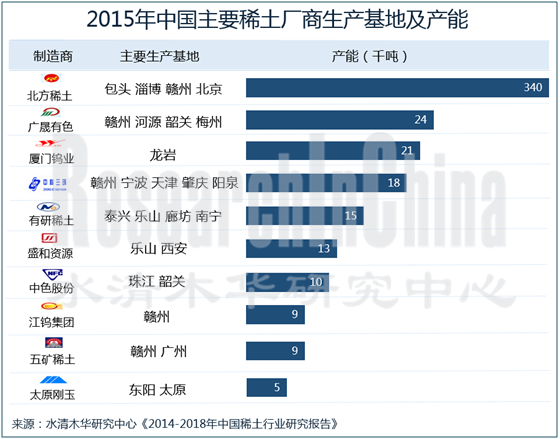
中国稀土行业一直存在企业集中度低、布局分散的问题。市场份额最大的企业——北方稀土,2014年稀土收入仅占全国市场的7.1%。2015年,6大稀土集团实施整合,届时稀土行业集中度将出现显著提升。
北方稀土:中国最大的稀土生产企业,产能约35万吨/年。2015年4月,公司与内蒙古科学技术厅、包头市政府、中国科学院共同组建中国科学院包头稀土研发中心,以进一步提升公司稀土应用产品的研发能力。
广晟有色:2015年5月30日,公司拟向特定对象募资22亿元。其中5.7亿元将用于稀土矿山扩界:平远华企矿山扩界项目投资3.9亿元、大浦新城基矿山扩界项目投资1.8亿元。
中色股份:2014年3月,公司与澳大利亚格陵兰矿物与能源公司(Greenland Minerals and Energy)合作开发科瓦内湾(Kvanefjeld)稀土项目。2015年3月,该项目完成可行性研究,年内可进行试点运行。
中科三环:中国最大钕铁硼制造商,现有烧结钕铁硼产能14,000吨/年,粘结钕铁硼产能1,500吨/年。2015年2月,公司与日立金属签订协议,拟在华设立高性能钕铁硼合资公司,设计产能2,000吨/年。
水清木华研究中心《2014-2018年中国稀土行业研究报告》着重研究了以下内容:
 全球稀土资源现状、供需情况、重点企业等; 全球稀土资源现状、供需情况、重点企业等;
中国稀土产业环境、政策环境、区域发展情况等;
中国稀土市场规模、市场结构、出口情况、市场价格等;
中国主要稀土新材料市场需求现状、主要生产商等;
中国13家主要稀土制造商经营情况、收入结构、稀土业务现状等;
中国5家稀土新材料制造商经营情况、收入结构、发展动态等。
Rare earth, also known as rare earth metal or rare earth element, collectively refers to lanthanides (including fifteen elements) and closely-related scandium and yttrium. As a crucial strategic resource, it is mainly contained in bastnaesite, xenotime, monazite, and other minerals. At present, rare earth resources have been discovered in about 35 countries and regions around the world, with total reserves of 130 million tons, of which 42.3% are owned by China alone.
In order to protect and rationally develop superior resources, China has adopted a cap-control policy for rare earth exploitation since 2006 so that the rare earth ore production suffered a continuous decline from 2010 to 2013. In 2014, the State raised the upper limit, a move that helped drive the rare earth output rise 14.5% year on year to 95,000 tons, occupying about 86.4% of the global total.
Besides meeting the domestic demand, China’s rare earth and its products are also exported to the United States, Europe, Japan, South Korea, etc., with 2014’s export volume of rare earth products reaching about 29,000 tons (rare-earth permanent magnet products 75.5%), accounting for 32.1% of the total output. Despite a steady rise in rare earth product exports over the past two years, the export value, affected by the lower export prices, continued to fall, by 35.7% to USD370 million in 2014.
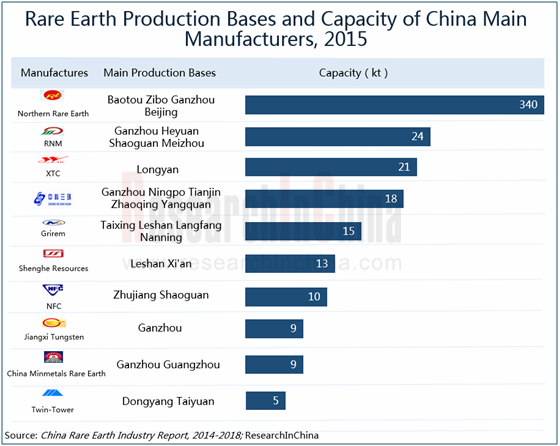
China’s rare earth industry has been facing quite a few challenges like low enterprise concentration and scattered layout. In 2014, Inner Mongolia Baotou Steel Rare-earth, which represents the largest market share, generated revenue that accounted for a meager 7.1% of the total nationwide. In 2015, the 6 major rare earth companies will implement integration, when the rare earth industry concentration will increase significantly.
Inner Mongolia Baotou Steel Rare-earth (Group): As China's largest rare earth producer, the company has an annual capacity of approximately 350,000 tons/a. In April 2015, the company, along with the Department of Science and Technology of Inner Mongolia, Baotou Municipal Government, and Chinese Academy of Sciences (CAS), established CAS Baotou Rare Earth Research and Development Center, hoping to further enhance the research and development capabilities of rare earth application products.
Rising Nonferrous Metals Group: On May 30, 2015, the company proposed to raise a fund of RMB2.2 billion from targeted sources, of which RMB570 million will go into rare earth mine expansion: RMB390 million into Pingyuan Huaqi Rare Earth Industrial Co., Ltd., and RMB180 million into Dapu Xinchengji Industry & Trade Co., Ltd.
China Non-ferrous Metal Industry’s Foreign Engineering and Construction: In March 2014, the company began to develop Kvanefjeld rare earth project in cooperation with Greenland Minerals and Energy. In March 2015, the project’s feasibility research was completed and pilot operation can be carried out within the year.
Zhong Ke San Huan: As the largest NdFeB manufacturer in China, it now has the capacity of 14,000 tons/a sintered NdFeB and 1,500 tons/a bonded NdFeB. In February 2015, the company signed an agreement with Hitachi Metals over an attempt to set up a high-performance NdFeB joint venture in China, with a design capacity of 2,000 tons/a.
China Rare Earth Industry Report, 2014-2018 compiled by ResearchInChina mainly deals with the following:
 Status quo, supply and demand, key enterprises, etc. of global rare earth resources; Status quo, supply and demand, key enterprises, etc. of global rare earth resources;
Industry environment, policy environment, regional development, etc. of rare earth in China;
Market size, market structure, export, market price, etc. of rare earth in China;
Market demand, major producers, etc. of main rare earth new materials in China;
Operation, revenue structure, rare earth business, etc. of 13 major rare earth producers in China;
Operation, revenue structure, latest developments, etc. of 5 rare earth new material manufacturers in China.
第一章 稀土行业概述
1.1 定义及分类
1.2 产业链
第二章 全球稀土行业发展现状
2.1 资源现状
2.1.1 储量及分布
2.1.2 海外稀土矿山开发情况
2.2 供需情况
2.2.1 供给
2.2.2 消费
2.3 重点企业
第三章 中国稀土行业发展环境
3.1 产业环境
3.2 政策环境
3.2.1 生产政策
3.2.2 外商投资政策
3.2.3 出口政策
3.2.4 产业整合政策
3.2.5 专用发票制度
3.3 政策走向
第四章 中国稀土行业发展现状
4.1 储量及分布
4.1.1 资源分布
4.1.2 离子型稀土矿
4.2 主要地区稀土产业发展状况
4.2.1 内蒙古
4.2.2 四川
4.2.3 山东
4.2.4 江西
4.2.5 广西
4.2.6 广东
4.2.7 湖南
4.2.8 福建
4.2.9 云南
第五章 中国稀土市场供需情况
5.1 供需情况
5.1.1 稀土矿生产情况
5.1.2 稀土产品生产情况
5.1.3 稀土消费情况
5.2 出口情况
5.2.1 出口规模
5.2.2 出口价格
5.2.3 出口结构
5.2.4 出口诉讼
5.3 市场价格
5.3.1 整体价格走势
5.3.2 主要中重稀土金属产品价格
5.3.3 主要轻稀土金属产品价格
第六章 中国稀土新材料市场分析
6.1 磁性材料
6.1.1 主要应用领域
6.1.2 消耗情况
6.1.3 主要企业及产能
6.2 储氢材料
6.2.1 消耗情况
6.2.2 主要企业及产能
6.3 抛光材料
6.3.1 消耗情况
6.3.2 主要企业及产能
6.4 发光材料
6.4.1 主要应用领域
6.4.2 生产情况
6.4.3 主要企业及产能
第七章 中国主要稀土生产商
7.1 北方稀土
7.1.1 公司简介
7.1.2 经营情况
7.1.3 收入结构
7.1.4 毛利率
7.1.5 稀土业务
7.2 五矿稀土
7.2.1 公司简介
7.2.2 经营情况
7.2.3 收入结构
7.2.4 毛利率
7.2.5 稀土业务
7.3 江钨集团
7.3.1 公司简介
7.3.2 经营情况
7.3.3 稀土业务
7.4 中色股份
7.4.1 公司简介
7.4.2 经营情况
7.4.3 收入结构
7.4.4 稀土业务
7.5 广晟有色
7.5.1 公司简介
7.5.2 经营情况
7.5.3 收入结构
7.5.4 毛利率
7.5.5 稀土业务
7.6 厦门钨业
7.6.1 公司简介
7.6.2 经营情况
7.6.3 收入结构
7.6.4 稀土业务
7.7 湖南稀土院
7.7.1 企业简介
7.7.2 经营情况
7.8 盛和资源
7.8.1 公司简介
7.8.2 经营情况
7.8.3 收入结构
7.8.4 稀土业务
7.9 中国稀土
7.9.1 公司简介
7.9.2 经营情况
7.9.3 收入结构
7.9.4 稀土业务
7.10 有研稀土
7.10.1 企业简介
7.10.2 经营情况
7.10.3 发展动态
7.11 江阴加华
7.11.1 公司简介
7.11.2 经营情况
7.12 淄博加华
7.12.1 公司简介
7.12.2 经营情况
7.13 赣州晨光
7.13.1 公司简介
7.13.2 经营情况
第八章 中国主要稀土新材料生产商
8.1 中科三环
8.1.1 公司简介
8.1.2 公司产业链拓展情况
8.1.3 经营情况
8.1.4 收入结构
8.1.5 毛利率
8.1.6 发展动态
8.1.7 稀土业务
8.2 宁波韵升
8.2.1 公司简介
8.2.2 经营情况
8.2.3 收入结构
8.2.4 毛利率
8.2.5 稀土业务
8.3 太原刚玉
8.3.1 公司简介
8.3.2 经营情况
8.3.3 收入结构
8.3.4 毛利率
8.3.5 稀土业务
8.4 科恒股份
8.4.1 公司简介
8.4.2 经营情况
8.4.3 收入结构
8.4.4 毛利率
8.4.5 稀土业务
8.5 彩虹荧光
8.5.1 公司简介
8.5.2 经营情况
第九章 总结
9.1 市场
9.2 企业
1. Overview of Rare Earth Industry
1.1 Definition & Classification
1.2 Industry Chain
2. Development of Global Rare Earth Industry
2.1 Resource Situation
2.1.1 Reserves and Distribution
2.1.2 Development of Rare Earth Mining Overseas
2.2 Supply & Demand
2.2.1 Supply
2.2.2 Consumption
2.3 Key Enterprises
3. Development Environment for China’s Rare Earth Industry
3.1 Industry Environment
3.2 Policy Environment
3.2.1 Production Policy
3.2.2 Foreign Investment Policy
3.2.3 Export Policy
3.2.4 Industrial Integration Policy
3.2.5 Special Invoice System
3.3 Policy Trend
4. Development Status of China’s Rare Earth Industry
4.1 Reserves and Distribution
4.1.1 Resource Distribution
4.1.2 Ion-absorbing Type Rare Earth Ore
4.2 Development in Major Regions
4.2.1 Inner Mongolia
4.2.2 Sichuan
4.2.3 Shandong
4.2.4 Jiangxi
4.2.5 Guangxi
4.2.6 Guangdong
4.2.7 Hunan
4.2.8 Fujian
4.2.9 Yunnan
5. Supply and Demand of China’s Rare Earth Market
5.1 Supply & Demand
5.1.1 Production of Rare Earth Ore
5.1.2 Production of Rare Earth Products
5.1.3 Consumption of Rare Earth
5.2 Export
5.2.1 Export Scale
5.2.2 Export Price
5.2.3 Export Structure
5.2.4 Export Litigation
5.3 Market Price
5.3.1 Overall Price
5.3.2 Prices of Major Middle & Heavy Rare Earth Metals
5.3.3 Prices of Major Light Rare Earth Metals
6. Rare Earth New Material Market in China
6.1 Magnetic Materials
6.1.1 Major Applications
6.1.2 Consumption
6.1.3 Major Enterprises and Capacity
6.2 Hydrogen Storage Material
6.2.1 Consumption
6.2.2 Major Enterprises and Capacity
6.3 Polishing Material
6.3.1 Consumption
6.3.2 Major Enterprises and Capacity
6.4 Luminescent Material
6.4.1 Major Applications
6.4.2 Production
6.4.3 Major Enterprises and Capacity
7. Major Rare Earth Enterprises in China
7.1 Inner Mongolia Baotou Steel Rare-Earth (Group) Hi-Tech Co., Ltd.
7.1.1 Profile
7.1.2 Operation
7.1.3 Revenue Structure
7.1.4 Gross Margin
7.1.5 Rare Earth Business
7.2 China Minmetals Rare Earth Co., Ltd.
7.2.1 Profile
7.2.2 Operation
7.2.3 Revenue Structure
7.2.4 Gross Margin
7.2.5 Rare Earth Business
7.3 Jiangxi Tungsten Industry Group Co., Ltd.
7.3.1 Profile
7.3.2 Operation
7.3.3 Rare Earth Business
7.4 China Nonferrous Metal Industry's Foreign Engineering and Construction Co., Ltd.
7.4.1 Profile
7.4.2 Operation
7.4.3 Revenue Structure
7.4.4 Rare Earth Business
7.5 Rising Nonferrous Metals Group Co., Ltd.
7.5.1 Profile
7.5.2 Operation
7.5.3 Revenue Structure
7.5.4 Gross Margin
7.5.5 Rare Earth Business
7.6 Xiamen Tungsten Co., Ltd.
7.6.1 Profile
7.6.2 Operation
7.6.3 Revenue Structure
7.6.4 Rare Earth Business
7.7 Hunan Rare-Earth Research Institute
7.7.1 Profile
7.7.2 Operation
7.8 Leshan Shenghe Rare Earth Technology Co., Ltd.
7.8.1 Profile
7.8.2 Operation
7.8.3 Revenue Structure
7.8.4 Rare Earth Business
7.9 China Rare Earth Holdings Ltd.
7.9.1 Profile
7.9.2 Operation
7.9.3 Revenue Structure
7.9.4 Rare Earth Business
7.10 Grirem Advanced Materials Co., Ltd.
7.10.1 Profile
7.10.2 Operation
7.10.3 Latest Developments
7.11 Jiangyin Jiahua Advanced Material Resources Co., Ltd.
7.11.1 Profile
7.11.2 Operation
7.12 Zibo Jiahua Advanced Material Resource Co., Ltd.
7.12.1 Profile
7.12.2 Operation
7.13 Gan Zhou Chen Guang Rare Earths New Material Shares Co., Ltd.
7.13.1 Profile
7.13.2 Operation
8. Major Rare Earth New Material Manufacturers in China
8.1 Beijing Zhong Ke San Huan High-Tech Co., Ltd.
8.1.1 Profile
8.1.2 Industry Chain Expansion
8.1.3 Operation
8.1.4 Revenue Structure
8.1.5 Gross Margin
8.1.6 Latest Developments
8.1.7 Rare Earth Business
8.2 Ningbo Yunsheng Co., Ltd.
8.2.1 Profile
8.2.2 Operation
8.2.3 Revenue Structure
8.2.4 Gross Margin
8.2.5 Rare Earth Business
8.3 Taiyuan Twin Tower Alomllum Oxide Co., Ltd.
8.3.1 Profile
8.3.2 Operation
8.3.3 Revenue Structure
8.3.4 Gross Margin
8.3.5 Rare Earth Business
8.4 Jiangmen Kanhoo Industry Co., Ltd.
8.4.1 Profile
8.4.2 Operation
8.4.3 Revenue Structure
8.4.4 Gross Margin
8.4.5 Rare Earth Business
8.5 Shannxi IRICO Fluorescent Materials Co., Ltd.
8.5.1 Profile
8.5.2 Operation
9. Summary
9.1 Market
9.2 Enterprises
表:稀土分类
图:稀土行业产业链
表:稀土矿类型
表:2014年全球稀土资源储量分布
表:2014年国外稀土矿山开发项目
表:海外主要稀土矿山开发项目概况
图:2009-2014年全球(分地区)稀土产量
图:2015年全球稀土供应格局
图:2006-2018年全球稀土消费量及增速
图:2014年全球稀土(分国家)消费量构成
图:2014年美国稀土(分产品)消费结构
图:2014年日本稀土(分产品)消费结构
表:2018年全球稀土消费结构预测
表:2018年全球下游行业稀土各元素的消费量预测
表:国外主要稀土企业
表:2002-2014年中国公布的主要稀土产业政策
表:2014年中国符合稀土行业准入条件企业名单
表:2014年中国(分地区)稀土采矿证数量
表:2011-2014年中国稀土产业整合政策
图:2014年中国稀土资源分布
表:中国主要矿区稀土矿床利用对比情况
图:2014年中国离子型稀土矿分布
表:中国离子型稀土矿配份
表:全球主要资源静态储采比
表:2015年稀土开采总量控制指标
表:四川省主要稀土运用企业
图:2008-2014年中国稀土矿产量及增速
图:2008-2014年中国稀土矿生产结构
图:2008-2014年中国稀土产品产量及增速
表:2008-2014年中国稀土产品生产结构
表:通过环保审查的稀土企业数量
图:2006-2018年中国稀土消费量
图:2006-2016年中国新材料领域占稀土消费的比重
图:2014年中国稀土消费结构
图:2006-2014年中国稀土产品出口量及增速
图:2006-2014年中国稀土产品出口额及增速
图:2006-2014年中国稀土商品出口均价
图:2014年中国稀土分离冶炼产品(分国家/地区)出口量构成
表:2014年中国主要稀土氧化物出口量及出口额
图:2001-2014年中国稀土永磁体出口量及增速
图:2014年中国稀土永磁体(分国家/地区)出口量构成
表:稀土WTO争端解决基本流程
表:2014年中国主要稀土氧化物均价
图:2013-2015年中国氧化镝价格
图:2013-2015年中国金属镝价格
图:2013-2015年中国氧化铒价格
图:2013-2015年中国氧化铕价格
图:2013-2015年中国氧化钆价格
图:2013-2015年中国氧化钐价格
图:2013-2015年中国金属铽价格
图:2013-2015年中国氧化铽价格
图:2013-2015年中国金属钇价格
图:2013-2015年中国氧化钇价格
图:2013-2015年中国氧化铈价格
图:2013-2015年中国氧化钕价格
图:2013-2015年中国氧化镧价格
图:2013-2015年中国氧化镨价格
图:2013-2015年中国金属钕价格
图:2013-2015年中国金属镧价格
图:2013-2015年中国金属铈价格
图:稀土永磁材料中稀土元素应用比重
表:钕铁硼永磁材料与其他永磁材料磁性能对比
表:中国钕铁硼应用领域
图:2014年中国稀土永磁消费结构
图:2006-2016年中国永磁材料对稀土消耗量
图:2014年中国钕铁硼产能格局
表:2014年中国钕铁硼主要企业产能
图:稀土储氢材料中稀土元素应用比重
图:2014年中国镍氢电池消费结构
图:2006-2016年中国储氢材料对稀土的消耗量
表:2014年中国稀土储氢材料主要企业产能
图:稀土抛光材料中稀土元素应用比重
表:中国稀土抛光粉的主要应用领域
图:2006-2016年中国抛光材料对稀土的消耗量
表:2013年中国主要抛光材料企业产能
图:稀土发光材料中稀土元素应用比重
表:稀土发光材料应用领域
图:2014年中国稀土发光材料(分地区)产量构成
图:2008-2016年中国稀土发光材料产量
表:2014年中国主要稀土发光材料企业产能
图:2015年北方稀土股权结构
图:2008-2015年北方稀土营业收入及净利润
图:2011-2014年北方稀土(分产品)营业收入
图:2010-2014年北方稀土(分地区)营业收入
图:2011-2014年北方稀土(分产品)毛利率
表:北方稀土主要稀土产品
表:2014年北方稀土主要产品产能
表:2014年北方稀土主要稀土子公司营业收入及净利润
图:2015年五矿稀土股权结构
图:2011-2015年五矿稀土主营业务收入及净利润
图:2012-2014年五矿稀土(分产品)营业收入
图:2011-2014年五矿稀土(分产品)毛利率
表:五矿稀土主要下属企业主导稀土产品及产能
图:2011-2014年五矿稀土稀土产销量
图:2009-2015年江钨集团营业收入及增速
表:江西钨业主要下属稀土企业
图:2015年中色股份股权结构
图:2008-2015年中色股份营业收入及净利润
图:中色股份全球布局
图:2011-2014年中色股份(分产品)营业收入
图:2011-2014年中色股份(分地区)营业收入
图:2011-2014年中色股份稀土氧化物产销量
表:2014年中色股份主要稀土子公司盈利情况
图:2015年广晟有色股权结构
图:2008-2015年广晟有色营业收入及净利润
图:2010-2014年广晟有色(分产品)营业收入
图:2010-2014年广晟有色(分地区)营业收入
图:2010-2014年广晟有色(分产品)毛利率
图:2014广晟有色稀土产品成本结构
表:广晟有色主要稀土子公司生产规模
图:2015年厦门钨业股权结构
图:2008-2015年厦门钨业营业收入及净利润
图:2013-2014年厦门钨业(分产品)营业收入构成
图:2011-2014年厦门钨业(分产品)营业收入
表:2014年厦门钨业主要稀土产品产能
图:2013-2014年厦门钨业主要稀土产品销量
表:2011-2014年厦门钨业稀土开采总量控制指标
表:湖南稀土院有限责任公司主要运作稀土项目
图:2010-2015年湖南稀土新能源材料研究院营业收入规划
图:2015年盛和资源股权结构
图:2009-2015年盛和资源营业收入及净利润
图:2011-2014年盛和资源(分产品)营业收入
图:2011-2014年盛和资源(分地区)营业收入
表:2013-2014年盛和资源主要稀土产品产销量
表:2014年盛和资源主要稀土子公司经营情况
图:2015年中国稀土股权结构
图:2008-2014年中国稀土营业收入及净利润
图:2008-2014年中国稀土(分产品)主营业务收入
图:2010-2014年中国稀土(分地区)稀土收入占比
表:有研稀土主要产品
图:2009-2014年乐山有研稀土新材料有限公司营业收入及增速
图:2009-2014年廊坊关西磁性材料有限公司主营业务收入
表:2011-2014年有研稀土稀土出口配额
表:2011-2014年江阴加华稀土出口配额
表:2011-2014年淄博加华稀土出口配额
表:2010-2014年赣州晨光营业收入及净利润
表:2011-2014年赣州晨光稀土产品出口配额
图:2015年中科三环股权结构
表:中科三环旗下主要稀土原料生产企业
图:2008-2015年中科三环营业收入及净利润
图:2010-2014年中科三环(分产品)营业收入
表:2010-2014年中科三环(分地区)营业收入
图:2010-2014年中科三环(分产品)毛利率
表:2014年中科三环主要稀土永磁材料技术改造项目
表:中科三环旗下主要钕铁硼生产企业
图:2015年宁波韵升股权结构
图:2008-2015年宁波韵升营业收入及净利润
图:2010-2014年宁波韵升(分产品)营业收入
图:2010-2014年宁波韵升(分地区)营业收入
图:2010-2014年宁波韵升(分产品)毛利率
图:2014年宁波韵升钕铁硼成本结构
表:2014年宁波韵升主要磁材子公司经营情况
图:2015年太原刚玉股权结构
图:2008-2015年太原刚玉营业收入及净利润
图:2010-2014年太原刚玉(分产品)营业收入
图:2008-2014年太原刚玉(分产品)毛利率
表:2014年宁波韵升钕铁硼产能
图:2013-2014年宁波韵升钕铁硼产销量
图:2015年科恒股份股权结构
图:2008-2015年科恒股份营业收入及净利润
图:2009-2014年科恒股份(分产品)主营收入
表:2013-2014年科恒股份(分地区)营业收入
图:2009-2014年科恒股份(分产品)毛利率
图:2009-2014年科恒股份稀土发光材料产销量
图:2010-2014年彩虹荧光营业收入及增速
图:2009-2014年中国稀土及其产品销量增长率
图:2007-2014年中国稀土产品出口量及出口额增长率
图:2009-2014年中国稀土行业主要企业营业收入增长率
图:2014年中国稀土市场竞争格局
Rare Earth Classification
Rare Earth Industry Chain
Rare Earth Ore Classification
Global Distribution of Rare Earth Reserves, 2014
Overseas Rare Earth Mine Development Projects, 2014
Overview of Major Overseas Rare Earth Mine Development Projects
Global Rare Earth Output by Region, 2009-2014
Global Rare Earth Supply Pattern, 2015
Global Rare Earth Consumption and Growth Rate, 2006-2018E
Global Rare Earth (by Country) Consumption, 2014
U.S. Rare Earth Consumption Structure by Product, 2014
Japan’s Rare Earth Consumption Structure by Product, 2014
Consumption Structure of Global Rare Earth, 2018E
Consumption of Rare Earth Elements Worldwide by Application, 2018E
Major Foreign Rare Earth Enterprises
China’s Major Policies on Rare Earth Industry, 2002-2014
List of Enterprises Qualified for Rare Earth Industry Access Conditions in China, 2014
Quantity of Rare Earth Mining Licenses by Region in China, 2014
China’s Policies on Rare Earth Industry Integration, 2011-2014
China’s Rare Earth Distribution, 2014
Ore Bed Utilization of Leading Rare Earth Mines in China
Distribution of Ion Absorption Type Rare Earth Ore in China, 2014
Share of Ion Absorption Type Rare Earth Ore in China
Static Reserves-to-Output Ratio of Major Resources Worldwide
Rare Earth Exploitation Control Indices, 2015
Main Rare Earth Application Enterprises in Sichuan
Output and Growth Rate of Rare Earth Ore in China, 2008-2014
China’s Production Structure of Rare Earth Ore, 2008-2014
Output and Growth Rate of Rare Earth Products in China, 2008-2014
China’s Production Structure of Rare Earth Products, 2008-2014
Name List of Rare Earth Companies Having Passed Environmental Protection Examination
Rare Earth Consumption in China, 2006-2018E
Proportion of New Materials in Rare Earth Consumption in China, 2006-2016E
China’s Rare Earth Consumption Structure, 2014
Export Volume and Growth Rate of Rare Earth Products in China, 2006-2014
Export Value and Growth Rate of Rare Earth Products in China, 2006-2014
Average Export Price for Rare Earth Products in China, 2006-2014
China’s Rare Earth Smelting Separation Product Export Structure by Country/Region, 2014
Export Volume and Value of Major Rare Earth Oxides in China, 2014
Export Volume and Growth Rate of Rare Earth Permanent Magnet in China, 2001-2014
Export Structure of China's Rare Earth Permanent Magnet (by Country/Region) ,2014
General Procedure for Settlement of WTO Disputes over Rare Earths
Average Price of Key Rare Earth Oxides in China, 2014
Dy Oxide Price in China, 2013-2015
Dy Metal Price in China, 2013-2015
Er Oxide Price in China, 2013-2015
Eu Oxide Price in China, 2013-2015
Gd Oxide Price in China, 2013-2015
Sm Oxide Price in China, 2013-2015
Tb Metal Price in China, 2013-2015
Tb Oxide Price in China, 2013-2015
Yt Metal Price in China, 2013-2015
Yt Oxide Price in China, 2013-2015
Ce Oxide Price in China, 2013-2015
Nd Oxide Price in China, 2013-2015
La Oxide in China, 2013-2015
Pr Oxide Price in China, 2013-2015
Nd Metal Price in China, 2013-2015
La Metal Price in China, 2013-2015
Pr Metal Price in China, 2013-2015
Ce Metal Price in China, 2013-2015
Application of Rare Earth Elements in Rare-earth Permanent Magnet Material
Performance Comparison between NdFeB Permanent Magnetic Material and Other Permanent Magnetic Materials
Applications of NdFeB in China
Consumption Structure of Rare Earth Permanent Magnets in China, 2014
Demand of Permanent Magnetic Materials for Rare Earth in China, 2006-2016E
Production Pattern of NdFeB in China, 2014
Capacity of Leading NdFeB Companies in China, 2014
Application of Rare Earth Elements in Rare-earth Hydrogen Storage Material
China's NI-MH Battery Consumption Structure, 2014
Demand of Hydrogen Storage Materials for Rare Earth in China, 2006-2016E
Capacity of Key Rare Earth Hydrogen Storage Material Companies in China, 2014
Application of Rare Earth Elements in Rare-earth Polishing Material
Major Applications of Rare Earth Polishing Powder in China
Demand of Polishing Materials for Rare Earth in China, 2006-2016E
Capacity of Leading Polishing Material Companies in China, 2013
Application of Rare Earth Elements in Rare-earth Luminescent Material
Applications of Rare Earth Elements in Rare-earth Luminescent Material
Output of Rare Earth Fluorescent Material in China by Region, 2014
Output of Rare Earth Fluorescent Materials in China, 2008-2016E
Capacity of Key Rare Earth Fluorescent Material Companies in China, 2014
Equity Structure of Inner Mongolia Baotou Steel Rare-Earth (Group), 2015
Revenue and Net Income of Inner Mongolia Baotou Steel Rare-Earth (Group), 2008-2015
Revenue of Inner Mongolia Baotou Steel Rare-Earth (Group) by Product, 2011-2014
Revenue of Inner Mongolia Baotou Steel Rare-Earth (Group) by Region, 2011-2014
Gross Margin of Inner Mongolia Baotou Steel Rare-Earth (Group) by Product, 2011-2014
Leading Rare Earth Products of Inner Mongolia Baotou Steel Rare-Earth (Group)
Major Product Capacity of Inner Mongolia Baotou Steel Rare-Earth (Group), 2014
Revenue and Net Income of Inner Mongolia Baotou Steel Rare-Earth (Group)’s Major Rare Earth Subsidiaries, 2014
Equity Structure of China Minmetals Rare Earth, 2015
Revenue and Net Income of China Minmetals Rare Earth, 2011-2015
Revenue of China Minmetals Rare Earth by Product, 2012-2014
Gross Margin of China Minmetals Rare Earth by Product, 2011-2014
Leading Rare Earth Product and Capacity of China Minmetals Rare Earth’s Subsidiaries
Rare Earth Output and Sales Volume of China Minmetals Rare Earth, 2011-2014
Revenue and Growth Rate of Jiangxi Tungsten Industry Group, 2009-2015
Major Rare Earth Subsidiaries of Jiangxi Tungsten Industry Group
NFC’s Equity Structure, 2015
NFC’s Revenue and Net Income, 2008-2015
NFC’s Global Layout
NFC’s Revenue by Product, 2011-2014
NFC’s Revenue by Region, 2011-2014
NFC’s Production and Sales Volume of Rare Earth Oxide, 2011-2014
Earnings of NFC’s Major Rare Earth Subsidiaries, 2014
Rising Nonferrous Metals’ Equity Structure, 2015
Revenue and Net Income of Rising Nonferrous Metals, 2008-2015
Revenue of Rising Nonferrous Metals by Product, 2010-2014
Revenue of Rising Nonferrous Metals by Region, 2010-2014
Gross Margin of Rising Nonferrous Metals by Product, 2010-2014
Rare Earth Cost Structure of Rising Nonferrous Metals, 2014
Production Scale of Rising Nonferrous Metals’ Major Rare Earth Subsidiaries
Xiamen Tungsten’s Equity Structure, 2015
Revenue and Net Income of Xiamen Tungsten, 2008-2015
Revenue Structure of Xiamen Tungsten by Product, 2013-2014
Xiamen Tungsten’s Revenue by Product, 2011-2014
Xiamen Tungsten’s Major Rare Earth Product Capacity, 2014
Xiamen Tungsten’s Sales Volume of Major Rare Earth Products, 2013-2014
Rare Earth Exploitation Control Indices of Xiamen Tungsten, 2011-2014
Hunan Rare-Earth Research Institute’s Major Rare Earth Projects
Revenue Plan of Hunan Rare-Earth Research Institute, 2010-2015
Leshan Shenghe’s Equity Structure, 2015
Revenue and Net Income of Leshan Shenghe, 2009-2015
Leshan Shenghe’s Revenue by Product, 2011-2014
Leshan Shenghe’s Revenue by Region, 2011-2014
Leshan Shenghe’s Output and Sales Volume of Main Rare Earth Products, 2013-2014
Operation of Leshan Shenghe’s Major Rare Earth Subsidiaries, 2014
China Rare Earth Holdings’ Equity Structure, 2015
Revenue and Net Income of China Rare Earth Holdings, 2008-2014
Operating Revenue of China Rare Earth Holdings by Region, 2008-2014
Rare Earth Revenue Proportion of China Rare Earth Holdings by Region, 2010-2014
Grirem Advanced Materials’ Main Products
Revenue and Growth Rate of Grirem Advanced Materials, 2009-2014
Operating Revenue of Langfang GANS Magnetic Material, 2009-2014
Rare Earth Export Quota of Grirem Advanced Materials, 2011-2014
Jiangyin Jiahua’s Rare Earth Export Quota, 2011-2014
Zibo Jiahua’s Rare Earth Export Quota, 2011-2014
Revenue and Net Income of Gan Zhou Chen Guang, 2010-2014
Rare Earth Product Export Quota of Gan Zhou Chen Guang, 2011-2014
Equity Structure of Zhong Ke San Huan, 2015
Zhong Ke San Huan’s Major Rare Earth Raw Material Manufacturers
Revenue and Net Income of Zhong Ke San Huan, 2008-2015
Revenue of Zhong Ke San Huan by Product, 2010-2014
Revenue of Zhong Ke San Huan by Region, 2010-2014
Gross Margin of Zhong Ke San Huan by Product, 2010-2014
Zhong Ke San Huan’s Major Rare Earth Permanent Magnetic Material Technological Upgrading Projects, 2014
Zhong Ke San Huan’s Major NdFeB Manufacturers
Ningbo Yunsheng’s Equity Structure, 2015
Revenue and Net Income of Ningbo Yunsheng, 2008-2015
Ningbo Yunsheng’s Revenue by Product, 2010-2014
Ningbo Yunsheng’s Revenue by Region, 2010-2014
Ningbo Yunsheng’s Gross Margin by Product, 2010-2014
Ningbo Yunsheng’s NdFeB Cost Structure, 2014
Operation of Ningbo Yunsheng’s Major Magnet Subsidiaries, 2014
Taiyuan Twin Tower’s Equity Structure, 2015
Revenue and Net Income of Taiyuan Twin Tower, 2008-2015
Revenue of Taiyuan Twin Tower by Product, 2010-2014
Gross Margin of Taiyuan Twin Tower by Product, 2008-2014
Ningbo Yunsheng’s NdFeB Capacity, 2014
Ningbo Yunsheng’s NdFeB Output and Sales Volume, 2013-2014
Jiangmen Kanhoo’s Equity Structure, 2015
Revenue and Net Income of Jiangmen Kanhoo, 2008-2015
Operating Revenue of Jiangmen Kanhoo by Product, 2009-2014
Jiangmen Kanhoo’s Revenue by Region, 2013-2014
Jiangmen Kanhoo’s Gross Margin by Product, 2009-2014
Jiangmen Kanhoo’s Rare Earth Luminescent Material Sales Volume, 2009-2014
Revenue and Growth Rate of Shannxi IRICO Fluorescent Materials, 2010-2014
China’s Rare Earth Output and Sales Volume and Growth Rate, 2009-2014
Export Volume and Value and Growth Rate of Rare Earth Products in China, 2007-2014
Revenue and Growth Rate of Major Chinese Rare Earth Enterprises, 2009-2014
Competitive Landscape of China’s Rare Earth Market, 2014
如果这份报告不能满足您的要求,我们还可以为您定制报告,请 留言说明您的详细需求。
|