|
|
|
报告导航:研究报告—
生命科学—生物科技
|
|
2014-2017年全球及中国酶制剂行业研究报告 |
 |
字数:2.9万 |
页数:88 |
图表数:89 |
|
中文电子版:7500元 |
中文纸版:3750元 |
中文(电子+纸)版:8000元 |
|
英文电子版:2000美元 |
英文纸版:2150美元 |
英文(电子+纸)版:2300美元 |
|
编号:ZLC-020
|
发布日期:2015-06 |
附件:下载 |
 |
|
|
近年全球工业酶制剂市场规模逐年增长,年均复合增长率保持在5%。2014年全球工业酶市场规模约为42.178亿美元。目前,全球工业酶市场处于寡头垄断格局。2014年,作为工业酶行业龙头的诺维信占据全球市场44%份额,杜邦和DSM所占市场份额分别为20%和6%。
从地区上来看,欧洲和北美洲对工业酶制剂的需求量最大,需求占比合计近80%,而中国的需求量占比约为9.4%。
在酶制剂需求日益增长以及利好政策等推动下,2014年中国工业酶制剂产量已达116.57万吨。未来几年,中国工业酶产量将继续保持10%左右的速度增长,预计到2017年产量将达154.87万吨。
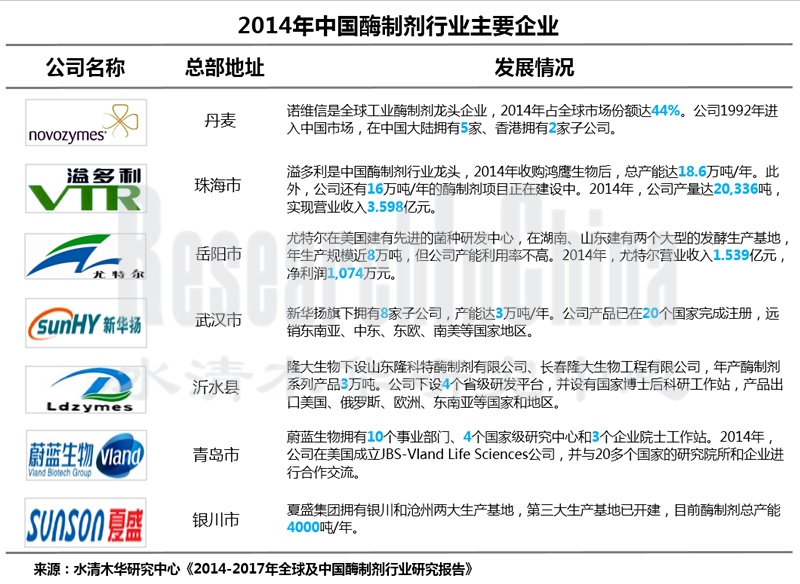
在引进国外先进设备、优良菌种、新型酶制剂的基础上,中国酶制剂工业得到迅猛发展,中国本土酶制剂企业也得到较快发展。目前,中国本土竞争实力相对较强的酶制剂生产企业包括溢多利、尤特尔、昕大洋、新华扬等。
溢多利是中国本土酶制剂龙头企业,拥有内蒙古溢多利和湖南鸿鹰生物(14年收购75%股权)两家子公司,公司产能达18.6万吨/年。2014年,其实现营业收入3.5982亿元,净利润为5513万元(不包含湖南鸿鹰生物营业收入)。目前,内蒙古溢多利的年产2万吨酶制剂项目、湖南鸿鹰生物年产14万吨酶制剂项目均已启动。
尤特尔在美国建有先进的菌种研发中心,在湖南、山东建有两个大型的发酵生产基地,年生产规模近8万吨,但公司产能利用率不高。2014年,尤特尔营业收入1.539亿元,净利润1074万元。
《2014-2017年全球及中国工业酶行业研究报告》包含以下内容:
 全球工业酶行业发展概况,包括市场规模、竞争格局、需求结构; 全球工业酶行业发展概况,包括市场规模、竞争格局、需求结构;
中国工业酶行业发展概况,包括发展历程、政策环境、发展现状、进出品以及竞争格局;
中国酶制剂行业下游行业发展概况,包括食品行业、饲料行业、酿酒行业、洗涤行业、造纸行业、纺织行业;
国外4家、中国9家工业酶主要生产企业介绍,包括公司简介、经营情况及其工业酶业务等。
In recent years, the global industrial enzyme preparation market size increased year by year, registering a CAGR of 5%, approximating USD4.2178 billion in 2014. At present, the global industrial enzyme market is basically an oligopoly. In 2014, Novozymes, an industrial enzyme giant, accounted for a 44% market share while that for Dupont and DSM was 20% and 6%, respectively.
Regionally, Europe and North America have the largest demand for industrial enzyme, occupying nearly 80% in sharp contrast to some 9.4% in China.
Stimulated by the growing demand for enzyme preparations and favorable policies, China's industrial enzyme preparation output reached 1.1657 million tons in 2014. For years to come, industrial enzyme output will keep 10% growth rate, to 1.5487 million tons by 2017.
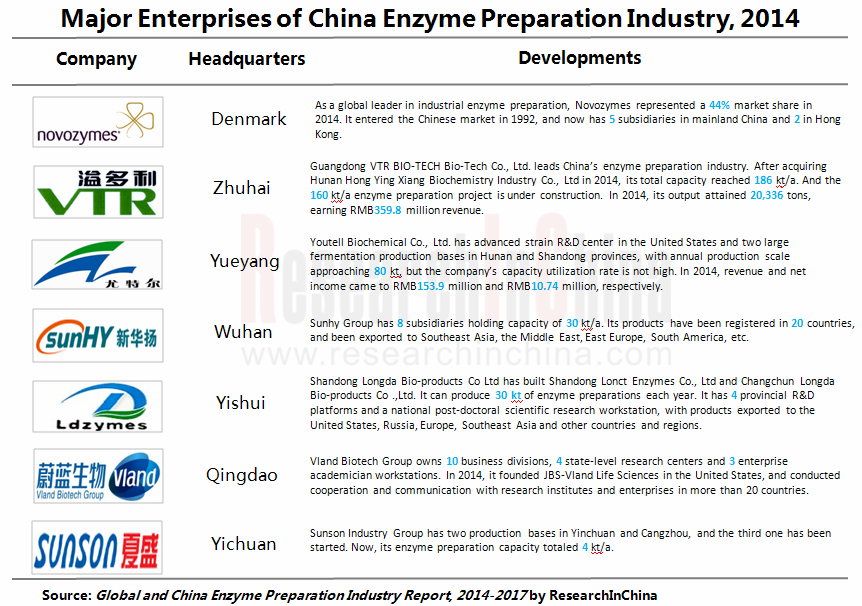
By introducing foreign advanced equipment, excellent strains, and new-type enzyme preparations, China has scored rapid development of enzyme preparation industry, especially the Chinese enzyme preparation enterprises. Currently, the enterprises with strong competitive power in China include VTR Bio-Tech, Youtell Biochemical, Smistyle, SunHY, etc.
As an enzyme preparation leader in China, VTR Bio-Tech has two subsidiaries: VTR Bio-Tech (Inner Mongolia) and Hunan Hong Ying Xiang Biochemistry (acquiring a 75% stake in 2014), with an annual capacity of 186,000 tons. In 2014, the company recorded revenue of RMB359.82 million and net income of RMB55.13 million (excluding that of Hunan Hong Ying Xiang). At present, VTR Bio-Tech (Inner Mongolia)’s 20,000 tons/a enzyme preparation project and Hunan Hong Ying Xiang’s 140,000 tons/a enzyme preparation project have been jumpstarted.
Youtell boasts advanced R&D center in the United States and two large fermentation production bases in Hunan and Shandong, with the annual production scale approaching 80,000 tons but lower capacity utilization. In 2014, the company posted RMB153.9 million in revenue and RMB10.74 million in net income.
Global and China Enzyme Preparation Industry, 2014-2017 is all about the following:
 Development of global industrial enzyme industry, including market size, competition pattern, and demand structure; Development of global industrial enzyme industry, including market size, competition pattern, and demand structure;
Development of China’s industrial enzyme industry, including development history, policy environment, development status, import and export, and competition pattern;
Development of downstream sectors of China’s enzyme preparation industry, including food, feedstuff, brewing, detergent, papermaking, and textile industries;
Four global and nine major Chinese industrial enzyme manufacturers, including their profile, operation, and their industrial enzyme business.
第一章 工业酶概述
第二章 全球工业酶行业发展概况
2.1 市场规模
2.2 竞争格局
2.3 需求结构
第三章 中国工业酶行业发展概况
3.1 发展历程
3.2 政策环境
3.3 发展现状
3.4 进出口
3.4.1 进口
3.4.2 出口
3.5 竞争格局
第四章 中国酶制剂行业下游行业发展概况
4.1 食品行业
4.1.1 淀粉加工
4.1.2 焙烤食品
4.1.3 调味品
4.2 饲料行业
4.3 酿酒行业
4.3.1 白酒
4.3.2 啤酒
4.3.3 葡萄酒
4.3.4 黄酒
4.4 洗涤行业
4.5 造纸行业
4.6 纺织行业
第五章 国外主要企业
5.1 诺维信
5.1.1 公司简介
5.1.2 经营情况
5.1.3 营收构成
5.1.4 毛利率
5.1.5 研发与投资
5.1.6 在华发展
5.2 英联食品
5.2.1 公司简介
5.2.2 经营情况
5.2.3 营收构成
5.2.4 毛利率
5.2.5 研发
5.2.6 酶业务
5.2.7 在华发展
5.3 DSM
5.3.1 公司简介
5.3.2 经营情况
5.3.3 营收构成
5.3.4 毛利率
5.3.5 研发与投资
5.3.6 酶业务
5.3.7 在华发展
5.4 Danisco(Genencor)
5.4.1 公司简介
5.4.2 在华发展
第六章 国内主要企业
6.1 溢多利
6.1.1 公司简介
6.1.2 经营情况
6.1.3 营收构成
6.1.4 毛利率
6.1.5 研发与投资
6.1.6 产销情况
6.1.7 主要客户
6.1.8 预测与展望
6.2 尤特尔
6.2.1 公司简介
6.2.2 经营情况
6.2.3 发展历程
6.3 挑战集团
6.3.1 公司简介
6.3.2 经营情况
6.4 昕大洋
6.4.1 公司简介
6.4.2 经营情况
6.5 隆大生物
6.5.1 公司简介
6.5.2 经营情况
6.6 蔚蓝生物
6.6.1 公司简介
6.6.2 经营情况
6.7 新华扬
6.7.1 公司简介
6.7.2 经营情况
6.7.3 研发
6.8 夏盛集团
6.8.1 公司简介
6.8.2 经营情况
6.9 森赛生物
6.9.1 公司简介
6.9.2 经营情况
第七章 预测与展望
7.1 全球工业酶市场发展预测
7.2 中国工业酶市场发展预测
1 Overview of Industrial Enzyme
2 Development of Global Industrial Enzyme Industry
2.1 Market Size
2.2 Competition Pattern
2.3 Demand Structure
3 Development of China Industrial Enzyme Industry
3.1 Development History
3.2 Policy Environment
3.3 Development Status
3.4 Import and Export
3.4.1 Import
3.4.2 Export
3.5 Competition Pattern
4 Development of Downstream Sectors of China Enzyme Preparation Industry
4.1 Food Industry
4.1.1 Starch Processing
4.1.2 Bakery Product
4.1.3 Condiments
4.2 Feedstuff Industry
4.3 Brewing Industry
4.3.1 Spirit
4.3.2 Beer
4.3.3 Wine
4.3.4 Yellow Wine
4.4 Detergent Industry
4.5 Papermaking Industry
4.6 Textile Industry
5 Major Foreign Companies
5.1 Novozymes
5.1.1 Profile
5.1.2 Operation
5.1.3 Revenue Structure
5.1.4 Gross Margin
5.1.5 R&D and Investment
5.1.6 Development in China
5.2 ABF
5.2.1 Profile
5.2.2 Operation
5.2.3 Revenue Structure
5.2.4 Gross Margin
5.2.5 R&D
5.2.6 Enzyme Business
5.2.7 Development in China
5.3 DSM
5.3.1 Profile
5.3.2 Operation
5.3.3 Revenue Structure
5.3.4 Gross Margin
5.3.5 R&D and Investment
5.3.6 Enzyme Business
5.3.7 Development in China
5.4 Danisco (Genencor)
5.4.1 Profile
5.4.2 Development in China
6 Major Domestic Companies
6.1 VTR Bio-Tech
6.1.1 Profile
6.1.2 Operation
6.1.3 Revenue Structure
6.1.4 Gross Margin
6.1.5 R&D and Investment
6.1.6 Production and Sales
6.1.7 Major Clients
6.1.8 Forecast and Outlook
6.2 Youtell Biochemical
6.2.1 Profile
6.2.2 Operation
6.2.3 Development History
6.3 Beijing Challenge Bio-technology
6.3.1 Profile
6.3.2 Operation
6.4 Smistyle
6.4.1 Profile
6.4.2 Operation
6.5 Longda Bio-products
6.5.1 Profile
6.5.2 Operation
6.6 Vland Biotech
6.6.1 Profile
6.6.2 Operation
6.7 SunHY
6.7.1 Profile
6.7.2 Operation
6.7.3 R&D
6.8 Sunson
6.8.1 Profile
6.8.2 Operation
6.9 Senzymes Biotechnology
6.9.1 Profile
6.9.2 Operation
7 Forecast and Outlook
7.1 Global Industrial Enzyme Market
7.2 China Industrial Enzyme Market
表:酶的分类(按催化反应的性质)
图:生物酶制剂生产工艺与核心技术
图:2007-2014年全球工业酶制剂市场规模及同比增长率
图:2014年全球工业酶市场份额
图:2014年全球工业酶需求占比(分地区)
表:中国工业酶制剂行业发展历程
表:中国工业酶行业相关政策
图:2006-2014年中国工业酶制剂产量及同比增速
图:2014年中国工业酶制剂产量(分产品)
图:2014年中国工业酶制剂产量占比(分产品)
图:2009-2014中国工业酶制剂进口量及同比增速
图:2009-2014年中国工业酶制剂进口额及同比增速
表:2014年中国工业酶制剂进口量前十的国家地区
图:2009-2014年中国工业酶制剂出口量及同比增速
图:2009-2014年中国工业酶制剂出口额及同比增速
表:2014年中国工业酶制剂出口量前十的国家地区
图:2009-2014年中国工业酶制剂进出口均价
图:2014年中国主要酶制剂生产企业产能
图:2009-2014年中国淀粉产量
图:2014年中国淀粉产量占比(分产品)
表:2013-2014年中国淀粉进出口情况(分产品)
图:2008-2014年中国焙烤食品企业营业收入及利润总额
图:2008-2014年中国调味品企业营业收入及利润总额
图:2009-2014年中国饲料产量及同比增长率
图:2009-2014年中国配合饲料产量及同比增长率
图:2009-2014年中国混合饲料产量及同比增长率
图:2009-2014年中国预添加剂饲料产量及同比增长率
图:2014年中国饲料添加剂产量占比(分类别)
图:2009-2014年中国白酒产量及同比增长率
图:2009-2014年中国白酒企业营业收入及利润总额
表:各种酶制品在啤酒酿造中的应用
图:2009-2014年中国啤酒产量及同比增长率
图:2009-2014年中国啤酒企业营业收入及利润总额
图:2009-2014年中国葡萄酒产量及同比增长率
图:2009-2014年中国葡萄酒企业营业收入及利润总额
图:2009-2014年中国黄酒企业营业收入及利润总额
图:2009-2014年中国合成洗衣粉产量及同比增长率
图:2009-2014年中国洗衣粉出口量及同比增长率
图:2009-2014年中国纸浆产量及同比增长率
图:2009-2014年中国纸浆进口量及同比增长率
图:2009-2014年中国布产量及同比增长率
图:2010-2014年诺维信营业收入及净利润
图:2012-2014年诺维信营业收入(分行业)
图:2012-2014年诺维信营业收入构成(分行业)
图:2013-2014年诺维信营业收入(分地区)
图:2013-2014年诺维信营业收入构成(分地区)
图:2010-2014年诺维信毛利率
图:2012-2014年诺维信研发支出及占总营收比重
表:1967-2013年诺维信并购进程与工程建设
表:诺维信在中国发展里程碑及大事记录
表:诺维信在华子公司注册资本、持股比例
图:FY2012-2014年英联食品营业收入及净利润
图:FY2012-2014年英联食品营业收入(分部门)
图:2012-2014年英联食品营业收入构成(分部门)
图:2012-2014年英联食品毛利率
图:2012-2014年英联食品研发支出及占总营收比重
图:FY2012-2014年英联食品Ingredients部门营业收入及占总营收比重
图:2010-2014年DSM营业收入及净利润
图:2013-2014年DSM营业收入(分部门)
图:2013-2014年DSM营业收入构成(分部门)
图:2010-2014年DSM营业收入(分地区)
图:2010-2014年DSM营业收入构成(分地区)
图:2010-2014年DSM毛利率
图:2010-2014年DSM研发支出及占总营收比重
图:2010-2014年DSM Nutrition业务营业收入、同比增长率及占总营收比重
表:DSM在华发展历程
图:DSM中国主要分支机构分布
图:2010-2014年DSM在华营业收入、同比增长率及占总营收比重
表:Danisco在华运营公司
图:2010-2014年溢多利营业收入及净利润
表:2010-2014年溢多利营业收入(分产品)
表:2010-2014年溢多利营业收入构成(分产品)
图:2010-2014年 溢多利营业收入(分地区)
图:2010-2014年溢多利营业收入构成(分地区)
图:2010-2014年溢多利毛利率
图:2010-2014年溢多利毛利率(分产品)
图:2010-2014年溢多利毛利率(分地区)
图:2010-2014年溢多利研发支出及占总营收比重
表:截至2014年底溢多利主要科研项目
表:2013-2014年溢多利产销情况(分产品)
图:2010-2014年溢多利前五名客户营业收入及占总营收比重
图:2013-2017E溢多利营业收入及净利润预测
图:2010-2014年尤特尔营业收入及净利润
图:2010-2014年尤特尔总资产、净资产及资产负债率
表:尤特尔发展历程
表:新华扬子公司
表:新华扬主要产品线
图:2013-2017E全球工业酶制剂市场规模及同比增长率
图:2013-2017E中国工业酶制剂产量及同比增速
Classification of Enzyme (by Nature of Catalytic Reaction)
Biological Enzyme Preparation Production Technology and Core Technology
Global Industrial Enzyme Preparation Market Size and YoY Growth Rate, 2007-2014
Global Industrial Enzyme Market Share, 2014
Global Industrial Enzyme Demand Structure (by Region), 2014
Development History of China’s Industrial Enzyme Preparation Industry
Policies on China’s Industrial Enzyme Preparation Industry
China’s Industrial Enzyme Preparation Output and YoY Growth, 2006-2014
China’s Industrial Enzyme Preparation Output (by Product), 2014
China’s Industrial Enzyme Preparation Output Percentage (by Product), 2014
China’s Industrial Enzyme Preparation Import Volume and YoY Growth Rate, 2009-2014
China’s Industrial Enzyme Preparation Import Value and YoY Growth Rate, 2009-2014
Top 10 Countries and Regions by Import Volume of China’s Industrial Enzyme Preparations, 2014
China's Industrial Enzyme Preparation Export Volume and YoY Growth Rate, 2009-2014
China's Industrial Enzyme Preparation Export Value and YoY Growth Rate, 2009-2014
Top 10 Countries and Regions by Export Volume of China’s Industrial Enzyme Preparations, 2014
Average Price of China's Industrial Enzyme Preparation Import and Export, 2009-2014
Capacity of Major Enzyme Preparation Manufacturers in China, 2014
China's Starch Output, 2009-2014
China’s Starch Output Percentage by Product, 2014
China’s Starch Import and Export by Product, 2013-2014
Revenue and Total Profit of Chinese Bakery Enterprises, 2008-2014
Revenue and Total Profit of Chinese Condiment Enterprises, 2008-2014
China's Feedstuff Output and YoY Growth Rate, 2009-2014
China’s Mixed Feed Output and YoY Growth Rate, 2009-2014
China’s Premix Feedstuff Output and YoY Growth Rate, 2009-2014
China's Additive Premix Feedstuff Output and YoY Growth Rate, 2009-2014
China’s Feedstuff additive Output Percentage by Category, 2014
China's Spirit Output and YoY Growth Rate, 2009-2014
Revenue and Total Profit of Chinese Spirit Companies, 2009-2014
Application of Various Enzyme Products in Beer Brewing
China's Beer Output and YoY Growth Rate, 2009-2014
Revenue and Total Profit of Chinese Beer Enterprises, 2009-2014
China's Wine Output and YoY Growth, 2009-2014
Revenue and Total Profit of Chinese Wine Enterprises, 2009-2014
Revenue and Total Profit of Chinese Yellow Wine Enterprises, 2009-2014
China's Synthetic Detergent Output and YoY Growth, 2009-2014
China's Detergent Export Volume and YoY Growth, 2009-2014
China's Pulp Output and YoY Growth, 2009-2014
China's Pulp Import Volume and YoY Growth, 2009-2014
China's Fabric Output and YoY Growth, 2009-2014
Novozymes’ Revenue and Net Income, 2010-2014
Novozymes’ Revenue Breakdown by Sector, 2012-2014
Novozymes’ Revenue Structure by Sector, 2012-2014
Novozymes’ Revenue Breakdown by Region, 2013-2014
Novozymes’ Revenue Structure by Region, 2013-2014
Novozymes’ Gross Margin, 2010-2014
Novozymes’ R&D Costs and % of Total Revenue, 2012-2014
Novozymes’ M&A Progress and Engineering Construction, 1967-2013
Novozymes’ Milestones in China and Big Events
Registered Capital and Shareholding Ratio of Novozymes’ Subsidiaries in China
ABF’s Revenue and Net Income, FY2012-FY2014
ABF’s Revenue Breakdown by Segment, FY2012-FY2014
ABF’s Revenue Structure by Segment, 2012-2014
ABF’s Gross Margin, 2012-2014
ABF’s R&D Costs and % of Total Revenue, 2012-2014
ABF’s Ingredient Revenue and % of Total Revenue, FY2012-FY2014
DSM’s Revenue and Net Income, 2010-2014
DSM’s Revenue Breakdown by Segment, 2013-2014
DSM’s Revenue Structure by Segment, 2013-2014
DSM’s Revenue Breakdown by Region, 2010-2014
DSM’s Revenue Structure by Region, 2010-2014
DSM’s Gross Margin’s 2010-2014
DSM’s R&D Costs and % of Total Revenue, 2010-2014
DSM’s Nutrition Revenue, YoY Growth, and % of Total Revenue, 2010-2014
DSM’s Development in China
DSM’s Major Arms in China
DSM’s Revenue, YoY Growth, and % of Total Revenue in China, 2010-2014
Danisco’s Operating Companies in China
VTR Bio-Tech’s Revenue and Net Income, 2010-2014
VTR Bio-Tech’s Revenue Breakdown by Product, 2010-2014
VTR Bio-Tech’s Revenue Structure by Product, 2010-2014
VTR Bio-Tech’s Revenue Breakdown by Region, 2010-2014
VTR Bio-Tech’s Revenue Structure by Region, 2010-2014
VTR Bio-Tech’s Gross Margin of VTR Bio-Tech, 2010-2014
VTR Bio-Tech’s Gross Margin by Product, 2010-2014
VTR Bio-Tech’s Gross Margin by Region, 2010-2014
VTR Bio-Tech’s R&D Costs and % of Total Revenue, 2010-2014
Major Research Projects of VTR Bio-Tech as of the End of 2014
VTR Bio-Tech’s Production and Sales by Product, 2013-2014
VTR Bio-Tech’s Revenue from Top 5 Clients and % of Total Revenue, 2010-2014
VTR Bio-Tech’s Revenue and Net Income, 2013-2017E
Youtell's Revenue and Net Income, 2010-2014
Youtell's Total Assets, Net Assets, and Asset-liability Ratio, 2010-2014
Youtell's Development History
SunHY's Subsidiaries
SunHY's Main Product Lines
Global Industrial Enzyme Preparation Market Size and YoY Growth, 2013-2017E
China's Industrial Enzyme Preparation Output and YoY Growth, 2013-2017E
如果这份报告不能满足您的要求,我们还可以为您定制报告,请 留言说明您的详细需求。
|