|
|
|
报告导航:研究报告—
制造业—工业机械
|
|
2015全球及中国电梯行业研究报告 |
 |
字数:5.3万 |
页数:176 |
图表数:191 |
|
中文电子版:8500元 |
中文纸版:4250元 |
中文(电子+纸)版:9000元 |
|
英文电子版:2500美元 |
英文纸版:2700美元 |
英文(电子+纸)版:2800美元 |
|
编号:LMX067
|
发布日期:2015-06 |
附件:下载 |
 |
|
|
2014年以来,中国电梯市场主要呈现以下几个发展特征:
- 新梯市场依然呈增量不减,增幅回落趋势。2014年,中国电梯总产量突破70万台,同比增长约12%(2013年增速为18%)。尽管国家房地产宏观调控对电梯市场有一定的影响,但新型城镇化政策的实施、保障性住房的建设以及全国大中型城市公共交通的快速发展,在一定程度上延缓了商品房电梯产销量的下滑。
- 随着民族电梯企业加快维保业务布局,维保收入占比不断提升。目前国内电梯行业的竞争从单纯的技术、销售,向网络及后续服务转变。从企业2014年维保收入占营业收入的比重来看,博林特维保收入占比最高,达到20.1%,公司2010年维保收入占比仅为9.1%;康力电梯维保收入占比从2010年的3.7%提升至2014年的8.5%,截止2014年末,公司已经成立32家分公司,其中22家已经取得安装维保资质。
- 电梯出口量不断增长,未来民族电梯企业将受益于“一带一路”战略,出口规模不断扩大。2014 年,中国电梯及扶梯出口6.89 万台,2007-2014 年出口数量年均复合增长率达到13.1%。2015年第一季度,中国电梯及扶梯出口量16793台,同比增长12.91%。
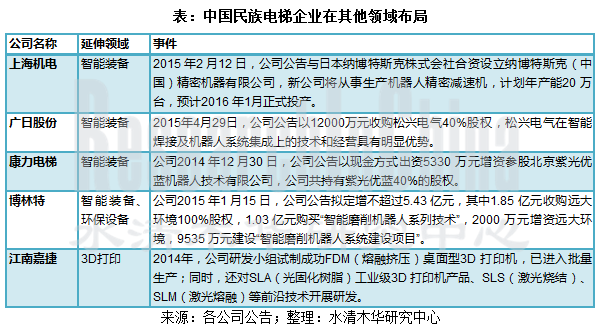
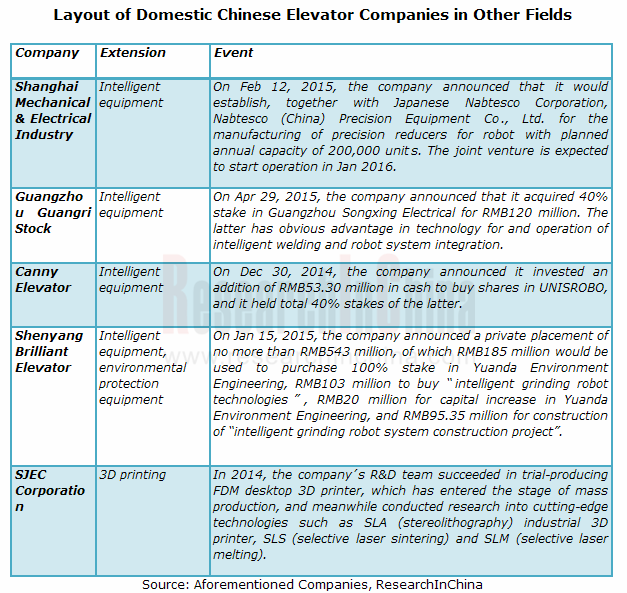
- 2014年以来,国内电梯企业在不断夯实主业的基础上,纷纷向机器人/智能装备/工业4.0等领域延伸。
《2015年全球及中国电梯行业研究报告》主要涉及以下内容:
 全球电梯行业市场规模、新梯销量、维保市场分析、企业竞争格局及发展模式; 全球电梯行业市场规模、新梯销量、维保市场分析、企业竞争格局及发展模式;
中国电梯行业竞争格局,主要包括外资品牌在华布局以及内外资品牌竞争分析;
中国电梯行业供应结构、新梯产量及维保市场分析;
中国电梯行业需求结构、需求分析以及主要影响因素分析;
中国电梯进出口金额,数量以及价格分析;
全球7家以及中国8家主要电梯制造企业分析,包括产品产销量、经营状况、主要项目、订单情况等;
中国电梯行业未来发展趋势、产量及出口量预测。
The Chinese elevator market has been characterized by the followings since 2014:
- New elevator output sustained growth momentum but at a slower pace. In 2014, China’s elevator output exceeded 700,000 sets, up about 12% from a year ago, compared with a year-on-year growth rate of 18% in 2013. In spite of some impact on elevator market caused by the country’s macro-control on real property, the implementation of new-style urbanization policies, large-scale construction of indemnificatory housing and rapid development of public transportation in medium and large cities in China slowed the decline of elevator sales in commercial housing market to a certain extent.
- As domestic elevator companies accelerated their presence in service (repair & maintenance) business, the share of service revenue continued to rise. Competition in domestic elevator industry isnow shifting from technology and sales to network and follow-up services. This can be confirmed by elevator companies’ proportion of service revenue. Shenyang Brilliant Elevator finds the highest share, reaching 20.1% in 2014 compared with merely 9.1% in 2010; Canny Elevator raised the proportion from 3.7% in 2010 to 8.5% in 2014, and had established 32 branch companies by the end of 2014, 22 of which had obtained the qualification for elevator service.
- Elevator exports increased continuously. Domestic elevator companies will benefit from the strategy of “One Belt and One Road”, further expanding export scale. China’s export of elevators and escalators amounted to 68,900 sets in 2014, presenting a CAGR of 13.1% during 2007-2014. The figures for the first quarter of 2015 were 16,793 sets, up 12.91% from a year ago.
- Since 2014, while consolidating their primary businesses, Chinese elevator companies have been extending to robot/intelligent equipment/industry 4.0 fields.
Global and China Elevator Industry Report, 2015 highlights the followings:
Market size, new elevator sales volume, service market, competitive landscape and development mode of global elevator industry;
Competitive landscape of China elevator industry, including business layout of foreign brands in China and competition between foreign and domestic brands;
Supply structure, new elevator output and service market of China elevator industry;
Demand structure, demand and main influencing factors of China elevator industry;
Value, volume and prices of imported and exported elevators in China;
Product output and sales volume, operation, main projects and orders of 7 global and 8 Chinese elevator manufacturers;
Development trend, output and export volume forecast of China elevator industry.
前言
第一章 电梯行业概述
1.1 电梯概述
1.2 政策环境
第二章 全球电梯行业发展状况
2.1 行业规模
2.2 新梯市场
2.3 维保市场
2.4 竞争格局
2.5 发展模式
2.5.1 两种模式
2.5.2 发展亚太区业务
2.5.3 全球化扩张
2.6 发展预测
第三章 中国电梯行业竞争格局
3.1 外资品牌在华发展
3.2 市场竞争
3.2.1 企业数量
3.2.2 内外资品牌竞争
3.2.3 外资品牌竞争
3.2.4 内资品牌竞争
3.3 企业发展
3.3.1 发展模式
3.3.2 盈利状况
3.3.3 企业加快转型机器人/智能装备/工业4.0
第四章 中国电梯行业供应状况
4.1 产品结构
4.2 行业规模
4.3 新梯市场
4.4 维保市场
4.4.1 发展现状
4.4.2 市场规模
4.4.3 主要企业维保市场布局
第五章 中国电梯行业需求状况
5.1 下游需求结构
5.2 需求构成
5.3 销量
5.4 影响因素分析
5.4.1 房地产行业
5.4.2 城镇化和老龄化
5.4.3 旧梯更新改造
5.5 政府采购
第六章 中国电梯行业进出口状况
6.1 进出口量
6.2 进出口金额
6.3 进出口价格
6.3.1 载客电梯
6.3.2 自动扶梯及自动人行道
第七章 全球重点企业分析
7.1 Otis
7.1.1 公司简介
7.1.2 经营状况
7.1.3 订单情况
7.1.4 在华发展
7.1.5 在华订单
7.1.6 西子奥的斯
7.2 Hitachi
7.2.1 公司简介
7.2.2 经营状况
7.2.3 电梯业务
7.2.4 在华电梯业务
7.2.5 在华电梯订单
7.3 KONE
7.3.1 公司简介
7.3.2 经营状况
7.3.3 营收构成
7.3.4 业绩预测
7.3.5 在华发展
7.3.6 在华电梯订单
7.3.7 巨人通力(GiantKONE)
7.4 Schindler
7.4.1 公司简介
7.4.2 发展历程
7.4.3 经营状况
7.4.4 迅达中国
7.4.5 在华订单
7.4.6 西继迅达
7.5 Thyssen Krupp
7.5.1 公司简介
7.5.2 电梯业务
7.5.3 在华发展
7.5.4 在华主要订单
7.6 Toshiba
7.6.1 公司简介
7.6.2 经营状况
7.6.3 电梯业务
7.6.4 业绩预测
7.6.5 在华电梯业务
7.7 Fujitec
7.7.1 公司简介
7.7.2 发展历程
7.7.3 经营状况
7.7.4 在华发展
7.7.5 在华订单
7.7.6 Mid-Term Management Plan
第八章 中国重点企业分析
8.1 上海三菱电梯
8.1.1 公司简介
8.1.2 电梯产销量
8.1.3 经营状况
8.1.4 订单情况
8.1.5 主要项目
8.1.6 上海机电国企改革
8.1.7 布局智能装备领域
8.1.8 业绩预测
8.2 广日股份
8.2.1 公司简介
8.2.2 经营状况
8.2.3 营收构成
8.2.4 毛利率
8.2.5 竞争优势
8.2.6 主要子公司、参股公司
8.2.7 电梯业务分析
8.2.8 收购松兴电气40%股权
8.2.9 产业链布局
8.2.10 业绩预测
8.3 康力电梯
8.3.1 公司简介
8.3.2 电梯产销量
8.3.3 经营状况
8.3.4 营收构成
8.3.5 毛利率分析
8.3.6 研发及投资
8.3.7 电梯订单
8.3.8 营销模式
8.3.9 进军服务机器人业务
8.3.10 业绩预测
8.4 江南嘉捷
8.4.1 公司简介
8.4.2 电梯产销量
8.4.3 经营状况
8.4.4 营收构成
8.4.5 毛利率分析
8.4.6 研发及投资
8.4.7 电梯订单
8.4.8 发展规划
8.4.9 业绩预测
8.5 博林特
8.5.1 公司简介
8.5.2 电梯产销量
8.5.3 经营状况
8.5.4 营收构成
8.5.5 毛利率分析
8.5.6 研发及投资
8.5.7 竞争优势
8.5.8 转型高端智能装备
8.5.9 业绩预测
8.6 申龙电梯
8.6.1 公司简介
8.6.2 电梯产销量
8.6.3 经营状况
8.6.4 营收构成
8.6.5 毛利率分析
8.6.6 客户与供应商分析
8.6.7 电梯订单
8.6.8 研发与投资
8.6.9 优劣势分析
8.6.10 发展目标
8.7 东南电梯
8.7.1 公司简介
8.7.2 公司合作
8.8 杭州新马电梯
第九章 中国电梯市场总结与发展预测
9.1 市场总结
9.2 发展预测
9.2.1 趋势预测
9.2.2 产量预测
9.2.3 出口量预测
Preface
1 Overview of Elevator Industry
1.1 Overview
1.2 Policy Environment
2 Development of Global Elevator Industry
2.1 Industry Scale
2.2 New Elevator Market
2.3 Service Market
2.4 Competitive Landscape
2.5 Development Mode
2.5.1 Two Modes
2.5.2 Business Development in Asia Pacific
2.5.3 Global Expansion
2.6 Development Forecast
3 Competitive Landscape of China Elevator Industry
3.1 Development of Foreign Elevator Brands in China
3.2 Market Competition
3.2.1 Number of Enterprises
3.2.2 Competition between Foreign and Domestic Brands
3.2.3 Competition among Foreign Brands
3.2.4 Competition among Domestic Brands
3.3 Development of Enterprise
3.3.1 Development Mode
3.3.2 Profitability
3.3.3 Accelerating Transformation to Robot/Intelligent Equipment/Industry 4.0
4 Supply of China Elevator Industry
4.1 Product Structure
4.2 Industry Scale
4.3 New Elevator Market
4.4 Service Market
4.4.1 Development Status
4.4.2 Market Scale
4.4.3 Layout of Major Enterprises in Service Market
5 Demand of China Elevator Industry
5.1 Downstream Demand Structure
5.2 Demand Composition
5.3 Sales Volume
5.4 Influencing Factors
5.4.1 Real Estate Sector
5.4.2 Urbanization and Aging Population
5.4.3 Renewal and Upgrading of Old Elevators
5.5 Government Procurement
6 Import and Export of China Elevator Industry
6.1 Import and Export Volume
6.2 Import and Export Value
6.3 Import and Export Price
6.3.1 Passenger Elevator
6.3.2 Escalator and Moving Sidewalk
7. Key Elevator Companies Worldwide
7.1 Otis
7.1.1 Profile
7.1.2 Operation
7.1.3 Orders
7.1.4 Development in China
7.1.5 Orders in China
7.1.6 Xizi Otis
7.2 Hitachi
7.2.1 Profile
7.2.2 Operation
7.2.3 Elevator Business
7.2.4 Elevator Business in China
7.2.5 Elevator Orders in China
7.3 KONE
7.3.1 Profile
7.3.2 Operation
7.3.3 Revenue Structure
7.3.4 Performance Forecast
7.3.5 Development in China
7.3.6 Elevator Orders in China
7.3.7 GiantKONE
7.4 Schindler
7.4.1 Profile
7.4.2 Development History
7.4.3 Operation
7.4.4 Schindler in Chin
7.4.5 Orders in China
7.4.6 XJ Schindler
7.5 Thyssen Krupp
7.5.1 Profile
7.5.2 Elevator Business
7.5.3 Development in China
7.5.4 Orders in China
7.6 Toshiba
7.6.1 Profile
7.6.2 Operation
7.6.3 Elevator Business
7.6.4 Performance Forecast
7.6.5 Elevator Business in China
7.7 Fujitec
7.7.1 Profile
7.7.2 Development History
7.7.3 Operation
7.7.4 Development in China
7.7.5 Orders in China
7.7.6 Mid-Term Management Plan
8 Key Elevator Companies in China
8.1 Shanghai Mitsubishi Elevator Co., Ltd
8.1.1 Profile
8.1.2 Output and Sales Volume
8.1.3 Operation
8.1.4 Orders
8.1.5 Projects
8.1.6 SOE Reform
8.1.7 Layout in Intelligent Equipment
8.1.8 Performance Forecast
8.2 Guangzhou Guangri Stock Co., Ltd.
8.2.1 Profile
8.2.2 Operation
8.2.3 Revenue Structure
8.2.4 Gross Margin
8.2.5 Competitive Advantage
8.2.6 Subsidiaries and Joint-stock Companies
8.2.7 Elevator Business
8.2.8 Acquisition of 40% Stake in Guangzhou Songxing Electrical Co., Ltd.
8.2.9 Industrial Chain Layout
8.2.10 Performance Forecast
8.3 Canny Elevator Co., Ltd.
8.3.1 Profile
8.3.2 Output and Sales Volume
8.3.3 Operation
8.3.4 Revenue Structure
8.3.5 Gross Margin
8.3.6 R&D and Investment
8.3.7 Orders for Elevator
8.3.8 Marketing Mode
8.3.9 Marching into Service Robot Business
8.3.10 Performance Forecast
8.4 SJEC Corporation
8.4.1 Profile
8.4.2 Output and Sales Volume
8.4.3 Operation
8.4.4 Revenue Structure
8.4.5 Gross Margin
8.4.6 R&D and Investment
8.4.7 Orders for Elevator
8.4.8 Development Plan
8.4.9 Performance Forecast
8.5 Shenyang Brilliant Elevator Co., Ltd.
8.5.1 Profile
8.5.2 Output and Sales Volume
8.5.3 Operation
8.5.4 Revenue Structure
8.5.5 Gross Margin
8.5.6 R&D and Investment
8.5.7 Competitive Advantage
8.5.8 Transformation to High-end Intelligent Equipment
8.5.9 Performance Forecast
8.6 Shenlong Elevator Co., Ltd.
8.6.1 Profile
8.6.2 Output and Sales Volume
8.6.3 Operation
8.6.4 Revenue Structure
8.6.5 Gross Margin
8.6.6 Clients and Suppliers
8.6.7 Orders for Elevator
8.6.8 R&D and Investment
8.6.9 Strengths and Weaknesses
8.6.10 Development Goal
8.7 Dongnan Elevator Co., Ltd.
8.7.1 Profile
8.7.2 Cooperation
8.8 Hangzhou Xinma Elevator Co., Ltd
9 Summary and Development Forecast of Chinese Elevator Market
9.1 Summary
9.2 Development Forecast
9.2.1 Trend
9.2.2 Output
9.2.3 Exports
表:电梯产品分类
表:电梯主要组成部件
表:中国电梯行业相关法律法规
表:中国电梯行业相关政策
表:中国市场主要电梯企业试验塔投资项目
图:2014年全球电梯行业市场规模构成
图:2010-2014年全球电梯销售量
图:2010-2014年全球电梯销售量(分区域)
图:2005-2015年通力电梯维保收入占比
图:2013-2014年全球电梯在用量
图:2014年全球电梯市场份额
图:1986-2014年通力集团营业收入及同比增速
图:1987-2014年迅达集团营业收入及同比增长
图:2008-2014年全球主要电梯公司海外收入占比
图:2014-2015年通力在中国地区收入占公司总收入的比重
表:通力集团并购案例及影响
表:迅达集团并购案例
图:2015年全球电梯销量预测
图:2004-2020年金砖四国与其他国家电梯新机销量及预测
表:八大外资品牌电梯在中国布局情况
图:2012-2015年中国电梯、自动扶梯及升降机制造企业单位数
图:2014年中国电梯市场内外资品牌市场份额
图:2014年中国电梯市场竞争格局
表:中国民族电梯企业与国际电梯巨头在高速电梯领域的布局对比
图:2014年中国外资品牌市场份额构成
表:2011-2014年国外电梯企业在华布局
图:2013年中国本土电梯品牌市场份额构成
表:2014-2015年中国主要电梯上市公司营业收入及同比增速
表:2014-2015年中国主要电梯上市公司净利润入及同比增速
表:2014年中国主要电梯上市公司维保收入及维保业务毛利率
表:中国民族电梯企业转型情况
图:电梯产品结构
图:2005-2014年中国中低速电梯产品市场份额
图:2012-2015年中国电梯、自动扶梯及升降机制造行业主营业务收入和利润总额
图:1983-2014年中国电梯产量及同比增长
图:2014年主要电梯上市公司电梯产量及销量对比
图:中国电梯维保市场份额(2014年)
图:2010-2014年中国主要本土电梯品牌企业维保收入占各自营业收入的比重
图:全球主要国家(城市)人均电梯保有量
图:2000-2014年中国电梯保有量
表:2014-2017年中国电梯维保市场容量预测
图:电梯下游需求结构
图:电梯需求市场组成
表:电梯需求细分市场影响因素
图:2014年全球及中国电梯需求构成
图:1999-2013年中国电梯销量
图:1997-2015年中国房地产投资额及同比增长
图:2001-2014年中国房屋新开工面积与电梯行业同比增速
图:2000-2014年中国电梯配置密度
图:1970-2014年中国城镇化率(%)
表:新型城镇化下的电梯需求特点
图:2002-2014年中国65岁及以上人口所占比例
图:2010-2024年中国电梯更新改造需求量
图:2010-2014年中国电梯项目政府采购金额
图:2007-2015年中国电梯及扶梯进出口量
图:2007-2015年中国电梯及扶梯进出口额
表:2010-2014年中国载客电梯进出口均价
表:2010-2014年中国自动扶梯及自动人行道进出口均价
图:奥的斯介绍
图:奥的斯全球业务分布
图:奥的斯电梯产品发展历程
图:2011-2015年奥的斯主要财务指标
表:奥的斯全球主要订单
表:奥的斯中国扩张过程
表:2009-2015年奥的斯在华主要电梯订单
图:西子奥的斯营销网络
表:2011-2015年西子奥的斯主要电梯订单
图:2009-2013财年日立集团主要财务指标
图:2014财年日立集团主要财务指标
图:2013-2014财年日立集团营业收入和营业利润(分业务)构成
图:2009-2013财年日立集团营业收入(分区域)构成
图:2014财年日立集团营业收入(分区域)构成
图:2014年财年日立集团Social Infrastructure & Industrial Systems业务营业收入和营业利润
图:日立集团电梯业务发展历程
表:2014-2015年日立电梯主要订单
图:日立电梯(中国)有限公司股权结构
表:日立中国主要电梯制造基地
图:2011-2014年日立电梯(中国)有限公司营业收入与净利润
表:日立在华主要电梯订单
图:通力电梯全球业务分布
图:2014-2015年通力电梯主要财务指标
图:2015年第一季度通力营业收入构成
图:2005-2014年通力营业收入(分区域)构成
图:2005-2014年通力营业收入(分业务)构成
图:2015年通力电梯主营业务预测
图:通力在华主要公司
表:通力集团中国发展历程
图:通力集团在华业务分布
图:通力集团与巨人通力电梯产品结构
图:2014-2015年通力中国财务数据
表:2014-2015年通力电梯在华订单
表:巨人通力发展历程
图:迅达集团发展历程
图:2014-2015年迅达集团主要财务指标
图:2010-2014年迅达集团主要财务指标
图:2005-2014年迅达集团营业收入与未交付订单(分地区)构成
图:迅达在华业务分布
表:迅达中国发展历程
图:2014年迅达在华主要电梯订单
表:2010-2013年西继迅达主要营业指标
图:2014-2015财年蒂森主要营业指标
图:2014-2015财年蒂森主要营业指标(分业务)
图:2007-2015财年蒂森电梯业务销售收入
图:2014-2015财年蒂森电梯业务主要财务数据
图:蒂森在华业务分布
表:蒂森电梯中国发展历程
图:蒂森在中国和印度运营的电梯品牌
表:蒂森在华主要电梯订单
图:2013-2014财年东芝主要财务指标
图:2013-2014财年东芝营业收入和营业利润(分业务)构成
图:2014财年前三季度东芝营业收入(分区域)构成
表:东芝电梯业务发展历程
图:2012-2014财年东芝Community Solutions业务营业收入与营业利润
图:2013-2016财年东芝业绩预测
图:东芝在华电梯业务分布
图:富士达全球业务分布
图:富士达发展历程
图:2009-2014财年富士达主要财务指标
图:2009-2013财年富士达东亚地区主要运营指标
图:富士达在华布局
表:富士达中国电梯生产基地
图:2010-2013财年华升富士达电梯有限公司营业收入占富士达总营业收入的比重
图:富士达中国主要销售网络
图:富士达在华主要订单(截止2014年3月31日)
表:富士达电梯中标北京地铁项目情况
图:富士达2015财年主要财务指标修正
图:2002-2013年上海三菱电梯销量
图:1987-2014年上海三菱电梯累计销售台数
图:2009-2014年上海三菱电梯营业收入与净利润
图:2012-2014年上海三菱电梯安装维保业务收入及其占营业收入的比重
图:2008-2014年上海三菱电梯及自动扶梯产品毛利率
表:上海三菱电梯典型项目应用
表:上海三菱电梯主要项目
表:上海市国有企业改革的政策路径
表:2015-2018年上海三菱电梯营业收入与净利润预测
图:2010-2015年广日股份营业收入与净利润
表:2013-2014年广日股份主营业务收入(分业务)构成
表:2013-2014年广日股份主营业务(分区域)构成
表:2013-2014年广日股份毛利率
表:2014年广日股份主要子公司、参股公司经营指标
表:广日股份工业4.0智能平台布局
图:广日股份产业链布局
表:2015-2018年广日股份营业收入与净利润预测
表:2011-2014年康力电梯电梯产品产量、销量及库存量
图:2009-2015年康力电梯营业收入与净利润
图:2010-2014年康力电梯营业收入(分产品)构成
图:2010-2014年康力电梯营业收入(分区域)构成
表:2008-2014年康力电梯毛利率(单位:%)
表:2009-2014年康力电梯研发投入及占比
表:2006-2015年康力电梯主要电梯订单
表:2013-2014年康力电梯海外大额中标项目
图:2013-2014年康力优蓝主要财务数据
表:2015-2018年康力电梯营业收入与净利润预测
表:2012-2014年江南嘉捷电梯产品产量、销量及库存量
图:2009-2015年江南嘉捷营业收入与净利润
图:2010-2014年江南嘉捷营业收入(分业务)构成
图:2009-2014年江南嘉捷营业收入(分区域)构成
表:2008-2014年江南嘉捷毛利率
表:2008-2014年江南嘉捷研发费用及占比
图:2013-2015年江南嘉捷在手订单金额
表:2015-2018年江南嘉捷营业收入与净利润预测
表:2009-2014年博林特产销及库存量
图:2009-2015年博林特营业收入与净利润
图:2009-2014年博林特营业收入(分产品)构成
图:2009-2014年博林特营业收入(分区域)构成
图:2014年博林特营业收入(分区域)构成
表:2009-2014年博林特毛利率(单位:%)
表:2009-2014年沈阳博林特研发投入及占营业收入的比例
表:中国电梯行业直销模式和经销模式对比
表:2015-2018年博林特营业收入与净利润预测
表:2011-2013年申龙电梯产品产销量
表:2011-2013年申龙电梯(分产品)销量
表:2011-2013年申龙电梯产品平均销售价格
图:2011-2013年申龙电梯营业收入与净利润
表:2011-2013年申龙电梯主营业务收入(分产品)构成
表:2011-2013年申龙电梯营业收入(分区域)构成
表:2011-2013年申龙电梯毛利率
表:2013年申龙电梯前五名客户销售收入及占营业收入的比例
表:2013年申龙电梯前五名供应商采购额及占比
表:2013年申龙电梯主要电梯订单
表:2011-2013年申龙电梯研发投入及占营业收入的比例
表:申龙电梯募集资金项目
表:申龙电梯募投项目新增产能
表:东南电梯发展历程
表:东南电梯特种电梯产品应用案例
图:东南电梯中国市场营销网络
表:2001-2014年中国电梯产量、销量及保有量
图:全球主要国家城镇化率及人均GDP
图:2015-2018年中国电梯产量预测
图:“一带一路”版图
图:2015-2018年中国电梯及扶梯出口量预测
Classification of Elevator Products
Main Components of Elevator
Laws and Regulations on China Elevator Industry
Policies Concerning China Elevator Industry
Elevator Testing Tower Projects of Major Elevator Companies in China
Global Elevator Industry Scale Structure, 2014
Global Elevator Sales Volume, 2010-2014
Global Elevator Sales Volume (by Region), 2010-2014
Proportion of Service Sales to Total Sales of KONE, 2005-2015
Global Elevators in Operation, 2013-2014
Global Elevator Market Share, 2014
Revenue and YoY Growth of KONE, 1986-2014
Revenue and YoY Growth of Schindler, 1987-2014
Proportion of Overseas Revenue of Major Global Elevator Companies, 2008-2014
Share of Sales of KONE in China to Total Sales, 2014-2015
M&As of KONE and Their Impact
M&As of Schindler
Global Elevator Sales Volume, 2015E
Sales Volume of New Elevators in BRIC Countries and the Rest of World, 2004-2020E
Layout of Eight Foreign Elevator Brands in China
Number of Elevator, Escalator and Lift Manufacturing Enterprises in China, 2012-2015
Market Share of Foreign and Domestic Brands in Chinese Elevator Market, 2014
Competitive Landscape of Chinese Elevator Market, 2014
Comparison of Layout in High-Speed Elevator Field between Domestic Elevator Enterprises and International Elevator Giants
Market Share of Foreign Brands in China, 2014
Layout of Foreign Elevator Brands in China, 2011-2014
Market Share of Domestic Elevator Brands in China, 2013
Major Listed Chinese Elevator Companies’ Revenue and YoY Growth, 2014-2015
Major Listed Chinese Elevator Companies’ Net Income and YoY Growth, 2014-2015
Major Listed Chinese Elevator Companies’ Revenue from Service Segment and YoY Growth, 2014
Transformation of Chinese Elevator Enterprises
Elevator Product Structure
Market Share of Medium and Low Speed Elevator in China, 2005-2014
Operating Revenue and Total Profit of Elevator, Escalator and Lift Manufacturing Industry in China, 2012-2015
Elevator Output and YoY Growth Rate in China, 1983-2014
Elevator Output and Sales Volume of Major Listed Chinese Elevator Companies, 2014
Chinese Elevator Service Market Share, 2014
Service Revenue Percentage of Major Local Elevator Companies in China, 2010-2014
Per Capita Elevator Ownership in Major Countries (Cities) Worldwide
China’s Elevator Ownership, 2000-2014
China’s Elevator Service Market Capacity, 2014-2017E
Elevator Application Structure
Elevator Consumer Market Composition
Elevator Market Segments’ Driver
Consumption Structure in Global and Chinese Elevator Markets, 2014
China’s Elevator Sales Volume, 1999-2013
Real Estate Investment and YoY Growth Rate in China, 1997-2015
YoY Growth Rate of New Housing Construction Area and Elevator Output in China, 2001-2014
Disposition Density of Elevator in China, 2000-2014
Urbanization Rate in China, 1970-2014
Characteristics of Demand for Elevator under New-type Urbanization
Proportion of Population Aged 65 and above to Total Population in China, 2002-2014
Elevator Renovation and Transformation Demand in China, 2010-2024E
Government Procurement Amount for Elevator in China, 2010-2014
Import and Export Volume of Elevator and Escalator in China, 2007-2015
Import and Export Value of Elevator and Escalator in China, 2007-2015
Average Import/Export Price of Passenger Elevator in China, 2010-2014
Average Import/Export Price of Escalator and Moving Sidewalk in China, 2010-2014
Introduction of Otis
Global Business Distribution of Otis
Development History of Otis’ Elevators
Key Financial Indexes of Otis, 2011-2015
Main Orders of Otis Worldwide
Expansion of Otis in China
Main Elevator Orders of Otis in China, 2009-2015
Marketing Network of Xizi Otis
Main Elevator Orders of Xizi Otis, 2011-2015
Key Financial Indexes of Hitachi, FY2009-FY2013
Key Financial Indexes of Hitachi, FY2014
Revenue and Operating Income Structure of Hitachi (by Business), FY2013-FY2014
Revenue Structure of Hitachi (by Region), FY2009-FY2013
Revenue Structure of Hitachi (by Region), FY2014
Revenue and Operating Income of Hitachi’s Social Infrastructure & Industrial Systems Business, FY2014
Development History of Elevator Business of Hitachi
Major Elevator Orders of Hitachi, 2014-2015
Equity Structure of Hitachi Elevator (China)
Major Elevator Production Bases of Hitachi China
Revenue and Net Income Breakdown of Hitachi Elevator (China), 2011-2014
Main Elevator Orders of Hitachi in China
Global Operations of KONE
Key Financial Indexes of KONE, 2014-2015
Revenue Structure of KONE, 2015Q1
Revenue Structure of KONE (by Region), 2005-2014
Revenue Structure of KONE (by Business), 2005-2014
Operating Business Forecast of KONE, 2015
Subsidiaries of Kone in China
Development History of KONE in China
Business Distribution of KONE in China
Product Structure of KONE and GiantKONE
Financial Data of KONE in China, 2014-2015
Elevator Orders of Kone in China, 2014-2015
Development History of GiantKONE
Development History of Schindler
Key Financial Indexes of Schindler, 2014-2015
Key Financial Indexes of Schindler, 2010-2014
Revenue and Order Backlog of Schindler (by Region), 2005-2014
Business Distribution of Schindler in China
Development History of Schindler in China
Elevator Orders of Schindler in China, 2014
Main Business Indicators of XJ Schindler, 2010-2013
Main Business Indicators of ThyssenKrupp, FY2014-FY2015
Business Indicators of ThyssenKrupp (by Business), FY2014-FY2015
Elevator Sales of ThyssenKrupp, FY2007-FY2015
Key Financial Data on Elevator Business of ThyssenKrupp, FY2014-FY2015
Business Distribution of ThyssenKrupp in China
Development History of ThyssenKrupp Elevator (China)
Elevator Brands of ThyssenKrupp Operated in India and China
Major Elevator Orders of ThyssenKrupp in China
Main Financial Indexes of Toshiba, FY 2013-FY 2014
Net Sales and Operating Income Structure of Toshiba (by Business), FY2013-FY2014
Net Sales Structure of Toshiba (by Region), FY2014Q1-Q3
Development History of Toshiba’s Elevator Business
Net Sales and Operating Income of Toshiba’s Community Solutions Business, FY2012-FY2014
Performance Forecast of Toshiba, FY2013-FY2016
Elevator Business of Toshiba in China
Global Business Distribution of Fujitec
Development History of Fujitec
Key Financial Indexes of Fujitec, FY2009-FY2014
Key Operating Indexes of Fujitec in East Asia, FY2009-FY2013
Layout of Fujitec in China
Production Bases of Fujitec Elevator (China)
Huasheng Fujitec Elevator’s Share of Fujitec’s Total Net Sales, FY2010-FY2013
Marketing Network of Fujitec in China
Main Orders of Fujitec in China (by Mar 31, 2014)
Fujitec’s Elevator Bidding in Beijing Subway Projects
Revised Financial Indexes of Fujitec for FY2015
Sales Volume of Shanghai Mitsubishi Elevator, 2002-2013
Cumulative Sales Volume of Shanghai Mitsubishi Elevator, 1987-2014
Revenue and Net Income of Shanghai Mitsubishi Elevator, 2009-2014
Service Revenue and Its Share of Total Revenue of Shanghai Mitsubishi Elevator, 2012-2014
Gross Margin of Elevator and Escalator of Shanghai Mitsubishi Elevator, 2008-2014
Typical Application Projects of Shanghai Mitsubishi Elevator
Major Projects of Shanghai Mitsubishi Elevator
Policies on SOE Reform in Shanghai
Revenue and Net Income of Shanghai Mitsubishi Elevator, 2015-2018E
Revenue and Net Income of Guangzhou Guangri Stock, 2010-2015
Operating Revenue Breakdown of Guangzhou Guangri Stock (by Business), 2013-2014
Operating Revenue Breakdown of Guangzhou Guangri Stock (by Region), 2013-2014
Gross Margin of Guangzhou Guangri Stock, 2013-2014
Operating Indicators of Main Subsidiaries and Joint-stock Companies of Guangzhou Guangri Stock, 2014
Layout in Industry 4.0 Intelligence Platform of Guangzhou Guangri Stock
Industrial Chain Layout of Guangzhou Guangri Stock
Revenue and Net Income of Guangzhou Guangri Stock, 2015-2018E
Elevator Output, Sales Volume and Inventory of Canny Elevator, 2011-2014
Revenue and Net Income of Canny Elevator, 2009-2015
Revenue Structure of Canny Elevator (by Product), 2010-2014
Revenue Structure of Canny Elevator (by Region), 2010-2014
Gross Margin of Canny Elevator, 2008-2014
R&D Costs and % of Total Revenue of Canny Elevator, 2009-2014
Main Elevator Orders of Canny Elevator, 2006-2015
Large Winning Projects of Canny Elevator in Overseas Markets, 2013-2014
Main Financial Indexes of UNISROBO, 2013-2014
Revenue and Net Income of Canny Elevator, 2015-2018E
Elevator Output, Sales Volume and Inventory of SJEC Corporation, 2012-2014
Revenue and Net Income of SJEC Corporation, 2009-2015
Revenue Structure of SJEC Corporation (by Business), 2010-2014
Revenue Structure of SJEC Corporation (by Region), 2009-2014
Gross Margin of SJEC Corporation, 2008-2014
R&D Costs and % of Total Revenue of SJEC Corporation, 2008-2014
Order Amount in Hand of SJEC Corporation, 2013-2015
Revenue and Net Income of SJEC Corporation, 2015-2018E
Output, Sales and Inventory of Shenyang Brilliant Elevator, 2009-2014
Revenue and Net Income of Shenyang Brilliant Elevator, 2009-2015
Revenue Structure of Shenyang Brilliant Elevator (by Product), 2009-2014
Revenue Structure of Shenyang Brilliant Elevator (by Region), 2009-2014
Revenue Structure of Shenyang Brilliant Elevator (by Region), 2014
Gross Margin of Shenyang Brilliant Elevator, 2009-2014
R&D Costs and % of Total Revenue of Shenyang Brilliant Elevator, 2009-2014
Comparison of Direct Sales and Distribution in China Elevator Industry
Revenue and Net Income of Shenyang Brilliant Elevator, 2015-2018E
Output and Sales Volume of Shenlong Elevator, 2011-2013
Sales Volume of Shenlong Elevator (by Product), 2011-2013
Average Selling Prices of Shenlong Elevator’s Products, 2011-2013
Revenue and Net Income of Shenlong Elevator, 2011-2013
Operating Revenue Structure of Shenlong Elevator (by Product), 2011-2013
Revenue Structure of Shenlong Elevator (by Region), 2011-2013
Gross Margin of Shenlong Elevator, 2011-2013
Shenlong Elevator’s Revenue from Top5 Clients and % of Total Revenue, 2013
Shenlong Elevator’s Procurement from Top5 Suppliers and % of Total Procurement, 2013
Major Elevator Orders of Shenlong Elevator, 2013
R&D Costs and % of Total Revenue of Shenlong Elevator, 2011-2013
Projects of Shenlong Elevator with Funds Raised
New Capacity of Projects of Shenlong Elevator with Funds Raised
Development History of Dongnan Elevator
Application Cases of Special Elevators of Dongnan Elevator
Marketing Network of Dongnan Elevator in China
Elevator Output, Sales Volume and Ownership in China, 2001-2014
Urbanization Rate and Per Capita GDP in the World’s Major Countries
China’s Elevator Output, 2015-2018E
Map of “One Belt and One Road”
Export Volume of Elevator and Escalator in China, 2015-2018E
如果这份报告不能满足您的要求,我们还可以为您定制报告,请 留言说明您的详细需求。
|