|
|
|
报告导航:研究报告—
TMT产业—电子半导体
|
|
2014-2015年全球及中国晶圆代工(Foundry)研究报告 |
 |
字数:1.8万 |
页数:110 |
图表数:119 |
|
中文电子版:8000元 |
中文纸版:4000元 |
中文(电子+纸)版:8500元 |
|
英文电子版:2200美元 |
英文纸版:2350美元 |
英文(电子+纸)版:2500美元 |
|
编号:ZYW210
|
发布日期:2015-06 |
附件:下载 |
 |
|
|
《2014-2015年全球及中国晶圆代工(Foundry)研究报告》包含以下内容:
1、全球半导体市场与产业分析
2、中国半导体市场与产业分析
3、全球与中国晶圆代工(Foundry) 产业分析
4、16家晶圆代工(Foundry)厂家研究
2014年全球晶圆代工(Foundry)市场规模大约为461亿美元,比2013年增长18.2%,预计2015年全球晶圆代工(Foundry)市场规模为528亿美元,比2014年增长14.5%。预计2016年全球晶圆代工(Foundry)市场规模为583亿美元,比2015年增长6.4%。2017年增幅更低,预计只有3.7%。
2016年晶圆代工市场增幅大幅度降低的原因有几点,首先是主要的电子产品如智能手机、平板电脑和笔记本电脑市场在2014年达到巅峰期,2015年市场出现停滞或下滑,平板电脑市场已经出现明显下滑。设备市场稍微滞后,因此2016年出现下滑。其次是全球范围内的通货紧缩,以石油铁矿石为首的大宗商品价格暴跌会引起连锁效应,同样会导致半导体设备价格下滑。再次是全球经济复苏态势恐停滞,美国2015年1季度GDP下滑0.7%,中国GDP增速也大大放缓。
尽管整体市场规模仍然是增长的,但是对于大多数企业,2016年以后可能是下滑的。增长主要来自龙头厂家TSMC。尽管面临三星、Global Foundries甚至Intel的竞争,TSMC未来的市场占有率会进一步提高。
最危险的莫过于Global Foundries,其背后支撑是阿联酋的主权基金。油价长期处于低位,对于依赖石油的阿联酋来说不是好事,其财政收入必然下滑。Global Foundries是个无底洞,亏损幅度越来越大,继续在Global Foundries近百亿美元的投资显然不会得到认同。如果油价长期跌破40美元,那么阿联酋主权基金肯定会出售Global Foundries,接盘者很有可能是中国投资者。
近期也有传言,中国投资者有意收购Global Foundries。如果中国投资者收购Global Foundries,那么TSMC将少一个强劲的竞争对手。三星的手机业务利润逐渐下滑,Memory领域内的利润成为三星主要的利润来源。而Foundry利润微薄,甚至是亏损的,三星只会把更多精力投入到Memory领域而非Foundry。至于Intel在Foundry领域一直处于摸索状态,虽然拥有最先进的技术,但得不到客户认同,最先进的未必是最好的。
三星在Foundry领域成功的可能性极低,因为三星与全球大多数电子企业都是直接或间接的竞争对手,没有人会长期支持竞争对手。还有三星与众多电子企业都有专利或者其他领域的诉讼,例如全球最大的Graphic IC厂家NVIDIA就与三星有专利纠纷。NVIDIA只会象征性地下单给三星,但订单数量少到可以忽略,只不过是用来和TSMC讨价还价的策略而已。这是大多数电子厂家的策略,越是经济不景气时,大家对TSMC的下单比例就会越高。
在Foundry领域,技术先进并不意味着业绩会好。以 Global Foundries为例,技术上与三星、IBM 在同一水平,然而Global Foundries 2014年净损失从2013年的9亿增加至15亿美金。它的EBITDA表现更糟糕,从2012年的10亿美元降至2014年的4亿多美金,税息折旧及摊销利润率(EBITDA margin)只有11%,低于业界平均水平。
Global and China Foundry Industry Report, 2014-2015 highlights the followings:
1. Analysis of global semiconductor market and industry
2. Analysis of Chinese semiconductor market and industry
3. Analysis of global and China foundry industry
4. Study of 16 foundry vendors
Global foundry industry was worth about USD46.1 billion in 2014, up 18.2% from 2013, and is expected to reach USD52.8 billion in 2015, a year-on-year growth of 14.5%, and USD58.3 billion in 2016, rising by 6.4% against 2015, and increase by just 3.7% in 2017.
Substantial decline in growth rate of global foundry market in 2016 can be attributable to following aspects. First, markets for main electronic products like smartphone, tablet PC and laptop computer peaked in 2014 and has stalled or slid in 2015, with notable drop having been seen in tablet PC market. Device market lags slightly and will experience slowdown in 2016. Second, worldwide deflation and price slump of bulk commodities led by oil and iron ore may trigger a ripple effect, causing a fall in prices of semiconductor equipment. Third, global economic recovery could come to a standstill, as US Q1 GDP contracted 0.7% and China’s GDP growth slowed down sharply.
Despite expansion in overall market size, for most companies, the market maybe contract after 2016. Growth comes mainly from the industry leader- TSMC. In spite of competition from Samsung, Global Foundries and even Intel, TSMC will further raise its market share.
The one that is in the most dangerous situation is Global Foundries, which is backed by UAE’s sovereign fund. Prolonged low oil price is not a good thing for UAE that relies heavily on oil, and it is inevitable that the country’s fiscal revenue will go down. Global Foundries will finally become an abyss, as its losses are widening. Nearly ten billion dollar investment in Global Foundries will not be appreciated obviously. If oil price remains below USD40 for a long time, UAE’s sovereign fund will surely sell Global Foundries and buyers are likely to be Chinese investors.
It was rumored recently that Chinese investors intended to acquire Global Foundries. If this became true, TSMC will have one less tough competitors. As Samsung's profit from mobile phone business drops, Memory has become main source of Samsung’s profit. Moreover, Foundry makes meager profits or even losses, so Samsung will be more focused on Memory rather than Foundry. As to Intel, it has been groping in Foundry field with technologies that are the most advanced but not recognized by customers, showing that the most advanced is not necessarily the best.
It is very unlikely that Samsung will succeed in Foundry, as most of global electronics companies are direct or indirect rivals of Samsung, and no one will support its competitor for a long time. Furthermore, Samsung gets involved in legal battles with a large number of electronics companies over patent or other aspects, like patent dispute between the world’s largest Graphic IC vendor NVIDIA and Samsung. NVIDIA only symbolically places orders with Samsung, but the number of orders to Samsung could be ignored, just a strategy for NVIDIA to bargain with TSMC, which is adopted by majority of electronic companies, especially during economic downturn, when they put more orders with TSMC.
In Foundry field, advanced technology doesn’t always deliver good business performance. Take Global Foundries for example, technologically staying at same level with Samsung and IBM, Global Foundries recorded a widened net loss from USD900 million in 2013 to USD1.5 billion in 2015. EBITDA was much worse, down from USD1 billion in 2012 to more than USD400 million in 2014. EBITDA margin stood at only 11%, below the industry average.
第一章、全球半导体产业
1.1、半导体市场概况
1.2、半导体产业供应链
1.3、 半导体产业概况
第二章、FOUNDRY下游市场
2.1、手机市场
2.2、全球手机产业
2.3、中国手机市场
2.4、笔记本电脑市场
2.5、平板电脑市场
2.6、服务器市场
第三章、FOUNDRY产业分析
3.1、晶圆代工产业规模
3.2、晶圆代工行业竞争分析
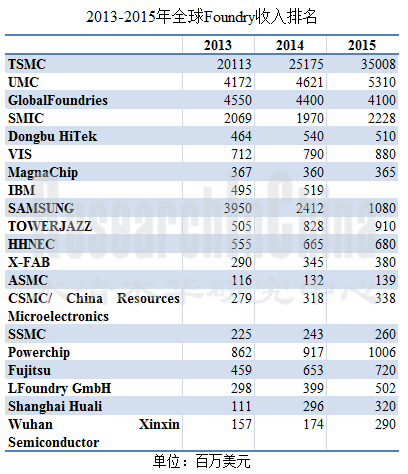
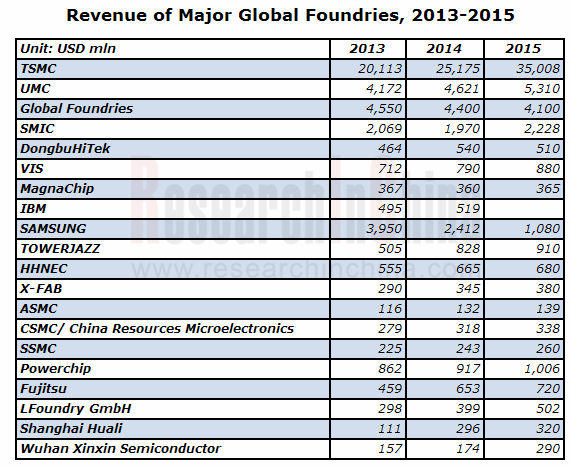
3.3、晶圆代工产业排名
3.4、7NM FOUNDRY
3.5、中国IC市场
3.6、中国半导体产业
3.7、中国政府扶植半导体产业政策
3.8、中国近期半导体领域内并购
3.9、中国IC产业发展预测
3.10、中国晶圆代工产业发展目标
3.11、中国本土LOCAL半导体设备产业
第四章、FOUNDRY厂家研究
4.1、TSMC
4.2、UMC
4.3、SMIC
4.4、VIS
4.5、POWERCHIP
4.6、HHGRACE
4.7、DONGBU HITEK
4.8、TOWER
4.9、X-FAB
4.10、ASMC
4.11、三星
4.12、MAGNACHIP
4.13、GLOBALFOUNDRIES
4.14、富士通
4.15、华力微电子
4.16、武汉新芯集成电路制造
1 Global Semiconductor Industry
1.1 Overview of Semiconductor Market
1.2 Semiconductor Industry Supply Chain
1.3 Overview of Semiconductor Industry
2 Foundry Downstream Market
2.1 Mobile Phone Market
2.2 Global Mobile Phone Industry
2.3 Chinese Mobile Phone Market
2.4 Laptop Computer Market
2.5 Tablet PC Market
2.6 Server Market
3 Foundry Industry
3.1 Industry Size
3.2 Industry Competition
3.3 Industry Ranking
3.4 7nm Foundry
3.5 Chinese IC Market
3.6 China Semiconductor Industry
3.7 Chinese Government’s Supportive Policies for Semiconductor Industry
3.8 Recent M&As in China’s Semiconductor Field
3.9 Forecast of China IC Industry Development
3.10 Development Goals of China Foundry Industry
3.11 China’s Local Semiconductor Device Industry
4 FOUNDRY Vendors
4.1 TSMC
4.2 UMC
4.3 SMIC
4.4 VIS
4.5 POWERCHIP
4.6 HHGRACE
4.7 DONGBU HITEK
4.8 TOWER
4.9 X-FAB
4.10 ASMC
4.11Samsung
4.12 MAGNACHIP
4.13 GLOBALFOUNDRIES
4.14 Fujitsu
4.15 Huali Microelectronics
4.16 XMC
2013-2019年全球半导体市场规模
2013-2016年全球半导体市场产品分布
2013-2016年全球半导体产品增幅
Semiconductor Outsourced Supply Chain
Semiconductor Company Systems
Semiconductor Outsourced Supply Chain Example
Food Chain IC CAD Design Industry
1Q14 Top25 Semiconductor Sales Leaders
1Q15 Top25 Semiconductor Sales Leaders
1990-2013 Worldwide IC Sales by Company Headquarters Location
2013 Fabless IC Sales Marketshare by Company Headquarters Location
2008-2013 Top 10 IC Manufacturers in China
2011-2018 Mainstream tech-node on Typical Smartphone IC
2008-2016年平均每部手机IC成本
2000-2018年Frequency bands per mobile handset device
2000-2018 Cellular terminal shipment forecast by cellular standard
2011-2018 LTE-enabled cellular terminal forecast
2015年1季度主要手机厂家出货量
2015年1季度主要手机厂家市场占有率
2015年1季度主要手机OS市场占有率
Worldwide Smartphone Sales to End Users by Vendor in 2014 (Thousands of Units)
Worldwide Smartphone Sales to End Users by Operating System in 2014 (Thousands of Units)
2014年全球前十大手机厂家出货量
2014年中国智能手机市场主要厂家市场占有率
2014年中国4G手机市场主要厂家市场占有率
2008-2015年笔记本电脑出货量
2010-2014年全球主要笔记本电脑ODM厂家出货量
2011-2016年全球平板电脑出货量
Top Five Tablet Vendors, Shipments Fourth Quarter 2014
Top Five Tablet Vendors, Shipments, Market Share, and Growth, Calendar Year 2014
2013-2018年全球服务器市场规模
2013 Top 5 Corporate Family, Worldwide Server Systems Factory Revenue
Top 5 Corporate Family, Worldwide Server Systems Factory Revenue, Fourth Quarter of 2014
2015年全球服务器生产厂家市场占有率
2008-2017年全球Foundry市场规模
2012-2018 Global Foundry capacity by node
2012-2018 Global Foundry revenue by node
2005-2014 Global ranking by foundry
2005-2014年全球晶圆代工厂销售额排名
2013-2015年全球主要Foundry厂家营业利润率
2011-2017年中国IC市场规模
2006-2014年中国IC进口额
2006-2014年中国IC出口额
2008-2014年中国IC产业销售额
2008-2014年中国IC产业 Capex
2004、2014年中国十大IC设计公司销售额排名
2002-2018 China foundry sales share of the pure-play IC foundry market
中国集成电路基金会结构
TSMC 组织结构
2005-2015 年TSMC收入、毛利率、营业利润率
2004-2011年TSMC Wafers Shipments and utilization
2012-2014年TSMC Wafers Shipments and utilization
2012-2014 TSMC Consolidated Statements of Financial Position Data
2013Q1-2015Q1 TSMC Quarterly Revenues VS Gross Margin
2013Q1-2015Q1 TSMC Quarterly Revenues VS Net Margin
2013Q1-2015Q1 TSMC Quarterly Shipment VS Operation Margin
2012Q1-2015Q1 TSMC Quarterly Revenues by Node
2012Q1-2015Q1 TSMC Quarterly Revenues by Application
2012Q1-2014Q2 TSMC Quarterly Revenues by Region
2013Q1-2015Q1 TSMC Quarterly Wafer Shipments and ASP
TSMC Fab List
TSMC上海厂2013年财务数据
2004-2015 UMC 收入与营业利润率
2004-2014 UMC出货量与产能利用率
1Q13-1Q15 UMC Quarterly Shipment VS utilization
3Q12-1Q15 UMC Quarterly Revenues and Gross Margin
2012Q3-2015Q1 UMC Quarterly Revenues by Node
2012Q3-2015Q1 UMC Quarterly Revenues by Region
2012Q3-2015Q1 UMC Quarterly Revenues by Application
2006Q1-2015Q2 UMC Quarterly Capacity
UMC operating revenues in 2012 - 2014 by the location of customers.
SMIC Milestones
SMIC Fab Capacity
2003-2015年SMIC收入与营业利润率
2008-2014年SMIC Capacity
2008-2014年SMIC毛利率
1Q15 SMIC Balance Sheet
1Q15 SMIC Cash Flow
3Q11-1Q15 SMIC Net Profit and Gross Margin
3Q11-1Q15 SMIC EBITDA
3Q11-1Q15 SMIC Utilization Rate
2010-2014年SMIC收入地域分布
2013Q2-2015Q1 SMIC Quarterly Revenue Breakdown by Geography
2010-2014年SMIC收入应用分布
2013Q2-2015Q1 SMIC Quarterly Revenue Breakdown by Application
2010-2014 SMIC Revenue Breakdown by Node
2013Q2-2015Q1 SMIC Quarterly Revenue Breakdown by Node
2013Q2-2015Q1 SMIC Quarterly Capacity
SMIC Technology Migration on Application
ORGANIZATION OF VIS
2005-2015年VIS收入与营业利润率
1Q12-1Q15 VIS Quarterly Revenue And Gross Margin
1Q12-1Q15 VIS Quarterly Revenue And UTILRate
4Q12-1Q15 VIS Quarterly Revenue Breakdown by Node
1Q12-1Q15 VIS Quarterly Revenue Breakdown by Application
1Q12-1Q15 VIS Quarterly Revenue Breakdown by Product
Powerchip组织结构
2013年5月-2015年5月Powerchip月度收入
2011-2015年华虹宏力收入、毛利、营业利润
2011-2014年华虹集团收入、净利润、资产负债率
2011-2014华虹宏力Revenue Breakdown by Product
2011-2014华虹宏力Revenue Breakdown by Node
2011-2014华虹宏力产能利用率
2011-2014华虹宏力Revenue Breakdown by Clients
2011-2014华虹宏力Revenue Breakdown by Region
2011-2014华虹宏力Revenue Breakdown by Application
2005-2015年Dongbu HiTek收入与营业利润率
2003-2015 TowerSemi收入与毛利率
Tower Semiconductor Shareholders Structure
2013年2季度-2015年1季度ASMC UTILRate(%)
2010-2015三星SystemLSI事业部收入与营业利润率
2011-2015 三星SystemLSI事业部收入业务分布
2005-2015年MAGNACHIP收入及毛利率
2005-2015年MAGNACHIP收入及运营利润率
2004-2014年MAGNACHIP分产品收入分布
2006-2014年MAGNACHIP分地域产品分布
MAGNACHIP各晶圆厂一览
2012/2013年GlobalFoundries财务数据
GlobalFoundries Milestone
GlobalFoundries Global Footprints
FY2006-FY2015 富士通 Devices Solution 收入与营业利润率
武汉新芯集成电路制造 Roadmap
XMC’s 3D IC technology Platform
Global Semiconductor Market Size, 2013-2019E
Global Semiconductor Market Breakdown by Product, 2012-2016E
Market Size Growth of Various Semiconductor Products, 2012-2016E
Semiconductor Outsourced Supply Chain
Semiconductor Company Systems
Semiconductor Outsourced Supply Chain Example
Food Chain IC CAD Design Industry
Top25 Semiconductor Sales Leaders, 2014Q1
Top25 Semiconductor Sales Leaders, 2015Q1
Worldwide IC Sales by Company Headquarters Location, 1990-2013
Fabless IC Sales Market Share by Company Headquarters Location, 2013
Top 10 IC Manufacturers in China, 2008-2013
Mainstream Tech-node on Typical Smartphone IC, 2011-2018E
Average IC Costs Per Mobile Phone, 2008-2016E
Frequency Bands Per Mobile Handset Device, 2000-2018E
Cellular Terminal Shipment Forecast by Cellular Standard, 2000-2018E
LTE-enabled Cellular Terminal Forecast, 2011-2018E
Shipments of Major Mobile Phone Vendors, 2015Q1
Market Share of Major Mobile Phone Vendors, 2015Q1
Market Share of Major Mobile Phone Operating Systems, 2015Q1
Worldwide Smartphone Sales to End Users by Vendor in 2014 (Thousands of Units)
Worldwide Smartphone Sales to End Users by Operating System in 2014 (Thousands of Units)
Shipments of Global Top10 Mobile Phone Vendors, 2014
Market Share of Major Chinese Smartphone Vendors, 2014
Market Share of Major Vendors in Chinese 4G Mobile Phone Market, 2014
Laptop Computer Shipments, 2008-2015
Shipments of Major Global Notebook PC ODM Vendors, 2010-2014
Global Tablet PC Shipments, 2011-2016E
Shipments of Top5 Tablet PC Vendors, 2014Q4
Shipments, Market Share and Growth of Top5 Tablet PC Vendors, 2014
Global Server Market Size, 2013-2018E
Worldwide Server Systems Factory Revenue of Top 5 Corporate Family, 2013
Worldwide Server Systems Factory Revenue of Top 5 Corporate Family, 2014Q4
Market Share of Global Server Vendors, 2015
Global Foundry Market Size, 2008-2017E
Global Foundry Capacity by Node, 2012-2018E
Global Foundry Revenue by Node, 2012-2018E
Global Foundry Ranking by Revenue, 2005-2014
Ranking of Global Foundries by Sales, 2005-2014
Operating Profit Margin of Major Global Foundries, 2013-2015
Chinese IC Market Size, 2011-2017E
China’s IC Imports, 2006-2013
China’s IC Exports, 2006-2013
Sales of China IC Industry, 2008-2014
Capex of China IC Industry, 2008-2014
Top 10 IC Design Houses in China by Sales, 2004&2014
China Foundry Sales Share of the Pure-play IC Foundry Market, 2002-2018E
China National IC Fund Structure
Organizational Structure of TSMC
Revenue, Gross Margin and Operating Margin of TSMC, 2005-2015
Wafer Shipments and Utilization of TSMC, 2012-2014
Consolidated Statement of Financial Position Data of TSMC, 2012-2014
Quarterly Revenue VS Gross Margin of TSMC, 2013Q1-2015Q1
Quarterly Revenue VS Net Margin of TSMC, 2013Q1-2015Q1
Quarterly Shipment VS Operation Margin of TSMC, 2013Q1-2015Q1
Quarterly Revenue of TSMC by Node, 2012Q1-2015Q1
Quarterly Revenue Breakdown of TSMC by Application, 2012Q1-2015Q1
Quarterly Revenue Breakdown of TSMC by Region, 2012Q1-2014Q2
Quarterly Wafer Shipments and ASP of TSMC, 2013Q1-2015Q1
Fab List of TSMC
Financial Figures of TSMC's Shanghai Factory, 2013
Revenue and Operating Margin of UMC, 2004-2015
Shipments and Capacity Utilization of UMC, 2004-2014
Quarterly Shipment VS utilization of UMC, 2013Q1-2015Q1
Quarterly Revenue and Gross Margin of UMC, 2012Q3-2015Q1
Quarterly Revenue Breakdown of UMC by Node, 2012Q3-2015Q1
Quarterly Revenue Breakdown of UMC by Region, 2012Q3-2015Q1
Quarterly Revenue Breakdown of UMC by Application, 2012Q3-2015Q1
Quarterly Capacity of UMC, 2006Q1-2015Q2
Operating Revenue Breakdown of UMC by Location of Customers, 2012-2014
Milestones of SMIC
Fab Capacity of SMIC
Revenue and Operating Margin of SMIC, 2003-2015
Capacity of SMIC, 2008-2014
Gross Margin of SMIC, 2008-2014
Balance Sheet of SMIC, 2015Q1
Cash Flow of SMIC, 2015Q1
Net Profit and Gross Margin of SMIC, 2011Q3-2015Q1
EBITDA of SMIC, 2011Q3-2015Q1
Utilization Rate of SMIC, 2011Q3-2015Q1
Revenue Breakdown of SMIC by Region, 2010-2014
Quarterly Revenue Breakdown of SMIC by Geography, 2013Q2-2015Q1
Revenue Breakdown of SMIC by Application, 2010-2014
Quarterly Revenue Breakdown of SMIC by Application, 2013Q2-2015Q1
Revenue Breakdown of SMIC by Node, 2010-2014
Quarterly Revenue Breakdown of SMIC by Node, 2013Q2-2015Q1
Quarterly Capacity of SMIC, 2013Q2-2015Q1
SMIC Technology Migration on Application
Organizational Structure of VIS
Revenue and Operating Margin of VIS, 2005-2015
Quarterly Revenue and Gross Margin of VIS, 2012Q1-2015Q1
Quarterly Revenue and Utilization Rate of VIS, 2012Q1-2015Q1
Quarterly Revenue Breakdown of VIS by Node, 2012Q4-2015Q1
Quarterly Revenue Breakdown of VIS by Application, 2012Q1-2015Q1
Quarterly Revenue Breakdown of VIS by Product, 2012Q1-2015Q1
Organizational Structure of Powerchip
Monthly Revenue of Powerchip, May 2013-May 2015
Revenue, Gross Profit and Operating Income of HHGrace, 2011-2015
Revenue, Net Income and Asset-liability Ratio of Huahong Group, 2011-2014
Revenue Breakdown of HHGrace by Product, 2011-2014
Revenue Breakdown of HHGrace by Node, 2011-2014
Capacity Utilization of HHGrace, 2011-2014
Revenue Breakdown of HHGrace by Client, 2011-2014
Revenue Breakdown of HHGrace by Region, 2011-2014
Revenue Breakdown of HHGrace by Application, 2011-2014
Revenue and Operating Margin of DongbuHiTek, 2005-2015
Fabs of DongbuHitek
Revenue and Gross Margin of TowerSemi, 2003-2015
Tower Semiconductor Shareholders Structure
Revenue and Gross Margin of ASMC, 2003-2015
Revenue Breakdown of ASMC by Application, 2013Q2-2015Q1
Revenue Breakdown of ASMC by Region, 2013Q2-2015Q1
Revenue Breakdown of ASMC by Client, 2013Q2-2015Q1
Revenue Breakdown of ASMC by Fab, 2013Q2-2015Q1
Utilization Rate of ASMC, 2013Q2-2015Q1
Revenue and Operating Margin of Samsung’s System LSI Division, 2010-2015
Revenue Breakdown of Samsung’s System LSI Division by Business, 2011-2015
Revenue and Gross Margin of MagnaChip, 2005-2015
Revenue and Operating Margin of MagnaChip, 2005-2015
Revenue Breakdown of MagnaChip by Product, 2004-2014
Revenue Breakdown of MagnaChip by Region, 2006-2014
Wafer Fabs of MagnaChip
Financial Figures for Global Foundries, 2012/2013
Milestones of Global Foundries
Global Footprints of Global Foundries
Revenue and Operating Margin of Fujitsu’s Devices Solution, FY2006-FY2015
Roadmap of XMC
XMC’s 3D IC Technology Platform
如果这份报告不能满足您的要求,我们还可以为您定制报告,请 留言说明您的详细需求。
|