|
|
|
报告导航:研究报告—
TMT产业—电子半导体
|
|
2014-2015年全球及中国先进封装(Advanced Packaging)研究报告 |
 |
字数:2.5万 |
页数:185 |
图表数:247 |
|
中文电子版:9500元 |
中文纸版:4750元 |
中文(电子+纸)版:10000元 |
|
|
|
|
|
编号:ZYW211
|
发布日期:2015-07 |
附件:下载 |
 |
|
|
《2014-2015年全球及中国先进封装(Advanced Packaging) 研究报告》包含以下内容:
1、全球半导体市场与产业分析
2、中国半导体市场与产业分析
3、先进封装(Advanced Packaging)技术趋势
4、全球与中国先进封装(Advanced Packaging) 产业分析
5、24家先进封装(Advanced Packaging) 厂家研究
2014年全球外包半导体封装测试(OSAT,Outsourced Semiconductor Assembly and Test)市场规模大约271亿美元,比2013年增长7.9%,预计2015年OSAT市场规模增长7.0%,达到290亿美元。预计2016年会进一步降低增速到3.8%,到2017年开始加速增长,增速预计达6.0%。Memory封测是OSAT领域最大规模的单一产品封测,预计2017年后HMC和HBM将大量出现,推动OSAT领域加速增长。而2015和2016年,预计SiP和ePoP将是OSAT领域增长的主要驱动力。
OSAT领域新技术层出不求,但真正能商业化大规模应用的新技术近年来极少。目前最热门的新技术包括FOWLP、2.5D、TSV等,然而其大规模应用恐怕都要等到2017年以后。一是这些新技术成熟度不够,规模有限,导致成本比较高,如试图取代FC-CSP的FOWLP。二是其商业模式,Wafer Level Packaing越来越常见;这种Wafer Level Packaing是Foundry主导还是OSAT主导,商业模式还需要摸索。在商业模式未完全定型情况下,下游厂家会采取观望态度。未来的2.5D和3D封装中,大部分封装的Silicon Interposer层可能由OSAT企业完成,也会有部分由Foundry完成,还会有可能产生一些专门负责Silicon Interposer层的企业。
OSAT产业两大明显趋势,一是大企业收入增长速度远超小企业,因为大企业有更多研发资金,而OSAT产业对新技术的追求非常迫切,没有足够的技术积累,企业就不会有长远发展。第二个趋势就是中国的OSAT厂家增长速度最快,这主要是中国国内流动性强,股市火热,OSAT厂家可以获得非常丰厚的资金支持,企业有充足的资金投入研发和扩展产能,中国的OSAT厂家利用强大的资本武器,进入高速发展期。中国的OSAT厂家将收购更多的企业来提升规模和技术实力。
Global and China Advanced Packaging Industry Report, 2014-2015 focuses on the followings:
1 Analysis of Global Semiconductor Market and Industry
2 Analysis of Chinese Semiconductor Market and Industry
3 Technical Trends of Advanced Packaging
4 Analysis of Global and China Advanced Packaging Industry
5 Study of 24 Advanced Packaging Vendors
Global outsourced semiconductor assembly and test (OSAT) market was valued at about USD27.1 billion in 2014, expanding by 7.9% from 2013, is expected to swell by 7.0% to USD29 billion in 2015, and will further slow down to 3.8% in 2016, but start to accelerate with growth rate of 6.0% in 2017. Memory packaging and test is the largest single-product packaging and test in OSAT field, HMC and HBM are expected to spring up after 2017, accelerating the expansion of OSAT. It is predicted that SiP and ePoP will be main drivers behind OSAT growth in 2015 and 2016.
New technologies have mushroomed in OSAT field, but few of them were commercialized and used on a massive basis in recent years. The most popular new technologies now include FOWLP, 2.5D and TSV, which are afraid to be put into large-scale application after 2017. On the one hand, these new technologies are not sufficiently mature and small in scale, leading to higher cost, like FOWLP attempting to replace FC-CSP. On the other hand, the reason lies in business model. Wafer-level packaging (WLP) has become more and more common, but the business model in which whether Foundry or OSAT dominates WLP still needs to be explored. As business model has not been fully shaped, downstream vendors will adopt a wait-and-see attitude. For future 2.5D and 3D packaging, most of silicon interposer layers may be completed by OSAT companies and part by Foundries. There may be also companies that specialize in silicon interposer layers.
Two pronounced trends of OSAT industry are: 1) Revenue growth of large companies far exceeds that of small ones, as the former has more funding for R&D than the latter, and OSAT industry hungers for new technologies. Long-term development of the companies cannot be realized without adequate technology accumulation. 2) Chinese OAST companies grow at the fastest rate, largely due to strong liquidity and hot stock market, which provide strong financial backing for OSAT companies, thus giving them adequate funds for R&D and capacity expansion. Chinese OSAT companies, by virtue of powerful weapon of capital, enter the stage of rapid development, and will boost its scale and technical competence via more acquisitions.
第一章、全球半导体产业
1.1、半导体市场概况
1.2、半导体产业供应链
1.3、 半导体产业概况
第二章、IC封装行业下游市场分析
2.1、全球MEMORY市场
2.2、DRAM供求分析
2.3、NAND供需分析
2.4、全球手机市场
2.5、全球手机产业
2.6、中国手机市场
2.7、笔记本电脑市场
2.8、平板电脑市场
2.9、服务器市场
第三章、封测技术趋势
3.1、HBM/HMC MEMORY
3.2、EMBEDDED COMPONENT SUBSTRATE
3.3、EMBEDDED TRACE SUBSTRATE
3.4、POP封装
3.5、FOWLP
3.6、SIP封装简介
3.7、SIP封装产业与市场
3.7.1、Murata
3.7.2、环旭电子
3.8、2.5D封装(SI/GLASS/ORGANIC INTERPOSER)
3.8.1、2.5D封装简介
3.8.2、2.5D封装应用
3.8.3、2.5D封装商业模式
3.8.4、2.5D Interposer市场规模
3.8.5、2.5D 封装供应商
3.9、TSV(3D)封装
3.9.1、TSV封装设备
3.10、SENSOR/MEMS/CIS封装
3.10.1、MEMS市场规模
3.10.2、Sensor/MEMS/CIS封装趋势
第四章、封测产业分析
4.1、封测产业规模
4.2、MIDDLE-END中段封测产业
4.3、中国半导体封测产业
4.4、中国半导体封测企业排名
4.5、半导体测试
4.6、全球封测厂家排名
4.7、晶圆代工产业规模
4.8、中国IC市场
4.9、中国半导体产业
4.10、中国政府扶植半导体产业政策
4.11、中国近期半导体领域内并购
4.12、中国IC产业发展预测
4.13、中国晶圆代工产业发展目标
第五章、封测厂家研究
5.1、日月光
5.2、安靠AMKOR
5.3、矽品精密SPIL
5.4、星科金朋
5.5、力成PTI
5.6、超丰GREATEK
5.7、南茂科技CHIPMOS
5.8、京元电子KYEC
5.9、UNISEM
5.10、福懋科技FATC
5.11、江苏长电科技JCET
5.12、UTAC
5.13、菱生精密
5.14、南通富士通微电子
5.15、华东科技
5.16、颀邦科技CHIPBOND
5.17、J-DEVICES
5.18、MPI
5.19、STS SEMICONDUCTOR
5.20、SIGNETICS
5.21、HANA MICRON
5.22、NEPES
5.23、天水华天科技
5.24、晶方科技
1 Global Semiconductor Industry
1.1 Market Overview
1.2 Supply Chain
1.3 Industry Overview
2 Downstream Markets of IC Packaging Industry
2.1 Global Memory Market
2.2 Supply and Demand of DRAM
2.3 Supply and Demand of NAND
2.4 Global Mobile Phone Market
2.5 Global Mobile Phone Industry
2.6 Chinese Mobile Phone Marekt
2.7 Laptop Computer Market
2.8 Tablet PC Market
2.9 Server Market
3 Trends of Packaging & Test Technology
3.1 HBM/HMC Memory
3.2 Embedded Component Substrate
3.3 Embedded Trace Substrate
3.4 POP Packaging
3.5 FOWLP
3.6 Introduction of SiP Packaging
3.7 SiP Packaging Industy and Market
3.7.1 Murata
3.7.2 USI
3.8 2.5D Packaging (SI/GLASS/ORGANIC INTERPOSER)
3.8.1 Introduction of 2.5D Packaging
3.8.2 Applications of 2.5D Packaging
3.8.3 Business Model of 2.5D Packaging
3.8.4 2.5D Interposer Market Size
3.8.5 Suppliers of 2.5D Packaging
3.9 TSV (3D) Packaging
3.9.1 TSV Packaging Equipment
3.10 SENSOR/MEMS/CIS Packaging
3.10.1 MEMS Market Size
3.10.2 Trends of Sensor/MEMS/CIS Packaging
4 Packaging & Test Industry
4.1 Packaging & Test Industry Size
4.2 Middle-end Packaging & Test Industy
4.3 China Semiconductor Packaging & Test Industy
4.4 Ranking of Chinese Semiconductor Packaging & Test Vendors
4.5 Semiconductor Test
4.6 Ranking of Global Packaging & Test Vendors
4.7 Foundry Industry Size
4.8 Chinese IC Market
4.9 China Semiconductor Industry
4.10 Chinese Government’s Supportive Policies for Semiconductor Industry
4.11 Recent M&As in China’s Semiconductor Field
4.12 Forecast of China IC Industry Development
4.13 Development Goals of China Foundry Industry
5 Packaging & Test Vendors
5.1 ASE
5.2 Amkor
5.3 SPIL
5.4 STATS ChipPAC
5.5 PTI
5.6 Greatek
5.7 ChipMOS
5.8 KYEC
5.9 Unisem
5.10 FATC
5.11 JCET
5.12 UTAC
5.13 Lingsen Precision
5.14 Nantong Fujitsu Microelectronics
5.15 Walton Advanced Engineering
5.16 Chipbond
5.17 J-DEVICES
5.18 MPI
5.19 STS Semiconductor
5.20 Signetics
5.21 Hana Micron
5.22 NEPES
5.23 Tianshui Huatian Technology
5.24 China Wafer Level CSP
2013-2019年全球半导体市场规模
2013-2016年全球半导体市场产品分布
2013-2016年全球半导体产品增幅
Semiconductor Outsourced Supply Chain
Semiconductor Company Systems
Semiconductor Outsourced Supply Chain Example
Food Chain IC CAD Design Industry
1Q14 Top25 Semiconductor Sales Leaders
1Q15 Top25 Semiconductor Sales Leaders
1990-2013 Worldwide IC Sales by Company Headquarters Location
2013 Fabless IC Sales Marketshare by Company Headquarters Location
2008-2013 Top 10 IC Manufacturers in China
2009-2016年全球Memory市场规模
2014年Global Memory Market by type
2008-2015 Auotomotive Memory Market Size
2010-2015 Auotomotive Memory Market By Technology
2008-2015 DRAM Industry Capex
2013-2016 DRAM Oversupply Ratio
2013-2015 DRAM Demand by Devices
2013-2015 DRAM GB/SystemDRAM GB/System
2014年1季度-2016年4季度 DRAM Oversupply Ratio
2008-2015 NAND Industry Capex
2011-2018 Mainstream tech-node on Typical Smartphone IC
2008-2016年平均每部手机IC成本
2000-2018年Frequency bands per mobile handset device
2000-2018 Cellular terminal shipment forecast by cellular standard
2011-2018 LTE-enabled cellular terminal forecast
2007-2015年全球手机出货量
2011-2014年全球3G/4G手机出货量地域分布
Worldwide Smartphone Sales to End Users by Vendor in 2014 (Thousands of Units)
Worldwide Smartphone Sales to End Users by Operating System in 2014 (Thousands of Units)
2014年全球前十大手机厂家出货量
2015年1季度主要手机厂家出货量
2015年1季度主要手机厂家市场占有率
2015年1季度主要手机OS市场占有率
Worldwide Smartphone Sales to End Users by Vendor in 2014 (Thousands of Units)
Worldwide Smartphone Sales to End Users by Operating System in 2014 (Thousands of Units)
2014年中国智能手机市场主要厂家市场占有率
2014年中国4G手机市场主要厂家市场占有率
2008-2015年笔记本电脑出货量
2010-2014年全球主要笔记本电脑ODM厂家出货量
2011-2016年全球平板电脑出货量
Top Five Tablet Vendors, Shipments Fourth Quarter 2014
Top Five Tablet Vendors, Shipments, Market Share, and Growth, Calendar Year 2014
2013-2018年全球服务器市场规模
2013 Top 5 Corporate Family, Worldwide Server Systems Factory Revenue
Top 5 Corporate Family, Worldwide Server Systems Factory Revenue, Fourth Quarter of 2014
2015年全球服务器生产厂家市场占有率
HBM Architecture
Mobile DRAM Trend
WIDE IO的优点
SK Hynix WIDE IO2 Roadmap
HMC Architecture
HMC BENEFITS
Advantages of Embedded Passive/Active Substrate内嵌被动与主动元件主板的优点
Embedded Component Substrate Process
Comparison of Embedded Active & Passive Components
Roadmap of Embedded Passive Substrate
Structure Roadmap of Embedded Active Substrate
FOWLP and PLP Process Comparison
WHY EMBEDDED TRACE?
EMBEDDED TRACE Package Features
EMBEDDED TRACE Package Sweet Spot (for Wire Bonding)
EMBEDDED TRACE Package Sweet Spot (for FLIP CHIP)
PoP封装发展趋势
Samsung Widcon
ePoP Architecture
FOWLP应用
Fan-Out eWLP (Embedded Wafer-Level Packaging) Architecture
Embedded Fan-Out Wafer Level Package (eWLP) vs.PBGA (Plastic Ball Grid Array)
Thermal Management between PBGA and InFO-WLP of Baseband Chip Set (TSMC Results)
SiP Module Technologies
ASE与USI的Business Model
SoC, SiP and SoB
SiP Roadmap
2014年SiP封装主要厂家市场占有率
FY2009-FY2016 Murata Sales and Operation Margin
FY2013-FY2016 Murata sales by product
Murata Major Product
FY2013-FY2016 Murata sales by Application
FY2014-FY2015 Operation Income Bridge
2012年2季度-2015年1季度Murata Quarterly Sales,Order and Backlog
2008-2015年环旭电子收入与营业利润率
2011-2014年环旭电子收入下游分布
2011-2014年环旭电子各项产品产量
2014年环旭电子成本结构
ASE(USI)SiP Module Roadmap for system integration
ASE(USI)SiP Module Roadmap for miniaturization
ASE(USI)SiP Module Roadmap advanced process
2.5D封装技术挑战
目前2.5D封装商业模式
未来的2.5D封装商业模式
2.5D Interposer Manfacturing Revenue
2010-2017 Breakdown by interposer bulk material
TSV下游应用
TSV设备供应商
2012-2017年TSV封装设备分布
MEMS -NEMS 趋势
2013\2018年MEMS出货量
2012-2018年MEMS市场规模
2014-2015 MEMS Main Player
Avago’s FBAR MEMS Filter with TSV
CIS封装趋势
Cross section SEM image of a BI-CIS
2008-2018年OSAT市场规模
1990-2020 Share of IC Package Value Add
2011\2013\2018 全球IC封装类型出货量分布
2013/2018 BUMPED WAFER PRODUCTION BY PITCH (300mm Equivalent)
Middle-End中段封测产业 Process
2009-2015年中国半导体封测产业规模
2010-2014年中国半导体封测企业数量与产能
2014年中国IC封测业收入排名前30企业
2013年FIQFN厂家排名
2013年FOWLP厂家排名
2013年Stacked Package厂家排名
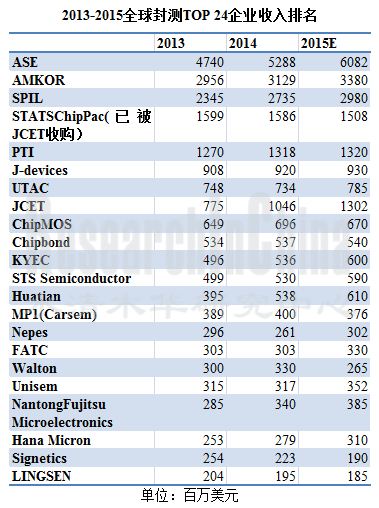
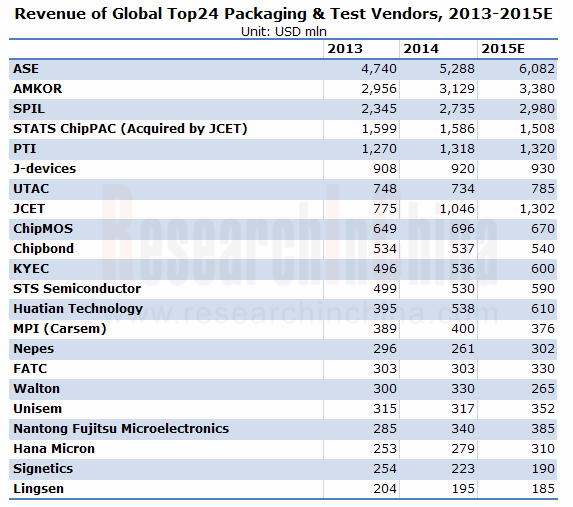
2013-2015全球封测前24大企业收入排名 Global Top24 OSAT Company Ranking by Revenue
2013-2015年全球主要OSAT厂家营业利润率与毛利率对比
2008-2017年全球Foundry市场规模
2011-2017年中国IC市场规模
2006-2013年中国IC进口额
2006-2013年中国IC出口额
2008-2014 中国IC产业销售额
2008-2014 中国IC产业 Capex
2004、2014年中国十大IC设计公司销售额排名
2002-2018 China foundry sales share of the pure-play IC foundry market
中国集成电路基金会结构
日月光组织结构
2003-2015年日月光收入与毛利率
2009-2015年日月光收入与营业利润率
2013年5月-2015年5月日月光月度收入
2010-2015年ASE收入业务分布
2013年1季度-2015年1季度ASE封装部门收入与毛利率
2013年1季度-2015年1季度ASE封装部门收入类型分布
2013年1季度-2015年1季度ASE测试部门收入与毛利率
2013年1季度-2015年1季度ASE材料部门收入与毛利率
2013年1季度-2015年1季度ASE EMS收入与毛利率
2013年1季度-2015年1季度ASE IC ATM Revenue by Application %
2013年1季度-2015年1季度ASE EMS Revenue by Application %
ASE Q1/2013-Q1/2015 Machinery & Equipment Capital Expenditure vs. EBITDA
ASE主要客户
2005-2015年Amkor收入与毛利率、运营利润率
2007-2015年Amkor收入封装类型分布
2012-2015 Amkor出货量封装类型分布
2012-2015年Amkor收入下游分布
2012-2015 Amkor Capital Intensity
2012-2015 Amkor Debt and Cash
Property, Plant and Equipment By Region 2012\2013
2012年安靠收入与出货量地域分布
2012-2014 Amkor net sales by country based on customer location
矽品精密工业组织结构
2005-2015年矽品收入、毛利率、运营利润率
2013年5月-2015年5月SPIL月度收入
2013年1季度-2015年1季度SPIL季度收入、毛利率与营业利润率
2005-2015年矽品收入地域分布
2005-2015年矽品收入下游应用分布
2005-2015年矽品收入业务分布
矽品2006-2015年产能统计
NEW STATS ChipPAC 股权结构
2004-2015年星科金朋收入与毛利率
2006-2015年星科金朋收入封装类型分布
2006-2015年星科金朋收入下游应用分布
2006-2015年星科金朋收入地域分布
PTI组织结构
2008-2015 PTI收入与毛利率
2013年5月-2015年5月PTI月度收入
2014年1季度-2015年1季度PTI收入mix by application
2005-2015年超丰电子收入、毛利率、运营利润率
2013年5月-2015年5月超丰电子月度收入与增幅
2003-2015年南茂科技收入与毛利率
2009-2015年南茂收入与营业利润率
2010-2015年南茂科技收入业务分布
2010-2015年南茂科技收入产品分布
2011-2015年南茂科技Utilization Rate 和EBITDA Margin
2011-2015年南茂科技Cash Flow 和CAPEX
2014-2016 ChipMOS Technology Roadmap
ChipMOS Technology Development & Business Alignment
2003-2015年京元电子收入与毛利率
2009-2015年京元电子收入与营业利润率
2013年5月-2015年5月京元电子月度收入
京元电子厂房分布
京元电子TESTING PLATFORMS
2006-2015年Unisem收入与EBITDA
2012年1季度-2015年1季度 Unisem收入与EBITDA
2012年1季度-2015年1季度 Unisem季度毛利率
Q2/12-Q1/15 Unisem季度收入技术分布%
Q2/12-Q1/15 Unisem季度收入下游分布%
台塑集团组织结构
福懋科技组织结构
2006-2015年福懋科技收入与运营利润率
2009-2015年福懋科技收入与毛利率
2013年5月-2015年5月福懋科技月度收入
2006-2015年JCET收入与运营利润率
2011-2014年JCET产量
2012-2013年JCET CHIP Packaging成本结构
2013-2014年JCET收入产品分布
2012年全球CU Pilluar产能分布
2009-2014年JCET资产负债
07年1季度-15年1季度JCET季度收入
07年1季度-15年1季度JCET季度净利润
2013-2014 JCET主要子公司收入与利润
JCET路线图
2010-2015年UTAC收入与毛利率
2010-2014年UTAC收入业务分布
2010-2015年UTAC收入地域分布
2010-2015年UTAC收入产品分布
2011-2013年UTAC收入客户分布
UTAC 技术分布
UTAC全球分布
2007-2015年菱生精密收入与运营利润率
2009-2015年菱生精密收入与毛利率
2013年5月-2015年5月菱生精密月度收入
2007-2015年南通富士通微电子收入与营业利润
2012-2014通富微电资产负债表
2012-2014通富微电Cash Flows
2012-2014通富微电Key Ratio
2007-2015年华东科技收入与运营利润率
2009-2015年华东科技收入与毛利率
2013年5月-2015年5月华东科技月度收入与增幅
2006-2015年颀邦科技收入与运营利润率
2009-2015年颀邦科技收入与毛利率
2013年5月-2015年5月颀邦科技月度收入与增幅
2012年颀邦科技收入业务分布
2013全球Gold Bumping Vendor Capacity Share
J-Devices 组织结构
2007-2015财年MPI收入与税前利润
FY2010-FY2014 MPI EQUITY与ASSETS
FY2011-FY2014 MPI收入地域分布
STS Semiconductor组织结构
2006-2015年STS Semiconductor收入与运营利润率
2011-2013年STS Semiconductor收入业务分布
2011-2013年STS Semiconductor产能
2011-2013年STS Semiconductor产量
2013-2015 STS Semiconductor客户分布
Signetics股东结构
2007-2015年Signetics收入与运营利润率
2006-2015年Hana Micron收入与运营利润率
2014年Hana Micron收入客户分布
2013年1季度-2014年4季度Hana Micron收入市场分布
2007-2015年Nepes收入与运营利润率
2013-2014年Nepes季度收入部门分布
2006-2015年天水华天收入与运营利润率
2010-2015年晶方科技收入与营业利润
2014年晶方科技收入客户分布
Global Semiconductor Market Size, 2013-2019E
Global Semiconductor Market Breakdown by Product, 2012-2016E
Market Size Growth of Various Semiconductor Products, 2012-2016E
Semiconductor Outsourced Supply Chain
Semiconductor Company Systems
Semiconductor Outsourced Supply Chain Example
Food Chain IC CAD Design Industry
Top25 Semiconductor Sales Leaders, 2014Q1
Top25 Semiconductor Sales Leaders, 2015Q1
Worldwide IC Sales by Company Headquarters Location, 1990-2013
Fabless IC Sales Market Share by Company Headquarters Location, 2013
Top10 IC Vendors in China, 2008-2013
Global Memory Market Size, 2009-2016E
Global Memory Market by Type, 2014
Automotive Memory Market Size, 2008-2015
Automotive Memory Market by Technology, 2010-2015
Capex of DRAM Industry, 2008-2015
Oversupply Ratio of DRAM, 2013-2016E
DRAM Demand by Device, 2013-2015
DRAM GB/System, 2013-2015
Oversupply Ratio of DRAM, 2014Q1-2016Q4E
Capex of NAND Industry, 2008-2015
Mainstream Tech-node on Typical Smartphone IC, 2011-2018E
Average IC Costs Per Mobile Phone, 2008-2016E
Frequency Bands Per Mobile Handset Device, 2000-2018E
Cellular Terminal Shipment Forecast by Cellular Standard, 2000-2018E
LTE-enabled Cellular Terminal Forecast, 2011-2018E
Global Mobile Phone Shipments, 2007-2015
Global 3G/4G Mobile Phone Shipments Breakdown by Region, 2011-2014
Worldwide Smartphone Sales to End Users by Vendor, 2014 (Thousands of Units)
Worldwide Smartphone Sales to End Users by Operating System, 2014 (Thousands of Units)
Shipments of Global Top10 Mobile Phone Vendors, 2014
Shipments of Major Mobile Phone Vendors, 2015Q1
Market Share of Major Mobile Phone Vendors, 2015Q1
Market Share of Major Mobile Phone Operating Systems, 2015Q1
Worldwide Smartphone Sales to End Users by Vendor, 2014 (Thousands of Units)
Worldwide Smartphone Sales to End Users by Operating System, 2014 (Thousands of Units)
Market Share of Major Chinese Smartphone Vendors, 2014
Market Share of Major Vendors in Chinese 4G Mobile Phone Market, 2014
Laptop Computer Shipments, 2008-2015
Shipments of Major Global Notebook PC ODM Vendors, 2010-2014
Global Tablet PC Shipments, 2011-2016E
Shipments of Top5 Tablet PC Vendors, 2014Q4
Shipments, Market Share and Growth of Top5 Tablet PC Vendors, 2014
Global Server Market Size, 2013-2018E
Worldwide Server Systems Factory Revenue of Top5 Corporate Family, 2013
Worldwide Server Systems Factory Revenue of Top5 Corporate Family, 2014Q4
Market Share of Global Server Vendors, 2015
HBM Architecture
Mobile DRAM Trend
Advantages of WIDE IO
SK Hynix WIDE IO2 Roadmap
HMC Architecture
Benefits of HMC
Advantages of Embedded Passive/Active Substrate
Embedded Component Substrate Process
Comparison of Embedded Active & Passive Components
Roadmap of Embedded Passive Substrate
Structure Roadmap of Embedded Active Substrate
FOWLP and PLP Process Comparison
Why Embedded Trace?
Embedded Trace Package Features
Embedded Trace Package Sweet Spot (for Wire Bonding)
Embedded Trace Package Sweet Spot (for FLIP CHIP)
Development Trend of PoP Packaging
Samsung Widcon
ePoP Architecture
Application of FOWLP
Fan-Out eWLP (Embedded Wafer-Level Packaging) Architecture
Embedded Fan-Out Wafer Level Package (eWLP) vs. PBGA (Plastic Ball Grid Array)
Thermal Management between PBGA and InFO-WLP of Baseband Chip Set (TSMC Results)
SiP Module Technologies
Business Model of ASE and USI
SoC, SiP and SoB
SiP Roadmap
Market Share of Major SiP Packaging Vendors, 2014
Sales and Operation Margin of Murata, FY2009-FY2016
Sales Breakdown of Murata by Product, FY2013-FY2015
Major Products of Murata
Sales Breakdown of Murata by Application, FY2013-FY2016
Operation Income Bridge of Murata, FY2014-FY2015
Quarterly Sales, Order and Backlog of Murata, 2012Q2-2015Q1
Revenue and Operating Margin of USI, 2008-2015
Revenue of USI by Application, 2011-2014
Output of USI’s Products, 2011-2014
Cost Structure of USI, 2014
ASE (USI) SiP Module Roadmap for System Integration
ASE (USI) SiP Module Roadmap for Miniaturization
ASE (USI) SiP Module Roadmap Advanced Process
Challenges of 2.5D Packaging Technology
Current 2.5D Packaging Business Model
Future 2.5D Packaging Business Model
2.5D Interposer Manufacturing Revenue
Breakdown by Interposer Bulk Material, 2010-2017
Applications of TSV
Suppliers of TSV Equipment
TSV Packaging Equipment Distribution, 2012-2017E
MEMS -NEMS Trend
MEMS Shipments, 2013\2018E
MEMS Market Size, 2012-2018E
Main MEMS Players, 2014-2015
Avago’s FBAR MEMS Filter with TSV
CIS Packaging Trend
Cross-section SEM Image of a BI-CIS
OSAT Market Size, 2008-2018E
Share of IC Package Value Add, 1990-2020E
Global Shipments of IC Packaging Type, 2011/2013/2018E
BUMPED WAFER PRODUCTION BY PITCH (300mm Equivalent), 2013/2018E
Middle-End Packaging Industry Process
China Semiconductor Packaging & Test Industry Size, 2009-2015
Number of Capacity of Chinese Semiconductor Packaging & Test Vendors, 2010-2014
Top30 Chinese IC Packaging & Test Vendors by Revenue, 2014
Ranking of FIQFN Vendors, 2013
Ranking of FOWLP Vendors, 2013
Ranking of Stacked Package Vendors, 2013
Ranking of Global Top24 OSAT Companies by Revenue, 2013-2015
Operating Margin and Gross Margin Comparison of Major Global OSAT Companies, 2013-2015
Global Foundry Market Size, 2008-2017E
Chinese IC Market Size, 2011-2017E
China’s IC Imports, 2006-2013
China’s IC Exports, 2006-2013
China’s IC Industry Sales, 2008-2014
Capex of China’s IC Industry, 2008-2014
Top10 Chinese IC Design Houses by Sales, 2004/2014
China Foundry Sales Share of the Pure-play IC Foundry Market, 2002-2018E
China National IC Fund Structure
Organizational Structure of ASE
Revenue and Gross Margin of ASE, 2003-2015
Revenue and Operating Margin of ASE, 2009-2015
Monthly Revenue of ASE, May 2013-May 2015
Revenue of ASE by Business, 2010-2015
Revenue and Gross Margin of ASE Packaging, 2013Q1-2015Q1
Revenue of ASE Packaging by Type, 2013Q1-2015Q1
Revenue and Gross Margin of ASE Testing, 2013Q1-2015Q1
Revenue and Gross Margin of ASE Material, 2013Q1-2015Q1
EMS Revenue and Gross Margin of ASE, 2013Q1-2015Q1
IC ATM Revenue Structure of ASE by Application, 2013Q1-2015Q1
EMS Revenue Structure of ASE by Application, 2013Q1-2015Q1
Machinery & Equipment Capital Expenditure vs. EBITDA of ASE, 2013Q1-2015 Q1
Major Customers of ASE
Revenue, Gross Margin and Operating Margin of Amkor, 2005-2015
Revenue of Amkor by Packaging Type, 2007-2015
Shipments of Amkor by Packaging Type, 2012-2015
Revenue of Amkor by Application, 2012-2015
Amkor’s Capital Intensity, 2012-2015
Debt and Cash of Amkor, 2012-2015
Property, Plant and Equipment of Amkor by Region 2012\2013
Revenue and Shipments of Amkor by Region, 2012
Net Sales of Amkor by Country Based on Customer Location, 2012-2014
Organizational Structure of SPIL
Revenue, Gross Margin and Operating Margin of SPIL, 2005-2015
Monthly Revenue of SPIL, May 2013-May 2015
Quarterly Revenue, Gross Margin and Operating Margin of SPIL, 2013Q1-2015Q1
Revenue of SPIL by Region, 2005-2015
Revenue of SPIL by Application, 2005-2015
Revenue of SPIL by Business, 2005-2015
Capacity of SPIL, 2006-2015
Equity Structure of New STATS ChipPAC
Revenue and Gross Margin of STATS ChipPAC, 2004-2015
Revenue of STATS ChipPAC by Packaging Type, 2006-2015
Revenue of STATS ChipPAC by Application, 2006-2015
Revenue of STATS ChipPAC by Region, 2006-2015
Organizational Structure of PTI
Revenue and Gross Margin of PTI, 2008-2015
Monthly Revenue of PTI, May 2013-May 2015
Revenue Mix of PTI by Application, 2014Q1-2015Q1
Revenue, Gross Margin and Operating Margin of Greatek, 2005-2015
Monthly Revenue and Growth of Greatek, May 2013-May 2015
Revenue and Gross Margin of ChipMOS, 2003-2015
Revenue and Operating Margin of ChipMOS, 2009-2015
Revenue of ChipMOS by Business, 2010-2015
Revenue of ChipMOS by Product, 2010-2015
Utilization Rate and EBITDA Margin of ChipMOS, 2011-2015
Cash Flow and CAPEX of ChipMOS, 2011-2015
Technology Roadmap of ChipMOS, 2014-2016
ChipMOS Technology Development & Business Alignment
Revenue and Gross Margin of KYEC, 2003-2015
Revenue and Operating Margin of KYEC, 2009-2015
Monthly Revenue of KYEC, May 2013-May 2015
Distribution of KYEC’s Plants
Testing Platforms of KYEC
Revenue and EBITDA of Unisem, 2006-2015
Revenue and EBITDA of Unisem, 2012Q1-2015Q1
Quarterly Gross Margin of Unisem, 2012Q1-2015Q1
Quarterly Revenue Structure of Unisem by Technology, 2012Q2-2015Q1
Quarterly Revenue Structure of Unisem by Application, 2012Q2-2015Q1
Organizational Structure of Formosa Plastics
Organizational Structure of FATC
Revenue and Operating Margin of FATC, 2006-2015
Revenue and Gross Margin of FATC, 2009-2015
Monthly Revenue of FATC, May 2013-May 2015
Revenue and Operating Margin of JCET, 2006-2015
Output of JCET, 2011-2014
Chip Packaging Cost Structure of JCET, 2012-2014
Revenue of JCET by Product, 2013-2014
Global CU Pilluar Capacity, 2012
Assets and Liabilities of JCET, 2009-2014
Quarterly Revenue of JCET, 2007Q1-2015Q1
Quarterly Net Income of JCET, 2007Q1-2015Q1
Revenue and Profit of JCET’s Major Subsidiaries, 2013-2014
JCET Roadmap
Revenue and Gross Margin of UTAC, 2010-2015
Revenue of UTAC by Business, 2010-2014
Revenue of UTAC by Business, 2010-2015
Revenue of UTAC by Product, 2010-2015
Revenue of UTAC by Customer, 2011-2013
Technological Distribution of UTAC
Global Distribution of UTAC
Revenue and Operating Margin of Lingsen Precision, 2007-2015
Revenue and Gross Margin of Lingsen Precision, 2009-2015
Monthly Revenue of Lingsen Precision, May 2013-May 2015
Revenue and Operating Income of Nantong Fujitsu Microelectronics, 2007-2015
Balance Sheet of Nantong Fujitsu Microelectronics, 2012-2014
Cash Flows of Nantong Fujitsu Microelectronics, 2012-2014
Key Ratio of Nantong Fujitsu Microelectronics, 2012-2014
Revenue and Operating Margin of Walton Advanced Engineering, 2007-2015
Revenue and Gross Margin of Walton Advanced Engineering, 2009-2015
Monthly Revenue and Growth of Walton Advanced Engineering, May 2013-May 2015
Revenue and Operating Margin of Chipbond, 2006-2015
Revenue and Gross Margin of Chipbond, 2009-2015
Monthly Revenue and Growth of Chipbond, May 2013-May 2015
Revenue of Chipbond by Business, 2012
Global Gold Bumping Vendor Capacity Share, 2013
Organizational Structure of J-DEVICES
Revenue and PBT of MPI, FY2007-FY2015
Equity and Assets of MPI, FY2010-FY2014
Revenue of MPI by Region, FY2011-FY2014
Organizational Structure of STS Semiconductor
Revenue and Operating Margin of STS Semiconductor, 2006-2015
Revenue of STS Semiconductor by Business, 2011-2013
Capacity of STS Semiconductor, 2011-2013
Output of STS Semiconductor, 2011-2013
Customer Distribution of STS Semiconductor, 2013-2015
Shareholder Structure of Signetics
Revenue and Operating Margin of Signetics, 2007-2015
Revenue and Operating Margin of Hana Micron, 2006-2015
Revenue of Hana Micron by Customer, 2014
Revenue of Hana Micron by Market, 2013Q1-2014Q4
Revenue and Operating Margin of Nepes, 2007-2015
Quarterly Revenue of Nepes by Division, 2013-2014
Revenue and Operating Margin of Tianshui Huatian Technology, 2006-2015
Revenue and Operating Income of China Wafer Level CSP, 2010-2015
Revenue of China Wafer Level CSP by Customer, 2014
如果这份报告不能满足您的要求,我们还可以为您定制报告,请 留言说明您的详细需求。
|