|
|
|
报告导航:研究报告—
制造业—材料
|
|
2014-2018年全球及中国高纯金属有机化合物(MO源)行业研究报告 |
 |
字数:2.2万 |
页数:72 |
图表数:83 |
|
中文电子版:7000元 |
中文纸版:3500元 |
中文(电子+纸)版:7500元 |
|
英文电子版:1700美元 |
英文纸版:1800美元 |
英文(电子+纸)版:2000美元 |
|
编号:ZHP024
|
发布日期:2015-07 |
附件:下载 |
 |
|
|
MO源(也叫高纯金属有机化合物)是MOCVD、MOMBE等半导体微结构材料的支撑材料,被广泛应用在LED(需求占比90%左右)、太阳能电池、箱变存储器、射频集成电路芯片等领域。
2009年之前全球MO源需求量较小,市场供需基本平衡。2009-2011年,在LED产业爆发式增长的带动下,MO源需求量快速增长,全球市场出现供不应求的局面,2011年全球MO源供需缺口约4.8吨;2012年以后,LED市场增速放缓,而各大厂商扩建产能逐渐投产,全球MO源市场慢慢呈现供过于求的局面。
中国是全球MO源主要生产与消费国之一。生产方面:2014年中国MO源产能28.5吨,全球占比约30%,预计2015年的产能将增加至33.6吨;需求方面:2014年中国MO源需求量为23.5吨,全球占比约40.4%,在MOCVD出货量持续增长的带动下,2015年需求量有望达到32.7吨。
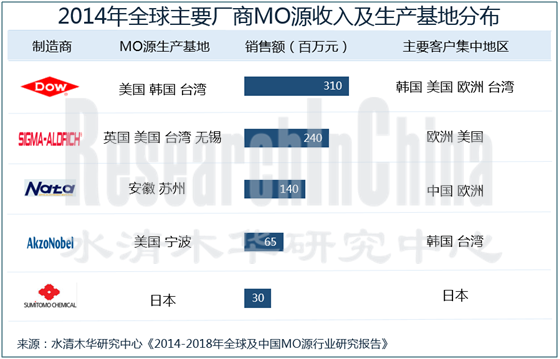
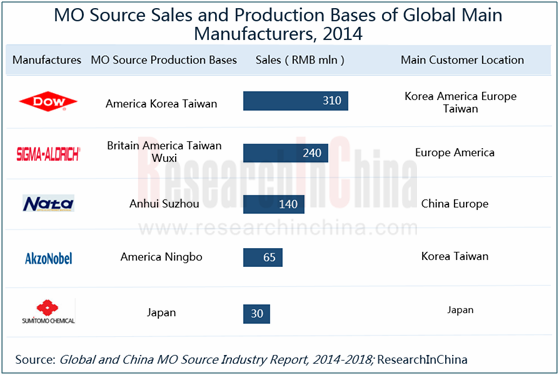
目前,全球MO源市场处于寡头垄断局面。2014年,DOW、SAFC、南大光电和AKZO Nobel等四大制造商的市场份额(按销售额计算)合计约92.2%,其中仅DOW的占比就达到37.8%。而日本的住友化学、韩国的Lake LED Materials以及中国的苏州普耀等企业,虽已形成MO源的规模化生产,但是整体产能较小,全球市场竞争力较弱。
DOW化学:全球最大的MO源制造商,早在30年代就进入中国市场,目前中国已成为陶氏仅次于德国的第二大海外市场。2014年其中国区销售额已达到43亿美元。为了更好的服务大中华区,2012年公司在成都设立销售基地;2014年在哈尔滨和武汉设立销售基地;2015年又计划在新疆设立销售基地(考虑中国“一带一路”的战略布局)。
南大光电:中国最大的MO源制造商,现有MO源产能27.5吨/年。2014年5月,公司投资2,841万元实施“新建1.5吨/年高纯三甲基铟生产线”项目,主要包括一条三甲基铟合成线和两条三甲基铟纯化线。
水清木华研究中心《2014-2018年全球及中国MO源行业研究报告》着重研究了以下内容:
 全球稀MO源供给、需求、竞争格局等情况; 全球稀MO源供给、需求、竞争格局等情况;
中国MO源发展环境、供应、需求、价格走势等情况;
中国MO源上下游产业现状等;
全球及中国8家主要MO源制造商经营情况、收入结构、MO源业务现状等。
As the backing material of MOCVD, MOMBE and other semiconductor microstructures, MO source (also known as high-purity metal organic compound) is widely used in LED (accounting for about 90% of the demand), solar cells, phase change memory, radio-frequency integrated circuit (RFIC) chips, etc.
The global demand for MO source was small prior to 2009, with a basic balance between market supply and demand. In 2009-2011, the explosive growth in the LED industry propelled the demand for MO source to grow swiftly, resulting in the global oligopoly and the gap of about 4.8 tons in 2011. After 2012, the slowdown of the LED market and new capacity release of major companies led to the oversupply worldwide.
China is one of the world's major MO source producers and consumers. In 2014, China’s MO source capacity hit 28.5 tons, making up about 30% of the global total; it is expected to jump to 33.6 tons in 2015. China’s demand for MO source attained 23.5 tons in 2014, occupying around 40.4% of the global; driven by the continued growth in MOCVD shipment, the demand is expected to reach 32.7 tons in 2015.
Currently, the global MO source market is dominated by several tycoons. In 2014, DOW, SAFC, Nata Opto-electronic and AKZO Nobel eyed a combined market share of about 92.2% (by sales); particularly DOW grasped 37.8% alone. Japan-based Sumitomo Chemical, South Korea-based Lake LED Materials and China-based Suzhou Puyao have formed sizable production of MO source, but their capacity is not high enough, so they are still weak in the global competition.
DOW is the largest MO source manufacturer in the world. It entered the Chinese market as early as 1930s, and now China has become its second-largest overseas market following Germany with the sales contribution of RMB4.3 billion in 2014. To serve the Greater China region better, DOW set up a sales base in Chengdu in 2012; it erected sales bases in Harbin and Wuhan in 2014; in 2015, it plans to establish a sales base in Xinjiang (according to China’s "The Belt and Road Initiative" strategic layout).
Jiangsu Nata Opto-electronic Material Co., Ltd. is China's largest MO source company with an existing capacity of 27.5 t/a. In May 2014, the company invested RMB28.41 million in a new 1.5 t/a high-purity trimethyl indium production line project, consisting of a trimethyl indium synthetic line and two trimethyl indium purification lines.
The report focuses on the followings:
 Global MO source supply, demand, competition pattern, etc.; Global MO source supply, demand, competition pattern, etc.;
China’s MO source development environment, supply, demand, price, etc.;
Status quo of Chinese MO source upstream and downstream industries;
Operation, revenue structure, MO source business, etc. of eight MO companies at home and abroad.
第一章 MO源行业概述
1.1 MO源简介
1.2 分类及应用
1.3 产业链
1.4 行业特性
1.4.1 高集中度
1.4.2 高成长性
第二章 全球MO源行业发展情况
2.1 全球MO源行业发展概况
2.2 供给
2.3 需求
2.3.1 下游需求恢复增长
2.3.2 中上游产能逐渐消化
2.3.3 需求量
2.3.4 需求结构
2.4 市场竞争格局
2.5 美国
2.6 台湾
2.7 韩国
2.8 欧洲
2.9 日本
第三章 中国MO源行业发展情况
3.1 发展环境
3.1.1 政策环境
3.1.2 贸易环境
3.1.3 技术环境
3.2 供应
3.2.1 MO源产能
3.2.2 产能结构
3.3 需求
3.4 价格走势
第四章 中国MO源上下游行业分析
4.1 MO源上游行业
4.1.1 镓
4.1.2 铟
4.1.3 相关政策及影响
4.2 LED行业
4.2.1 LED市场规模
4.2.2 MOCVD及LED芯片市场
4.2.3 LED封装市场
4.2.4 LED应用市场
4.2.5 竞争格局
4.3 其他下游行业
4.3.1 新型太阳能电池
4.3.2 箱变存储器
4.3.3 半导体激光器
4.3.4 射频集成电路芯片
第五章 全球MO源主要生产企业
5.1 陶氏化学 (DOW)
5.1.1 公司简介
5.1.2 经营情况
5.1.3 营收构成
5.1.4 MO源业务
5.1.5 在华业务
5.2 西格玛奥瑞奇(Sigma-Aldrich)
5.2.1 公司简介
5.2.2 经营情况
5.2.3 SAFC Hitech-MO源业务
5.2.4 在华业务
5.3 阿克苏诺贝尔 (AKZO Nobel)
5.3.1 公司简介
5.3.2 经营情况
5.3.3 营收构成
5.3.4 MO源业务
5.3.5 在华业务
5.4 住友化学 (Sumitomo Chemical)
5.4.1 公司简介
5.4.2 经营情况
5.4.3 营收构成
5.4.4 MO源业务
5.4.5 在华业务
5.5 Albemarle
5.5.1 公司简介
5.5.2 经营情况
5.5.3 营收构成
5.5.4 MO源业务
5.5.5 在华业务
5.6 Chemtura
5.6.1 公司简介
5.6.2 经营情况
5.6.3 营收构成
5.6.4 MO源业务
5.6.5 在华业务
5.7 Lake LED Materials
5.7.1 公司简介
5.7.2 MO源业务
5.8 南大光电
5.8.1 公司简介
5.8.2 经营情况
5.8.3 营收构成
5.8.4 毛利率
5.8.5 产销
5.8.6 重点项目
第六章 总结与预测
6.1 市场
6.2 企业
1 Overview of MO Source Industry
1.1 Introduction
1.2 Classification and Application
1.3 Industry Chain
1.4 Industry Characteristics
1.4.1 High Concentration
1.4.2 High Growth
2 Development of Global MO Source Industry
2.1 Overview
2.2 Supply
2.3 Demand
2.3.1 Downstream Demand Restores Growth
2.3.2 Midstream & Upstream Capacity Gradually Digested
2.3.3 Quantity Demanded
2.3.4 Demand Structure
2.4 Competition Pattern
2.5 USA
2.6 Taiwan
2.7 South Korea
2.8 Europe
2.9 Japan
3 Development of MO Source Industry in China
3.1 Development Environment
3.1.1 Policy Environment
3.1.2 Trade Environment
3.1.3 Technical Environment
3.2 Supply
3.2.1 Production Capacity
3.2.2 Capacity Structure
3.3 Demand
3.4 Price Trend
4 Upstream and Downstream Sectors of MO Source in China
4.1 Upstream Sectors
4.1.1 Gallium
4.1.2 Indium
4.1.3 Policies and the Influence
4.2 LED Industry
4.2.1 LED Market Scale
4.2.2 MOCVD and LED Chip Market
4.2.3 LED Encapsulation Market
4.2.4 LED Application Market
4.2.5 Competition Pattern
4.3 Other Downstream Sectors
4.3.1 New Solar Cell
4.3.2 Phase Change Memory
4.3.3 Semiconductor Laser
4.3.4 RFIC Chip
5 Key Enterprises Worldwide
5.1 DOW
5.1.1 Profile
5.1.2 Operation
5.1.3 Revenue Structure
5.1.4 MO Source Business
5.1.5 Business in China
5.2 Sigma-Aldrich
5.2.1 Profile
5.2.2 Operation
5.2.3 SAFC Hitech-MO Source Business
5.2.4 Business in China
5.3 AKZO Nobel
5.3.1 Profile
5.3.2 Operation
5.3.3 Revenue Structure
5.3.4 MO Source Business
5.3.5 Business in China
5.4 Sumitomo Chemical
5.4.1 Profile
5.4.2 Operation
5.4.3 Revenue Structure
5.4.4 MO Source Business
5.4.5 Business in China
5.5 Albemarle
5.5.1 Profile
5.5.2 Operation
5.5.3 Revenue Structure
5.5.4 MO Source Business
5.5.5 Business in China
5.6 Chemtura
5.6.1 Profile
5.6.2 Operation
5.6.3 Revenue Structure
5.6.4 MO Source Business
5.6.5 Business in China
5.7 Lake LED Materials
5.7.1 Profile
5.7.2 MO Source Business
5.8 Nata Opto-electronic
5.8.1 Profile
5.8.2 Operation
5.8.3 Revenue Structure
5.8.4 Gross Margin
5.8.5 Production and Sales
5.8.6 Key Projects
6 Summary and Forecast
6.1 Market
6.2 Enterprises
图:MO源应用领域
图:MO源产业链
表:MO源在LED生产过程中的占比
图:2010-2015年全球MO源供应量
图:2008-2015年全球LED背光(分领域)渗透率
图:2012-2015年全球LED电视背光总产值
图:2010-2015年全球高亮度LED产品产值及增长率
图:2010-2018年全球新增MOCVD数量及保有量
图:2014年全球MOCVD(分地区)保有量构成
表:MOCVD单机对MO源的需求量
图:2010-2018年全球MO源需求量
图:2010-2015年全球MO源(分行业)需求量构成
图:2015年全球MO源(分地区)产能构成
图:2009-2015年台湾新增MOCVD数量
图:2009-2015年韩国新增MOCVD数量
表:日本MO源产品生产基地及主要客户
图:日本LED产业分布
表:2011-2014年中国MO源行业相关政策
图:2010-2015年中国MO源产能
图:2010-2015年中国MO源(分产品)产能构成
图:2014年中国MO源制造商竞争格局
表:2014年主要LED行业兼并案
图:2010-2015年中国地方政府MOCVD采购计划
图:2010-2018年中国MO源需求量
图:2009-2015年中国MO源产品平均价格
图:2010-2015年中国镓(纯度≥99.99%)价格
图:2014年全球铟消费结构
表:2009-2014年中国铟产销量
图:2010-2015年中国市场铟(纯度≥99.99%)价格
图:LED产业链
图:2005-2014年LED产业驱动因素
图:2010-2015年中国LED行业总产值及增速
图:2010-2018年中国MOCVD保有量及增速
图:2012-2014年中国MOCVD产能利用率和开机率
图:2010-2015年中国LED外延芯片产值及增速
表:中国主要LED外延芯片制造商
图:2010-2015年中国LED封装行业产值及增速
图:2013-2014年LED(分应用领域)产值结构
表:中国LED行业主要生产商及其业务
表:不同类型太阳能电池性能对比
图:2010/2015/2020年中国砷化镓太阳能电池产量
图:2010-2015年陶氏化学销售收入及净利润
图:2014年陶氏化学(分业务)收入构成
表:陶氏化学电子材料业务生产基地
图:2010-2014年陶氏化学电子及功能性材料业务收入
图:2014年陶氏化学电子材料业务(分地区)收入构成
图:2014年陶氏化学电子材料部门(分业务)收入构成
图:2009-2015年西格玛奥瑞奇销售收入及净利润
图:2011-2014年西格玛奥瑞奇(分业务)收入构成
图:2014年西格玛奥瑞奇(分地区入构成
图:2011-2015年SAFC销售收入及增速
表:SAFC的MO源生产基地分布
图:2009-2015年阿克苏诺贝尔收入及净利润
图:2012-2015年阿克苏诺贝尔(分业务)收入构成
图:2014年阿克苏诺贝尔(分地区)收入构成
图:2012-2014年阿克苏诺贝尔功能化学业务收入
图:2014年阿克苏诺贝尔功能化学业务(分地区)收入构成
图:2010-2015年阿克苏诺贝尔中国区收入及增速
表:阿克苏诺贝尔(中国)功能化学产品生产基地分布
图:2009-2014财年住友化学收入及净利润
图:2009-2014财年住友化学(分业务)收入
表:住友化学分公司及其主要业务
图:Albemarle全球布局
图:2010-2015年Albemarle 收入及净利润
表:2009-2014年Albemarle(分业务)收入
图:Albemarle在华布局
图:Chemtura全球布局
图:2009-2014年Chemtura销售收入及净利润
图:2014年Chemtura(分业务)收入
图:2014年Chemtura(分地区)收入构成
表:Lake LED Materials主要MO源产品
图:2015年南大光电股权结构
图:2009-2015年南大光电销售收入及净利润
图:2009-2014年南大光电(分产品)收入
图:2009-2014年南大光电(分地区)收入
图:2009-2014年南大光电分产品毛利率
表:2010-2014年南大光电(分产品)销量及单价
表:2014年南大光电主要项目
表:2010-2015年南大光电产能
图:2010-2018年全球及中国MO源需求量增速
图:2010-2015年中国LED芯片及封装总产值增速
图:2010-2015年全球主要MO源制造商营收增速
图:2014年全球MO源制造商竞争格局
Application of MO Source
Industrial Chain of MO Source
Proportion of MO Source in LED Production Process
Global MO Source Supply, 2010-2015
Global LED Backlight Penetration Rate by Field, 2008-2015
Global TV LED Backlight Output Value, 2012-2015
Output Value and Growth Rate of Global HB LED Products, 2010-2015
Number of Newly Added MOCVD Machines and Ownership Worldwide, 2010-2018E
Global MOCVD Ownership by Region, 2014
Demand of MOCVD Standalone for MO Source
Global MO Source Demand, 2010-2018E
Global MO Source Demand by Industry, 2010-2015
Global MO Source Capacity by Region, 2015
Number of Newly Added MOCVD Machines in Taiwan, 2009-2015
Number of Newly Added MOCVD Machines in South Korea, 2009-2012
Production Bases and Major Customers of MO Source in Japan
Distribution of Japanese LED Industry
Policies about MO Source Industry in China, 2011-2014
Capacity of MO Source in China, 2010-2015
Capacity of MO Source in China by Product, 2010-2015
Competition Pattern of Chinese MO Source Companies, 2014
Major M&A Cases in LED Industry, 2014
MOCVD Purchase Plan of China's Local Governments, 2010-2015
Demand for MO Source in China, 2010-2018E
Average Price of MO Source Products in China, 2009-2015
Price of Gallium (Purity ≥99.99%) in China, 2010-2015
Global indium consumption structure, 2014
Output and Sales Volume of Indium in China, 2009-2014
Market Price of Indium (Purity ≥99.99%) in China, 2010-2015
LED Industry Chain
Driving Factors of LED Industry, 2005-2014
Total Output Value and Growth Rate of LED Industry in China, 2010-2015
Ownership and Growth Rate of MOCVD Machines in China, 2010-2018E
MOCVD Capacity Utilization and Operating Rate in China, 2012-2014
Output Value and Growth Rate of LED Epitaxial Chip in China, 2010-2015
Major LED Epitaxial Chip Companies in China
Output Value and Growth Rate of LED Encapsulation Industry in China, 2010-2015
LED Output Value by Application, 2013-2014
Business of Key LED Companies in China
Performance Comparison of Different Types of Solar Cells
Output of GaAs Solar Cell in China, 2010/2015/2020
Sales and Net Income of Dow, 2010-2015
Revenue Structure of Dow by Business, 2014
Production Bases of Dow Electronic Materials
Revenue of Electronic & Functional Materials of Dow, 2010-2014
Revenue of Dow's Electronic Materials Division by Region, 2014
Revenue of Dow's Electronic Materials Division by Business, 2014
Sales and Net Income of Sigma-Aldrich, 2009-2015
Revenue Structure of Sigma-Aldrich by Business, 2011-2014
Revenue Structure of Sigma-Aldrich by Region, 2014
Sales and Growth Rate of SAF, 2011-2015
MO Source Production Bases of SAFC Hitech
Revenue and Net Income of AKZO Nobel, 2009-2015
Revenue Structure of AKZO Nobel by Business, 2012-2015
Revenue Structure of AKZO Nobel by Region, 2014
Revenue of AKZO Nobel's Functional Chemicals, 2012-2014
Revenue Structure of AKZO Nobel's Functional Chemicals by Region, 2014
Revenue and Growth Rate of AKZO Nobel in China, 2010-2015
Production Bases of Functional Chemical Products of AKZO Nobel in China
Revenue and Net Income of Sumitomo Chemical, FY2009- FY2014
Revenue of Sumitomo Chemical by Business, FY2009-FY2014
Branch Companies of Sumitomo Chemical and Their Primary Business
Albemarle’s Global Layout
Revenue and Net Income of Albemarle, 2010-2015
Revenue of Albemarle by Business, 2009-2014
Albemarle’s Layout in China
Chemtura’s Global Layout
Sales and Net Income of Chemtura, 2009-2014
Revenue of Chemtura by Business, 2014
Revenue Structure of Chemtura by Region, 2014
Main MO Source Products of Lake LED Materials
Equity Structure of Nata Opto-electronic, 2015
Revenue and Net Income of Nata Opto-electronic, 2009-2015
Revenue of Nata Opto-electronic by Product, 2009-2014
Revenue of Nata Opto-electronic by Region, 2009-2014
Gross Margin of Nata Opto-electronic by Product, 2009-2014
Sales Volume and Unit Price of Nata Opto-electronic, 2010-2014
Key Projects of Nata Opto-electronic, 2014
Capacity of Nata Opto-electronic, 2010-2015
Global and Chinese MO Source Demand Growth Rate, 2010-2018E
Growth Rate of LED Chip and Encapsulation Output Value in China, 2010-2015
Revenue Growth Rate of Major Global MO Source Companies, 2010-2015
Competition Pattern of Global MO Source Companies, 2014
如果这份报告不能满足您的要求,我们还可以为您定制报告,请 留言说明您的详细需求。
|