|
|
|
报告导航:研究报告—
制造业—材料
|
|
2014-2017年全球及中国光纤预制棒行业研究报告 |
 |
字数:3.6万 |
页数:102 |
图表数:128 |
|
中文电子版:8500元 |
中文纸版:4250元 |
中文(电子+纸)版:9000元 |
|
英文电子版:2350美元 |
英文纸版:2500美元 |
英文(电子+纸)版:2650美元 |
|
编号:ZHP025
|
发布日期:2015-07 |
附件:下载 |
 |
|
|
光纤预制棒就是用于拉光纤的玻璃特种预制大棒,是光纤制造的核心原材料。在光纤产业链中,光纤预制棒、光纤、光缆所占整个产业链的利润之比为7:2:1。
2014年,全球光纤预制棒产能为1.3万吨,主要集中在美国、日本和中国(三国产能合计占比高达85.2%)。其中,中国以39.8%的占比位居全球第一。中国除了是光纤预制棒生产大国,还是消费大国。2014年,中国光纤预制棒的需求量为6,639吨,占全球需求总量的60.9%,预计2015年增长至7,144吨。
受技术限制,2010年之前中国光纤预制棒需求的70%以上依靠进口。近几年,随着国内主流厂商自主研发能力的提升,中国光纤预制棒的生产能力不断提高。2014年中国光纤预制棒的自给率已经从2007年的20.0%增长至64.4%,预计2015年将达到72.6%。
2014年3月,商务部决定对原产于日本和美国的光纤预制棒进行反倾销调查。2015年5月,初裁结果显示:中国海关将根据初裁确定的倾销幅度(7.8%-39.0%)对进口自日本和美国的光纤预制棒征收保证金。受此影响,中国光纤预制棒进口量在2014年首次出现负增长(-9.5%),2015年有望持续下滑(1-5月同比下滑8.7%)。
全球光纤预制棒行业集中度相对较高,2014年前5大制造商(包含中国厂商1家、美国厂商2家、日本厂商2家)市场份额合计为59.4%。其中,中国的长飞公司以13.3%的市场份额位居第一;美国的康宁公司则以12.9%的占有率位居第二。
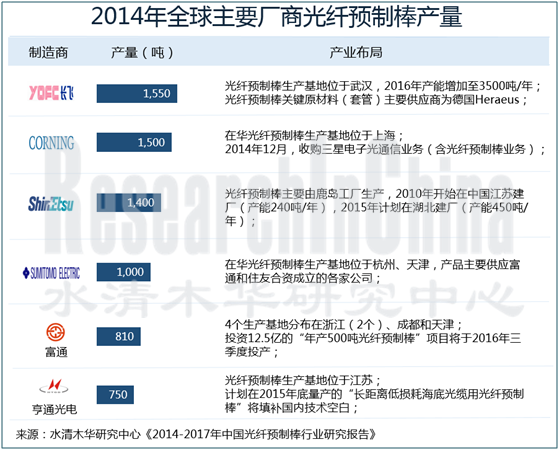
长飞公司:2015年6月,与信越化工签订协议成立合资公司(位于潜江市),计划于8月份成立,主要生产光纤预制棒,设计产能450吨/年。
康宁公司:2014年在中国区销售额为18.9亿美元,占公司总收入的19.5%。截止2014年,康宁在中国已经设了9个生产工厂,其中包括一个光纤预制棒生产工厂,位于上海。
住友电工:在华光纤预制棒业务主要与富通集团合作开展,双方合资设有两个光纤预制棒生产基地——富通住电光纤(杭州)有限公司和富通住电光纤(天津)有限公司。其中,天津生产基地于2014年8月投产,是中国北方地区第一个光纤预制棒项目。
亨通光电:2014年12月,成功研制出直径200毫米、长6米、单棒拉丝1.5万公里的光棒,成功刷新全球记录;2015年2月, 公司“长距离低损耗海底光缆用光纤预制棒的研发及产业化”项目取得重大技术突破,预计年底实现量产。
水清木华研究中心《2014-2017年全球及中国光纤预制棒行业研究报告》着重研究了以下内容:
 全球稀光纤预制棒供给、需求、竞争格局、价格走势等情况; 全球稀光纤预制棒供给、需求、竞争格局、价格走势等情况;
中国光纤预制棒政策环境、供需、竞争格局、进出口、价格走势等情况;
国外7家主要光纤预制棒制造商经营情况、收入结构、光纤预制棒业务现状、在华发展等情况;
中国6家主要光纤预制棒制造商经营情况、收入结构、毛利率、光纤预制棒业务等情况。
第一章 光纤预制棒概述
1.1 定义
1.2 生产工艺
1.3 产业链
1.3.1 上游
1.3.2 下游
第二章 全球光纤预制棒行业发展概况
2.1 发展现状
2.2 供需分析
2.2.1 供给
2.2.2 需求
2.3 地区结构
2.3.1 美国
2.3.2 日本
2.3.3 欧洲
2.4 价格走势
第三章 中国光纤预制棒行业发展概况
3.1 政策环境
3.2 供需分析
3.2.1 供给分析
3.2.2 需求分析
3.3 竞争格局
3.4 进出口
3.4.1 进口
3.4.2 出口
3.5 价格走势
3.5.1 上下游价格
3.5.2 光纤预制棒价格
第四章 全球光纤预制棒生产企业
4.1 康宁公司
4.1.1 企业简介
4.1.2 经营情况
4.1.3 营收构成
4.1.4 研发与投资
4.1.5 光纤预制棒业务
4.1.6 在华发展
4.2 住友电工
4.2.1 企业简介
4.2.2 经营情况
4.2.3 光纤预制棒业务
4.2.4 在华发展
4.3 信越化工
4.3.1 企业简介
4.3.2 经营情况
4.3.3 营收构成
4.3.4 光纤预制棒业务
4.3.5 在华发展
4.4 日本藤仓
4.4.1 企业简介
4.4.2 经营情况
4.4.3 营收构成
4.4.4 光纤预制棒业务
4.4.5 在华发展
4.5 普瑞斯曼
4.5.1 公司简介
4.5.2 经营情况
4.5.3 营收构成
4.5.4 光纤预制棒业务
4.5.5 在华发展
4.6 古河电力
4.6.1 公司简介
4.6.2 经营情况
4.6.3 营收构成
4.6.4 光纤预制棒业务
4.6.5 在华发展
4.7 特恩驰
4.7.1 企业简介
4.7.2 经营情况
4.7.3 营收构成
4.7.4 光纤预制棒业务
4.7.5 在华发展
第五章 中国光纤预制棒生产企业
5.1 长飞公司
5.1.1 企业简介
5.1.2 经营情况
5.1.3 营收构成
5.1.4 毛利率
5.1.5 光纤预制棒业务
5.2 亨通光电
5.2.1 企业简介
5.2.2 经营情况
5.2.3 营收构成
5.2.4 毛利率
5.2.5 研发
5.2.6 光纤预制棒业务
5.3 中天科技
5.3.1 企业简介
5.3.2 经营情况
5.3.3 营收构成
5.3.4 毛利率
5.3.5 客户与供应商
5.3.6 研发与投资
5.3.7 光纤预制棒业务
5.4 烽火通信
5.4.1 企业简介
5.4.2 经营情况
5.4.3 营收构成
5.4.4 毛利率
5.4.5 研发与投资
5.4.6 光纤预制棒业务
5.5 富通集团
5.5.1 企业简介
5.5.2 经营情况
5.5.3 营收构成
5.5.4 毛利率
5.5.5 在建项目
5.5.6 光纤预制棒业务
5.6 普法公司
5.6.1 企业简介
5.6.2 在建工程
5.6.3 光纤预制棒业务
第六章 总结与预测
6.1 市场
6.2 企业
1. Overview of Optical Fiber Preform
1.1 Definition
1.2 Production Technology
1.3 Industry Chain
1.3.1 Upstream
1.3.2 Downstream
2. Development of Global Optical Fiber Preform Industry
2.1 Status Quo
2.2 Supply & Demand
2.2.1 Supply
2.2.2 Demand
2.3 Regional Structure
2.3.1 USA
2.3.2 Japan
2.3.3 Europe
2.4 Price Trend
3. Development of China Optical Fiber Preform Industry
3.1 Policy Environment
3.2 Supply & Demand
3.2.1 Supply
3.2.2 Demand
3.3 Competition Pattern
3.4 Import & Export
3.4.1 Import
3.4.2 Export
3.5 Price Trend
3.5.1 Upstream & Downstream
3.5.2 Optical Fiber Preform
4. Global Optical Fiber Preform Companies
4.1 Corning
4.1.1 Profile
4.1.2 Operation
4.1.3 Revenue Structure
4.1.4 R&D and Investment
4.1.5 Optical Fiber Business
4.1.6 Development in China
4.2 Sumitomo Electric Industries
4.2.1 Profile
4.2.2 Operation
4.2.3 Optical Fiber Business
4.2.4 Development in China
4.3 Shin-Etsu Chemical
4.3.1 Profile
4.3.2 Operation
4.3.3 Revenue Structure
4.3.4 Optical Fiber Business
4.3.5 Development in China
4.4 Fujikura
4.4.1 Profile
4.4.2 Operation
4.4.3 Revenue Structure
4.4.4 Optical Fiber Business
4.4.5 Development in China
4.5 Prysmian
4.5.1 Profile
4.5.2 Operation
4.5.3 Revenue Structure
4.5.4 Optical Fiber Business
4.5.5 Development in China
4.6 Furukawa Electric
4.6.1 Profile
4.6.2 Operation
4.6.3 Revenue Structure
4.6.4 Optical Fiber Business
4.6.5 Development in China
4.7 NV Twentsche Kabel Holding (TKH)
4.7.1 Profile
4.7.2 Operation
4.7.3 Revenue Structure
4.7.4 Optical Fiber Business
4.7.5 Development in China
5. Chinese Optical Fiber Preform Companies
5.1 Yangtze Optical Fibre and Cable Company Ltd. (YOFC)
5.1.1 Profile
5.1.2 Operation
5.1.3 Revenue Structure
5.1.4 Gross Margin
5.1.5 Optical Fiber Business
5.2 Hengtong Optic-electric Co., Ltd.
5.2.1 Profile
5.2.2 Operation
5.2.3 Revenue Structure
5.2.4 Gross Margin
5.2.5 R&D
5.2.6 Optical Fiber Business
5.3 Jiangsu Zhongtian Technology Co., Ltd.
5.3.1 Profile
5.3.2 Operation
5.3.3 Revenue Structure
5.3.4 Gross Margin
5.3.5 Clients and Suppliers
5.3.6 R&D and Investment
5.3.7 Optical Fiber Business
5.4 FiberHome Telecommunication Technologies Co., Ltd.
5.4.1 Profile
5.4.2 Operation
5.4.3 Revenue Structure
5.4.4 Gross Margin
5.4.5 R&D and Investment
5.4.6 Optical Fiber Business
5.5 Futong Group
5.5.1 Profile
5.5.2 Operation
5.5.3 Revenue Structure
5.5.4 Gross Margin
5.5.5 Projects under Construction
5.5.6 Optical Fiber Business
5.6 Potevio Fasten Optical Communication Co., Ltd.
5.6.1 Profile
5.6.2 Projects under Construction
5.6.3 Optical Fiber Business
6. Summary and Forecast
6.1 Market
6.2 Enterprises
图:光纤预制棒芯棒和包层示意图
表:光纤预制棒芯棒制造工艺对比
图:2014年全球光纤预制棒芯棒工艺分布比例
表:中国光纤预制棒芯棒工艺对比
图:2014年中国光纤预制棒成本结构
图:光纤预制棒下游产业链
图:2010-2017年全球光纤预制棒产能与产量
图:2010-2017年全球光纤预制棒需求量
表:2010-2014年全球光纤预制棒(分国家/地区)产能及市场份额
图:2010-2014年全球(分国家/地区)光纤预制棒需求量
表:2010-2014年美国光纤预制棒产能、产量与需求量
表:2010-2014年美国光纤预制棒出口情况
表:2010-2014年日本光纤预制棒产能、产量与需求量
表:2010-2014年日本光纤预制棒出口情况
图:2000-2014年全球光纤预制棒价格
表:2010-2015年中国光纤预制棒行业相关政策
表:2015年中国光纤预制棒反倾销结果
图:2007-2017年中国光纤预制棒产量及同比增长
表:2014-2016年中国光纤预制棒主要建设项目
图:2010-2017年中国光纤预制棒需求量及同比增长
图:2007-2015年中国光纤预制棒自给率
表:中国光纤预制棒主要生产企业股东构成及使用技术
表:2013-2014年中国主要光纤预制棒企业光棒、光纤、光缆产能与产量
图:2010-2015年中国光纤预制棒进口量及同比增长
图:2013-2014年中国光纤预制棒(分国家)进口量构成
图:2010-2015年中国光纤预制棒进口金额及同比增长
图:2010-2015年中国光纤预制棒出口量及同比增长
图:2013-2014年中国光纤预制棒(分国家)出口量构成
图:2010-2015年中国光纤预制棒出口金额及同比增长
图:2004-2015年中国光纤光缆集中采购价格
图:2010-2015年中国光纤预制棒平均价格
图:2009-2015年康宁营业收入与净利润
表:2012-2014年康宁公司(分产品)营业收入及构成
表:2010-2014年康宁公司(分地区/国家)营业收入及构成
图:2009-2014年康宁研发投入与占比
图:2011-2014年康宁电信业务部(分产品)营业收入
图:2009-2014年康宁公司在中国营业收入及占比
图:FY2008-FY2015年住友电工销售额及净利润
图:FY2008-FY2015年住友电工(分业务)销售额
图:FY2008-FY2014年住友电工(分地区)销售额
图:2013-2015财年住友电工信息与通信业务销售额
图:2011-2015财年住友电工在华销售额
图:2009-2014年成都中住光纤营业收入
图:2014年信越化工(分部门)产品
图:2011-2015财年信越化工营业收入与净利润
图:2015年信越化工全球投资现状
图:2014-2015财年信越化工(分业务)销售额构成
表:2013-2015年信越化工(分地区)销售额及构成
图:2010-2015财年信越化工电子与功能材料部门营业收入与营业利润
图:FY2012-FY2015年信越化工在中国营业收入及占比
表:2015年信越化工在华新设合资公司概况
图:2009-2014财年日本藤仓销售额与净利润
表:2012-2014财年藤仓(分业务)销售额及构成
表:2011-2014财年日本藤仓(分地区)销售额及构成
图:2011-2014财年藤仓在华销售额
图:2011-2014年藤仓烽火光电材料公司营业收入与净利润
图:2014年普瑞斯曼股权结构
图:普瑞斯曼全球布局
图:2007-2014年普瑞斯曼销售收入及净利润
图:截止2014年普瑞斯曼全球研发中心分布
图:2012-2014年普瑞斯曼(分业务)收入构成
图:2014年普瑞斯曼(分地区)营业收入构成
表:普瑞斯曼在中国子公司分布
图:普瑞斯曼在华布局
图:古河电工全球布局
图:2007-2015财年古河电工净收入及营业利润
图:2014财年古河电工(分业务)净收入构成
图:FY2010-FY2015年古河电力电信业务销售额及营业利润
表:FY2012-FY2014年古河电力电信业务(分产品)销售额及构成
图:特恩驰全球布局
图:2009-2015年特恩驰营业收入与净利润
表:2012-2014年特恩驰(分业务)收入构成
图:2012-2014年特恩驰(分地区)收入构成
图:特恩驰公司电信业务模式及市场
图:2015年长飞光纤光缆股权结构
图:长飞光纤光缆业务结构
图:2007-2014年长飞光纤光缆营业收入与净利润
图:2011-2014年长飞光纤光缆(分产品)营业收入构成
图:2011-2014年长飞光纤光缆(分地区)主营业务收入
图:2011-2014年长飞光纤光缆(分产品)毛利率
图:2006-2014年长飞光纤光缆(光纤预制棒)产量及增速
表:长飞光纤光缆主要原材料供应商
图:2015年亨通光电股权结构
图:亨通光电全球营销网络
图:2008-2015年亨通光电营业收入与净利润
表:2011-2014年亨通光电(分产品)产销量及产销率
图:2011-2014年亨通光电(分产品)营业收入
图:2009-2014年亨通光电(分地区)营业收入
图:2011-2014年亨通光电光通信产品毛利率
图:2009-2014年亨通光电研发费用及占比
图:2010-2015年亨通光电光纤预制棒产能
图:2010-2014年亨通光电光纤预制棒产量与销量
图:2015年中天科技股权结构
图:2008-2014年中天科技营业收入与净利润
图:2009-2014年中天科技(分产品)营业收入
图:2008-2014年中天科技(分地区)营业收入
图:2008-2014年中天科技(分产品)毛利率
表:2009-2014年中天科技前五名客户营业收入贡献及占比
表:2009-2014年中天科技前五名供应商采购金额及占比
图:2009-2014年中天科技研发费用及占比
图:2010-2014年中天科技光纤预制棒产量
图:2015年烽火通信股权结构
图:2008-2015年烽火通信营业收入和净利润
图:2008-2014年烽火通信(分产品)营业收入
图:2008-2014年烽火通信(分地区)营业收入
图:2008-2014年烽火通信(分产品)毛利率
表:2011-2014年烽火通信研发投入及占比
表:2014年烽火通信主要光纤预制棒生产公司净利润
图:2010-2014年烽火通信光纤预制棒产量
图:2015年富通集团股权结构
图:富通集团生产基地分布
图:2009-2015年富通集团营业收入与净利润
图:富通集团全球营销网络
图:2010-2015年富通集团(分业务)营业收入
图:2009-2015年富通集团(分业务)毛利率
表:2015年富通集团主要在建项目
表:富通集团光纤预制棒生产基地
图:2009-2015年富通集团光纤预制棒产能及产量
图:2011-2015年年富通集团光纤预制棒均价
表:2014年富通集团光纤预制棒主要原材料供应商
图:2015年普法公司股权结构
图:2006-2014年普法公司光纤预制棒自产能与产量
图:2014年全球光纤预制棒产能结构
图:2011-2017年全球及中国光纤预制棒需求增速
图:2011-2015年中国光纤预制棒进出口(量)增速
图:2009-2015年全球主要光纤预制棒企业营收增速
图:2014年全球光纤预制棒市场竞争格局
图:2014年中国光纤预制棒市场竞争格局
Optical Fiber Preform Mandrel and Cladding Diagram
Manufacturing Process Comparison of Optical Fiber Preform Mandrel
Optical Fiber Preform Mandrel Process Distribution Proportion, 2014
Manufacturing Process Comparison of Optical Fiber Preform Mandrel
China’s Optical Fiber Preform Cost Structure, 2014
Optical Fiber Preform Downstream Industry Chain
Global Optical Fiber Preform Capacity and Output, 2010-2017E
Global Optical Fiber Preform Demand, 2010-2017E
Global Optical Fiber Preform Capacity and Market Share (by Country/Region), 2010-2014
Global Optical Fiber Preform Demand (by Country/Region), 2010-2014
U.S. Optical Fiber Preform Capacity, Output and Demand, 2010-2014
U.S. Optical Fiber Preform Exports, 2010-2014
Japan’s Optical Fiber Preform Capacity, Output and Demand, 2010-2014
Japan’s Optical Fiber Preform Exports, 2010-2014
Global Optical Fiber Preform Price, 2000-2014
Policies on Optical Fiber Preform Industry in China, 2010-2015
Results of China’s Anti-dumping Actions on Imported Optical Fiber Preform, 2015
China’s Optical Fiber Preform Output and YoY Growth, 2007-2017E
Main Optical Fiber Preform Projects in China, 2014-2016
China’s Optical Fiber Preform Demand and YoY Growth, 2010-2017
China’s Self-sufficiency Rate in Optical Fiber Preform, 2007-2015
Stockholder Structure and Used Technologies of Major Chinese Optical Fiber Preform Manufacturers
Optical Wand, Fiber, and Cable Capacity and Output of Major Optical Fiber Preform Enterprises in China, 2013-2014
Import Volume and YoY Growth of Optical Fiber Preform in China, 2010-2015
Import Structure of Optical Fiber Preform in China by Country, 2013-2014
Import Value and YoY Growth of Optical Fiber Preform in China, 2010-2015
Export Volume and YoY Growth of Optical Fiber Preform in China, 2010-2015
Export Structure of Optical Fiber Preform in China by Country, 2013-2014
Export Value and YoY Growth of Optical Fiber Preform, 2010-2015
Centralized Procurement Price for Optical Fiber and Cable in China, 2004-2015
ASP of Optical Fiber Preform in China, 2010-2015
Corning's Revenue and Net Income, 2009-2015
Corning’s Revenue Structure by Product, 2012-2014
Corning’s Revenue Structure by Country/Region, 2010-2014
Corning’s R&D Costs and % of Net Sales, 2009-2014
Revenue of Corning’s Telecommunications Business Segment by Product, 2011-2014
Corning’s Revenue in China and % of Total Net Sales, 2009-2014
Net Sales and Net Income of Sumitomo Electric Industries, FY2008-FY2015
Revenue of Sumitomo Electric Industries by Business, FY2008-FY2015
Revenue of Sumitomo Electric Industries by Region, FY2008-FY2014
Sumitomo Electric Industries’ Revenue from Information and Communication, FY2013-FY2015
Revenue of Sumitomo Electric Industries in China, FY2011-FY2015
CDSEI’s Revenue, 2009-2014
Products of Shin-Etsu (by Segment), 2014
Net Sales and Net Income of Shin Etsu, FY2011-FY2015
Global Investment of Shin-Etsu, 2015
Revenue Structure of Shin-Etsu (by Segment), FY2014-FY2015
Revenue Structure of Shin-Etsu (by Region), FY2013-FY2015
Net Sales and Operating Income of Electronics & Functional Materials of Shin-Etsu, FY2010-FY2015
Net Sales in China and % of the Total Revenue of Shin-Etsu, FY2012-FY2015
Profile of Joint Venture of Shin-Etsu in China, 2015
Net Sales of Net Income of Fujikura, FY2009-FY2014
Sales Structure of Fujikura (by Segment), FY2012-FY2014
Sales Structure of Fujikura (by Region), FY2012-FY2014
Net Sales of Fujikura in China, FY2011-FY2014
Revenue and Net Income of FFOE, 2011-2014
Equity Structure of Prysmian, 2014
Global Distribution of Prysmian
Sales and Net Income of Prysmian, 2007-2014
Distribution of R&D Centers of Prysmian, As of 2014
Revenue Structure of Prysmian (by Segment), 2012-2014
Revenue Structure of Prysmian (by Region), 2014
Subsidiaries of Prysmian in China
Distribution of Prysmian in China
Global Distribution of Furukawa Electric
Net Revenue and Operating Income of Furukawa Electric, FY2007-FY2015
Net Revenue Structure of Furukawa Electric (by Business), FY2014
Sales and Operating Income of Furukawa Electric’s Telecommunications Service, FY2010-FY2015
Sales Breakdown and Percentage of Furukawa Electric’s Telecommunications Service (by Product), FY2012-FY2014
Global Distribution of TKH
Revenue and Net Income of TKH, 2009-2015
Revenue Breakdown and Percentage of TKH (by Business), 2012-2014
Revenue Structure of TKH (by Region), 2012-2014
Business Model and Markets of TKH’s Telecom Solutions
Ownership Structure of YOFC, 2015
Business Structure of YOFC
Revenue and Net Income of YOFC, 2007-2014
Revenue Structure of YOFC (by Product), 2011-2014
Operating Revenue of YOFC (by Region), 2011-2014
Gross Margin of YOFC (by Product), 2011-2014
(Optical Fiber Preform) Output and YoY of YOFC, 2006-2014
Main Materials Suppliers of YOFC
Equity Structure of Hengtong Optic-Electric, 2015
Global Marketing Networks of Hengtong Optic-Electric
Revenue and Net Income of Hengtong Optic-Electric, 2008-2015
Output, Sales Volume and Sales-output Ratio of Hengtong Optic-Electric (by Product), 2011-2014
Revenue of Hengtong Optic-Electric (by Product), 2011-2014
Revenue of Hengtong Optic-Electric (by Region), 2009-2014
Gross Margin of Hengtong Optic-Electric’s Optical Communication Products, 2011-2014
Hengtong Optic-Electric’s R&D Expenses and % of Total Revenue, 2009-2014
Capacity of Hengtong Optic-Electric’s Optical Fiber Perform, 2010-2015
Output and Sales Volume of Hengtong Optic-Electric’s Optical Fiber Perform, 2010-2014
Equity Structure of Jiangsu Zhongtian Technology, 2015
Revenue and Net Income of Jiangsu Zhongtian Technology, 2008-2015
Revenue Structure of Jiangsu Zhongtian Technology (by Product), 2009-2014
Revenue Structure of Jiangsu Zhongtian Technology (by Region), 2008-2014
Gross Margin of Jiangsu Zhongtian Technology by Product, 2008-2014
Revenue from Top 5 Clients and % of Total Revenue of Jiangsu Zhongtian Technology, 2009-2014
Procurement from Top 5 Suppliers and % of Total Procurement of Jiangsu Zhongtian Technology, 2009-2014
R&D Costs and % of Total Revenue of Jiangsu Zhongtian Technology, 2009-2014
Optical Fiber Preform Output of Jiangsu Zhongtian Technology, 2010-2014
Equity Structure of Fiberhome Telecommunication, 2015
Revenue and Net Income of FiberHome Telecommunication Technologies, 2008-2015
Revenue of FiberHome Telecommunication Technologies (by Product), 2008-2014
Revenue of FiberHome Telecommunication Technologies (by Region), 2008-2014
Gross Margin of FiberHome Telecommunication Technologies by Product, 2008-2014
R&D Costs and % of Total Revenue of FiberHome Telecommunication Technologies, 2011-2014
Net Income of Fiberhome Telecommunication’s Major Optical Fiber Preform Subsidiaries, 2014
Optical Fiber Preform Output of FiberHome Telecommunication Technologies, 2010-2014
Equity Structure of Futong Group, 2015
Production Base Distribution of Futong Group
Revenue and Net Income of Futong Group, 2009-2015
Global Marketing Network of Futong Group
Revenue Structure of Futong Group by Business, 2010-2015
Gross Margin of Futong Group by Business, 2009-2015
Major Projects under Construction of Futong Group, 2015
Optical Fiber Preform Production Bases of Futong Group
Optical Fiber Preform Capacity and Output of Futong Group, 2009-2015
Average Price of Optical Fiber Preform of Futong Group, 2011-2015
Major Raw Materials Suppliers of Optical Fiber Preform of Futong Group, 2014
Equity Structure of PUTIAN-FASTEN, 2015
Optical Fiber Preform Capacity and Output of Potevio FASTEN, 2006-2014
Global Optical Fiber Preform Capacity Structure, 2014
Growth of Global and China’s Demand for Optical Fiber Preform, 2011-2017E
Growth Rate of China's Import and Export Volume of Optical Fiber Preform, 2011-2015
Revenue Growth Rate of Major Global Optical Fiber Preform Enterprises, 2009-2015
Competition Pattern of Global Optical Fiber Preform Market, 2014
Competition Pattern of Chinese Optical Fiber Preform Market, 2014
如果这份报告不能满足您的要求,我们还可以为您定制报告,请 留言说明您的详细需求。
|