|
|
|
报告导航:研究报告—
制造业—汽车
|
|
2015-2020年中国电动客车行业研究报告 |
 |
字数:2.5万 |
页数:124 |
图表数:112 |
|
中文电子版:8500元 |
中文纸版:4250元 |
中文(电子+纸)版:9000元 |
|
英文电子版:2500美元 |
英文纸版:2700美元 |
英文(电子+纸)版:2800美元 |
|
编号:YS010
|
发布日期:2015-07 |
附件:下载 |
 |
|
|
水清木华研究中心《2015-2020年中国电动客车行业研究报告》着重研究了以下内容:
 电动客车推广意义、现状及国内外发展趋势; 电动客车推广意义、现状及国内外发展趋势;
中国电动客车主流技术路线,客车电池、电机、电控产业链现状及趋势;
中国电动客车行业主要的购置环节补贴(税费减免及财政补贴)、使用环节补贴,以及全国各地推广政策;
中国电动客车产销量及未来趋势,主要电动客车企业竞争格局、市场份额、销量预测、投资及产能等;
中国主要12电动客车制造企业技术水平、产销规模、产能及发展战略。
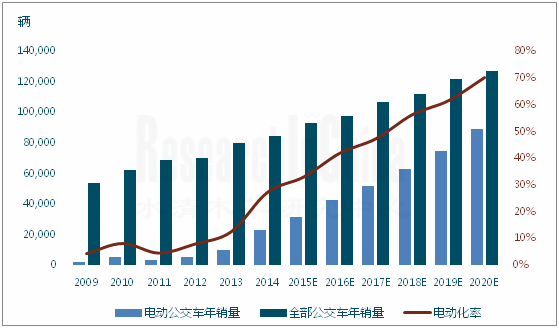
2014年全年电动客车销量2.7万辆,同比增速高达160.3%;2015年上半年电动客车销量接近2万辆,继续保持高速增长。预计到2020年,中国电动客车年销量将达15.4万辆,期间复合增长率(CAGR)33.6%。
目前电动客车主要推广品种是公交客车,销量占比超过85%,目前中国城市公交客车保有量超过50万辆,在城市公共交通中,公交客车分担了城市客运的60%。截至2014年全国电动公交客车保有量超过8万辆。
下一步,国家财政将逐步减少对传统客车的燃油补贴,而将财政支持力度转向电动客车上,这也将大大激励各地方政府将城市新增公交客车替换为电动公交客车。预计到2020年,全国当年新增电动公交客车占全部新增公交客车比例将达到70%,电动公交客车累计保有量将超过30万辆。从技术趋势来看,纯电动公交客车明显受到政策倾斜,将是未来主要发展方向。
除了公交客车,轻型商务客车和旅游客车市场也将是电动客车下一步争夺的市场焦点,新能源营运客车等级评定已在2015年一季度完成,预计2015年将实现3,000辆销量。随着电池技术进步、高速公路充电基础设施的完善,长距离运输将成为可能,预计这一细分市场的引爆点有可能出现在2018年前后。
从电池、电机、电控产业链来看,目前电动客车主要应用LFP动力电池,以及“LFP+超级电容”双电池系统,从2015上半年电动客车所使用电池类型来看,包括“LFP+超级电容”双电池系统在内,LFP动力电池的配置率高达82%。电动客车驱动电机的额定功率大多在80-120kW,异步电机由于可以提供大功率牵引,仍然占据主导地位,永磁同步电机也逐渐在中、轻型客车上开始大量采用。
从企业竞争格局来看,2014年,列前5大的电动客车制造商分别是宇通客车、金龙汽车(包括苏州金龙、厦门金龙联合、厦门金旅三家全资子公司)、比亚迪、南京金龙、中通客车,五家厂商合计产量17,011辆,占比62.5%。
由于电动客车未来市场发展空间巨大,且能大大拉动相关产业链发展。2014年以来,中国电动客车迎来投资热潮,初步统计全国主要客车制造企业公布的电动客车拟投资额超过210亿元,大量产能将到2016-2017年投产。深圳、南京、武汉等城市在这一轮投资中占据先机,引入大量技术领先的客车生产企业入驻。
图:2009-2017年中国电动公交客车产量及电动化率
China Electric Bus Industry Report, 2015-2020 by ResearchInChina focuses on the followings:
Significance, status quo, development trends at home and abroad of electric bus promotion;
Mainstream technology roadmaps for electric bus, and status quo & trend of bus battery, motor, electronic control industry chain in China;
Main subsidies for purchase (tax relief and fiscal subsidies) and usage in China electric bus industry, and promotion policies nationwide;
Electric bus output & sales volume and future trends in China, competitive landscape among and market share, sales volume prediction, investment and capacity of major electric bus companies;
Technological level, output & sales volume, capacity and development strategy of 12 major Chinese electric bus manufacturers.
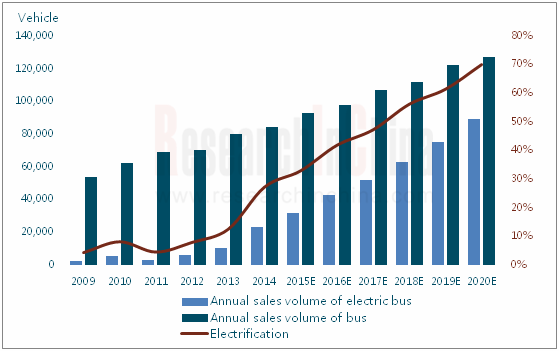
Sales volume of electric bus reached 27,000 vehicles throughout the year 2014, soaring by 160.3% from the previous year, and kept growing rapidly in the first half of 2015, approaching 20,000 vehicles. It is expected that China will sell 154,000 electric buses in 2020, with a CAGR of 33.6% during this period.
The variety that is vigorously promoted is electric public bus which accounts for 85% of total sales volume of electric bus. City bus ownership in China now has exceeded 500,000 vehicles, carrying 60% of city passenger transportation in urban public transport system. As of 2014, electric public bus ownership nationwide topped 80,000 vehicles.
Next, the Chinese government will gradually cut fuel subsidies for traditional bus and shifts financial support to electric model, the move that will give local governments a significant stimulus to replace new additional public buses with electric ones. It is expected that new electric public buses added in 2020 will make up 70% of new public buses added that year, and cumulative electric public bus ownership will exceed 300,000 vehicles by 2020. Technologically speaking, all-electric public bus, significantly propped up by policies, will be the main orientation of future development.
Besides public bus, light business-purpose bus and touring bus markets will be next market spotlights for electric bus. New energy commercial bus rating had been completed in the first quarter of 2015, and 3,000 vehicles are expected to be sold in 2015. With advances in battery technology, improvement in charging infrastructure along expressways, long-distance transportation will become possible, and the triggering point for this market segment is expected to occur around 2018.
Seen from battery, motor and electronic control industry chain, electric bus now adopts mainly LFP power battery and “LFP+ supercapacitor” dual-battery system. Based on the type of battery used by electric bus in the first half of 2015, configuration rate of LFP power battery including “LFP+ supercapacitor” dual-battery system was up to 82%. Rated power of drive motor for electric bus mostly falls into the range of 80 kW to 120kW. Asynchronous motor still holds a dominant position, as it can provide high-power traction; permanent-magnet synchronous motor starts to be massively used in medium-sized and small buses.
In point of competitive landscape among companies, top5 electric bus manufacturers in 2014 were Yutong Bus, Xiamen King Long Motor Group (including three wholly-owned subsidiaries: Higer Bus, Xiamen King Long United Automotive Industry, Xiamen Golden Dragon Bus), BYD, Nanjing Golden Dragon Bus and Zhongtong Bus, together producing 17,011 vehicles, 62.5% of the country’s total.
As electric bus enjoys enormous space for future development and can greatly drive the development of relevant industrial chains, China has ushered in an electric bus investment boom since 2014, with planned investment in electric bus announced by key bus makers nationwide exceeding RMB21 billion according to preliminary statistics and a lot of capacity putting into production in 2016 and 2017. Cities like Shenzhen, Nanjing and Wuhan took a lead in this round of investment and attracted a number of technically leading bus manufacturers to settle in.
Sales Volume of Electric Bus and Electrification in China, 2009-2017E
第一章 电动客车概述
1.1推广意义
1.2环保性及经济性
1.2.1环保性
1.2.2经济性
1.3中国推广现状及趋势
1.3.1电动公交客车是主要推广品种
1.3.2电动公路客车将在2015年迎来爆发
1.3.3纯电动客车将是未来主要方向
1.4国外推广现状及趋势
1.4.1国外电动公交客车推广现状
1.4.2国外电动公交客车技术趋势
第二章 产业链
2.1技术路线
2.2电池
2.3电机及控制器
第三章 行业重要政策
3.1购置税减免政策
3.2财政补贴政策
3.2.1 2014-2015年电动客车补贴
3.2.2 2016-2020年电动客车补贴
3.2.3燃料电池客车补贴
3.3“削油补电”政策
3.4电动汽车推广政策
第四章中国电动客车市场分析
4.1电动客车市场
4.1.1整体市场
4.1.2企业竞争格局
4.1.3投资及产能
4.2全部客车市场
4.2.1整体市场
4.2.2企业竞争格局
第五章中国电动客车厂商
5.1宇通客车
5.1.1公司简介
5.1.2经营数据
5.1.3电动客车业务
5.1.4全部客车业务
5.1.5客车产能
5.2比亚迪
5.2.1公司简介
5.2.2经营数据
5.2.3电动客车业务
5.2.4电池业务
5.2.5全部电动汽车业务
5.3金龙汽车
5.3.1公司简介
5.3.2经营数据
5.3.3电动客车业务
5.3.4全部客车业务
5.3.5客车产能
5.4南京金龙
5.4.1公司简介
5.4.2电动客车业务
5.5中通客车
5.5.1公司简介
5.5.2经营数据
5.5.3电动客车业务
5.5.4全部客车业务
5.5.5客车产能
5.6福田汽车
5.6.1公司简介
5.6.2经营数据
5.6.3电动客车业务
5.6.4全部客车业务
5.6.5客车产能
5.7上海申沃
5.7.1公司简介
5.7.2电动客车业务
5.7.3全部客车业务
5.7.4产能
5.8湖南南车时代
5.8.1公司简介
5.8.2经营数据
5.8.3电动客车业务
5.8.4客车产能
5.9安凯客车
5.9.1公司简介
5.9.2经营数据
5.9.3电动客车业务
5.9.4全部客车业务
5.9.5客车产能
5.10青年客车
5.10.1公司简介
5.10.2电动客车业务
5.10.3全部客车业务
5.10.4客车产能
5.11重庆恒通
5.11.1公司简介
5.11.2经营数据
5.11.3电动客车业务
5.11.4全部客车业务
5.11.5客车产能
5.12深圳五洲龙
5.12.1公司简介
5.12.2经营数据
5.12.3电动客车业务
1 Overview of Electric Bus
1.1 Significance of Promotion
1.2 Environmental Friendliness & Economy
1.2.1 Environmental Friendliness
1.2.2 Economy
1.3 Status Quo and Trend of Promotion in China
1.3.1 Electric City Bus is the Key Promotion Category
1.3.2 Electric Highway Bus will See Explosive Growth in 2015
1.3.3 Battery Electric Bus will be the Main Direction in Future
1.4 Status Quo and Trend of Promotion Overseas
1.4.1 Status Quo of Electric Public Bus Promotion Overseas
1.4.2 Technology Trend of Electric Public Bus Overseas
2 Industry Chain
2.1 Technology Roadmap
2.2 Battery
2.3 Motor & Controller
3 Key Policies on the Industry
3.1 Policy of Purchase Tax Deduction and Exemption
3.2 Policy of Fiscal Subsidies
3.2.1 Subsidies for Electric Bus during 2014-2015
3.2.2 Subsidies for Electric Bus during 2016-2020
3.2.3 Subsidies for Fuel Cell Bus
3.3“Oil Reduction & Electricity Compensation” Policy
3.4 Electric Vehicle Promotion Policy
4 China Electric Bus Market
4.1 Electric Bus Market
4.1.1 Overall Market
4.1.2 Competition among Enterprises
4.1.3 Investment and Production Capacity
4.2 All Bus Market
4.2.1 Overall Market
4.2.2 Competition among Enterprises
5 Chinese Electric Bus Manufacturers
5.1 Zhengzhou Yutong Group
5.1.1 Profile
5.1.2 Operating Data
5.1.3 Electric Bus Business
5.1.4 All Bus Business
5.1.5 Bus Production Capacity
5.2 BYD
5.2.1 Profile
5.2.2 Operating Data
5.2.3 Electric Bus Business
5.2.4 Battery Business
5.2.5 All Bus Business
5.3 Xiamen King Long Motor Group
5.3.1 Profile
5.3.2 Operating Data
5.3.3 Electric Bus Business
5.3.4 All Bus Business
5.3.5 Bus Production Capacity
5.4 Nanjing Golden Dragon Bus Co., Ltd
5.4.1 Profile
5.4.2 Electric Bus Business
5.5 Zhongtong Bus Holding Co., Ltd
5.5.1 Profile
5.5.2 Operating Data
5.5.3 Electric Bus Business
5.5.4 All Bus Business
5.5.5 Bus Production Capacity
5.6 Foton Motor Group
5.6.1 Profile
5.6.2 Operating Data
5.6.3 Electric Bus Business
5.6.4 All Bus Business
5.6.5 Bus Production Capacity
5.7 Shanghai Sunwin Bus Corporation
5.7.1 Profile
5.7.2 Electric Bus Business
5.7.3 All Bus Business
5.7.4 Production Capacity
5.8 Hunan CSR Times Electric Vehicle Co., Ltd.
5.8.1 Profile
5.8.2 Operating Data
5.8.3 Electric Bus Business
5.8.4 Bus Production Capacity
5.9 Anhui Ankai Automobile Company Ltd.
5.9.1 Profile
5.9.2 Operating Data
5.9.3 Electric Bus Business
5.9.4 All Bus Business
5.9.5 Bus Production Capacity
5.10 China Youngman Automobile Group
5.10.1 Profile
5.10.2 Electric Bus Business
5.10.3 All Bus Business
5.10.4 Bus Production Capacity
5.11 Chongqing Hengtong Bus Co., Ltd
5.11.1 Profile
5.11.2 Operating Data
5.11.3 Electric Bus Business
5.11.4 All Bus Business
5.11.5 Bus Production Capacity
5.12 Shenzhen Wuzhulong Motors Co., Ltd.
5.12.1 Profile
5.12.2 Operating Data
5.12.3 Electric Bus Business
图:2008-2014年中国城市公交客车保有量
图:中国城市客运量比重
图:汽车污染物排放量
图:不同类型公交车每公里CO2排放量(g/公里、车)
图:不同类型公交车城市内污染物排放量(Kg/年、车)
图:不同类型公交车城市外污染物排放量(Kg/年、车)
图:不同类型公交车整体污染物排放量(Kg/年、车)
图:不同类型公交车全生命周期总成本-补贴前(万元)
图:不同类型公交车全生命周期总成本-购置补贴后(万元)
图:不同类型公交车全生命周期总成本-购置、燃油补贴后(万元)
表:不同技术路径综合比较结果
图:全球电动公交客车推广情况(截至2014年)
图:无线充电公交客车技术示意图
图:2020年伦敦在线快充电动公交车网规划
图:公交及私家车共用汽车充电基础设施
表:不同技术路线电动公交车技术性能参数
图:电动汽车电池、电机、电控产业链
表:电动汽车对电池和电池系统的性能要求
表:2015H1电动客车动力电池(分技术路线)装配率
标:主要电动客车企业电机及控制器供应关系
图:工信部前三批免购置税目录车型统计
表:2014-2015年中国电动客车补贴标准(中央财政)
表:2016年中国电动客车补贴标准(中央财政)
表:2016年中国燃料电池汽车补贴标准
表:2013-2015中国城市(群)电动汽车推广计划及完成进度
图:2014-2015年中国电动汽车推广计划(公共交通和私人消费)
表:2014年全年中国城市(群)电动汽车推广数量
图:2012-2020年中国电动客车产量
图:2014年中国电动客车(分动力类型)产量占比
图:2015H1中国电动客车(分动力类型)产量
图:2015H1中国电动客车(分动力类型)产量占比
图:2012-2020年中国电动客车(分用途)产量
图:2009-2017年中国电动公交客车销量及电动化率
表:2014年前15大电动客车企业产量及市场份额
表:2015H1前15大电动客车企业产量及市场份额
表:2014年前10大纯电动客车企业产量及市场份额
表:2015H1前14大纯电动客车企业产量及市场份额
表:2014年前10大混合动力客车企业产量及市场份额
表:2015H1前10大混合客车企业产量及市场份额
图:2012-2017年中国主要电动客车企业销量
表:2009-2014年中国电动客车投资
图:2009-2017年中国客车(不含非完整车辆)销量
图:2009-2017年中国客车(分长度)销量
图:2014年大型客车销量前十企业排名
图:2014年中型客车销量前十企业排名
图:2014年轻型客车销量前十企业排名
图:2014年宇通客车股权结构
表:2010-2015Q1宇通客车经营业绩
表:2010-2014年宇通客车分地区收入
图:2011-2015年宇通电动客车销量
图:2011-2015年宇通电动客车销量占比
表:2009-2015H1宇通客车分车型产量
表:2009-2015H1宇通客车分车型销量
表:2011-2015年宇通客车(分用途)销量
表:2011-2015年宇通客车(分用途)销量比重
表:2014年宇通客车(含电动客车)产能布局
图:2010-2015Q1比亚迪经营业绩
图:2012-2014年比亚迪(分业务)营收构成
图:2009-2014年比亚迪(分业务)毛利率
图:2012-2017年比亚迪电动客车销量
表:比亚迪K9纯电动客车成本拆解
图:2011-2017年比亚迪动力&储能电池业务规模
图:磷酸铁锰锂电池技术参数
表:比亚迪动力电池包容量、重量及成本
图:2011-2017年比亚迪电动汽车销量
图:2014年金龙汽车集团股权结构
图:2010-2015Q1金龙汽车主要财务指标
图:2009-2014年金龙汽车分地区收入
图:2011-2015年金龙电动客车销量
图:2011-2015年金龙电动客车销量占比
图:金旅混联式混合动力系统
图:2009-2015H1金龙汽车产量(分车型)
图:2009-2015H1金龙汽车销量(分车型)
表:2014年金龙客车(含电动客车)产能布局
表:金龙电动客车投资计划
图:2013-2017年南京金龙电动客车销量
图:2014年中通客车股权结构
表:2009-2015Q1中通客车经营业绩
表:2009-2014年中通客车分地区收入及毛利率
图:2011-2015年中通电动客车销量
图:2011-2015年中通电动客车销量占比
表:中通电动客车核心供应商
表:2009-2015H1中通大中型客车产量
表:2009-2015H1中通大中型客车销量
表:中通电动客车在建项目
图:北汽福田股权结构图
图:2009-2015Q1福田汽车主要财务指标
图:2009-2014年福田汽车营业收入(分产品)
图:2009-2014年福田汽车营业收入(分地区)
图:2013-2017年北汽福田电动客车销量
表:北汽福田电动客车核心供应商
图:2011-2016年福田轻型客车业务营收、销量及价格
图:2011-2016年福田大中型客车业务营收、销量及价格
表:北汽福田客车(含电动客车)产能布局
图:2014年上海申沃股权结构
图:2013-2017年上海申沃电动客车销量
表:2009-2015H1上海申沃分车型产量
表:2009-2015H1上海申沃分车型销量
表:2014年上海申沃客车(含电动客车)产能布局明细
表:上海申沃投资计划
图:2011-2014南车时代电动经营业绩
图:2012-2017年南车时代电动客车销量
表:南车时代电动客车核心供应商
表:2014年南车时代电动电动客车产能布局
图:2014年安凯客车股权结构
表:2009-2015Q1安凯客车主要财务指标
表:2009-2014安凯客车营收(分产品)
表:2009-2014安凯客车营收(分地区)
图:2012-2017年安凯电动客车销量
表:安凯电动客车核心供应商
表:2009-2015H1安凯客车分车型产量
表:2009-2015H1安凯客车分车型销量
表:安凯客车(含电动客车)产能布局
表:青年电动客车核心供应商
表:2009-2015H1青年客车分车型产量
表:2009-2015H1青年客车分车型销量
表:2014年青年客车产能布局
图:恒通电动汽车股权结构图
表:2012-2014重庆恒通经营业绩
图:2012-2014年重庆恒通电动客车销量
图:2012-2014年重庆恒通电动客车业务经营业绩
表:2011-2015H1恒通客车分车型产量
表:2011-2015H1恒通客车分车型销量
表:2012-2014深圳五洲龙经营业绩
Ownership of Urban Public Buses in China, 2008-2014
Proportion of Urban Passenger Traffic in China
Pollutant Emission of Vehicle
CO2 Emissions Per km of Buses of Varied Types (g/km, vehicle)
Pollutant Emissions inside City of Buses of Varied Types (Kg/year, Vehicle)
Pollutant Emissions outside City of Buses of Varied Types (Kg/year, Vehicle)
Overall Pollutant Emission of Different Types of Bus (Kg/year, vehicle)
Total Costs (before Subsidies) in Full Lifespan of Different Types of Bus
Total Costs (Subsidies Received after Purchase) in Full Lifespan of Different Types of Bus
Total Costs (After Purchase and Fuel Subsidies) in Full Lifespan of Different Types of Bus
Results of Comprehensive Comparison of Different Technology Roadmaps
Global Electric Public Bus Promotion (as of 2014)
Wireless Charging Public Bus Technology Sketch Map
Online Fast-charging Electric Bus Network Planning in London, 2020
Common Sharing of Vehicle Charging Facilities for Bus and Private Car
Technical Parameters of Electric Bus with Different Technical Routes
Battery, Motor and Electric Control Industry Chains of Electric Vehicle
Requirements of Electric Vehicle on Performance of Battery and Battery System
Rate of Power Battery (by Technical Route) Installation in Electric Bus, 2015H1
Motor and Controller Supply Relation of Key Electric Bus Enterprises
Statistics on Vehicle Models in the Purchase Tax Exemption Catalog in the First Three Batches Issued by MIIT
Standards of Subsidies (Central Finance) for Electric Bus in China, 2014-2015
Standards of Subsidies (Central Finance) for Electric Bus in China, 2016
Standards of Subsidies for Fuel Cell Vehicle in China, 2016
Electric Vehicle Promotion Program and Progress in Cities (Cluster) in China, 2013-2015
Electric Vehicle Promotion Program (Public Traffic and Personal Consumption) in China, 2014-2015
Electric Vehicle Promotion Quantity in Cities (Cluster) in China, 2014
Electric Bus Output of China, 2012-2020E
Proportion of Electric Bus (by Power Type) Output in China, 2014
Electric Bus (by Power Type) Output in China, 2015H1
Proportion of Electric Bus (by Power Type) Output in China, 2015H1
Electric Bus (by Application) Output in China, 2012-2020E
Electric City Bus Sales Volume and Electric Rate in China, 2009-2017E
Output and Market Share of Top 15 Electric Bus Enterprises, 2014
Output and Market Share of Top 15 Electric Bus Enterprises, 2015H1
Output and Market Share of Top 10 Battery Electric Bus Enterprises, 2014
Output and Market Share of Top 14 Battery Electric Bus Enterprises, 2015H1
Output and Market Share of Top 10 Hybrid Bus Enterprises, 2014
Output and Market Share of Top 10 Hybrid Bus Enterprises, 2015H1
Sales Volume of Leading Electric Bus Enterprises, 2012-2017E
Electric Bus Investments in China, 2009-2014
China’s Bus (Excluding Incomplete Vehicle) Sales Volume, 2009-2017E
Bus (by Length) Sales Volume in China, 2009-2017E
Ranking of Top 10 Large Bus Enterprises by Sales Volume, 2014
Ranking of Top 10 Medium Bus Enterprises by Sales Volume, 2014
Ranking of Top 10 Light Bus Enterprises by Sales Volume, 2014
Equity Structure of Zhengzhou Yutong Group, 2014
Business Performance of Zhengzhou Yutong Group, 2010-2015Q1
Revenue of Zhengzhou Yutong Group by Regions, 2010-2014
Electric Bus Sales Volume of Zhengzhou Yutong Group, 2011-2015
Electric Bus Sales Volume as Percent of Total of Zhengzhou Yutong Group, 2011-2015
Output of Zhengzhou Yutong Group by Vehicle Model, 2009-2015H1
Sales Volume of Zhengzhou Yutong Group by Vehicle Model, 2009-2015H1
Sales Volume of Zhengzhou Yutong Group by Application, 2011-2015
Proportion of Yutong Bus’ Sales Volume by Application, 2011-2015
Capacity Layout of Zhengzhou Yutong Group (Including Electric Bus), 2014
Business Performance of BYD, 2010-2015Q1
Revenue Structure of BYD by Business, 2012-2014
Gross Margin of BYD by Business, 2009-2014
Electric Bus Sales Volume of BYD, 2012-2017
Cost Breakdown of BYD K9 Battery Electric Bus
Power & Energy Storage Battery Business Scale of BYD, 2011-2017E
Technical Parameters of LFMP Battery
Capacity, Weight and Cost of BYD’s Power Battery Pack
Electric Vehicle Sales Volume of BYD, 2011-2017E
Equity Structure of King Long Motor Group, 2014
Selected Financial Indicators of King Long, 2010-2015Q1
Revenue of King Long by Regions, 2009-2014
Electric Bus Sales Volume of King Long, 2011-2015
Proportion of King Long’s Electric Bus Sales Volume, 2011-2015
Parallel-serial Hybrid Power System of Golden Dragon
Output (by Model) of King Long, 2009-2015H1
Sales Volume (by Model) of King Long, 2009-2015H1
Capacity Layout (Including Electric Bus) of King Long, 2014
Electric Bus Investment Plan of King Long
Electric Bus Sales Volume of Nanjing Golden Dragon Bus, 2013-2017
Equity Structure of Zhong Tong Bus, 2014
Business Performance of Zhong Tong Bus, 2009-2015Q1
Revenue and Gross Margin of Zhong Tong Bus by Regions, 2009-2014
Electric Bus Sales Volume of Zhong Tong Bus, 2011-2015
Proportion of Zhong Tong Bus’ Electric Bus Sales Volume, 2011-2015
Core Suppliers for Electric Bus of Zhong Tong Bus
Medium and Large Bus Output of Zhong Tong Bus, 2009-2015H1
Medium and Large Bus Sales Volume of Zhong Tong Bus, 2009-2015H1
Electric Bus Projects under Construction of Zhong Tong Bus
Equity Structure of Foton
Selected Financial Indicators of Foton, 2009-2015Q1
Revenue of Foton by Products, 2009-2014
Revenue of Foton by Regions, 2009-2014
Electric Bus Sales Volume of Foton, 2013-2017
Core Supplies for Electric Bus of Foton
Light Bus Revenue, Sales Volume and Price of Foton, 2011-2016
Medium and Large Bus Revenue, Sales Volume and Price of Foton, 2011-2016
Bus (Including Electric Bus) Capacity Layout of Foton
Equity Structure of Shanghai Sunwin Bus, 2014
Electric Bus Sales Volume of Shanghai Sunwin Bus, 2013-2017
Output (by Model) of Shanghai Sunwin Bus, 2009-2015H1
Sale Volume (by Model) of Shanghai Sunwin Bus, 2009-2015H1
Bus (Including Electric Bus) Production Capacity Layout of Shanghai Sunwin Bus, 2014
Investment Plan of Shanghai Sunwin Bus
Business Performance of CSR Times, 2011-2014
Electric Bus Sales Volume of CSR Times, 2012-2017E
Core Suppliers for Electric Bus of CSR Times
Electric Bus Capacity Layout of CSR Times, 2014
Equity Structure of Ankai, 2014
Selected Financial Indicators of Ankai, 2009-2015Q1
Revenue of Ankai by Products, 2009-2014
Revenue of Ankai by Regions, 2009-2014
Electric Bus Sales Volume of Ankai, 2012-2017E
Core Suppliers for Electric Bus of Ankai
Output (by Model) of Ankai, 2009-2015H1
Sales Volume (by Model) of Ankai, 2009-2015H1
Capacity Layout (Including Electric Bus) of Ankai
Core Suppliers for Electric Bus of Youngman
Output (by Model) of Youngman, 2009-2015H1
Sales Volume (by Model) of Youngman, 2009-2015H1
Capacity Layout of Youngman, 2014
Equity Structure of Chongqing Hengtong Bus
Business Performance of Chongqing Hengtong Bus, 2012-2014
Electric Bus Sales Volume of Chongqing Hengtong Bus, 2012-2014
Electric Bus Business Performance of Chongqing Hengtong Bus, 2012-2014
Output (by Model) of Chongqing Hengtong Bus, 2011-2015H1
Sales Volume (by Model) of Chongqing Hengtong Bus, 2011-2015H1
Business Performance of Shenzhen Wuzhoulong Motors, 2012-2014
如果这份报告不能满足您的要求,我们还可以为您定制报告,请 留言说明您的详细需求。
|