|
|
|
报告导航:研究报告—
制造业—工业机械
|
|
2015-2018年全球及中国3D打印行业研究报告 |
 |
字数:3.4万 |
页数:100 |
图表数:106 |
|
中文电子版:8500元 |
中文纸版:4250元 |
中文(电子+纸)版:9000元 |
|
英文电子版:2300美元 |
英文纸版:2500美元 |
英文(电子+纸)版:2600美元 |
|
编号:HK060
|
发布日期:2015-08 |
附件:下载 |
 |
|
|
3D打印也称“增材制造”,是一种以数字模型文件为基础,运用粉末状金属或塑料等可粘合材料,通过逐层打印的方式来构造物体的技术。3D打印广泛应用于制造、医疗、教育、考古、建筑、军事等领域。
2010年以来,全球3D打印市场进入快速发展阶段,年均增长30%左右,2014年达到41亿美元。3D打印产业主要包括软件、设备、材料和服务四个环节,2014年3D打印设备在整个产业中的占比约为46.5%。
3D打印设备大致可分为个人级和工业级两类。个人级3D打印机价格相对较低,主要用于个人DIY、教育等领域,2014年全球销量约达10万台;工业级3D打印机应用广泛,销售市场主要为美国、日本和德国,其中美国2014年市场份额达40%左右。
3D Systems和Stratasys通过大量收购已成为全球3D打印行业的两大寡头,业务覆盖3D打印全产业链。从销售额看,2014年二者约占据了34%的市场份额。2014年,Stratasys收购了Solid Concept、Harvest Technologies、GrabCAD和Interfacial Solutions;3D Systems 收购了Cimatron、Simbionix、LayerWise、Laser Reproductions、Robtec等。
目前,中国3D打印市场仍处于起步阶段,产业链不完善,如国产3D打印设备的一些核心组件、3D打印材料等仍然依赖于进口,但是在国防航空领域的3D打印技术已居世界领先地位。2014年,中国3D打印市场规模约达46.5亿元,预计未来几年仍将保持40%左右的增长速度,到2018年有望突破200亿元。
2014年,中国3D打印市场集中度较低,相关企业接近100家,但是规模普遍较小。其中3D打印设备生产企业主要包括北京太尔时代科技有限公司、湖南华曙高科技有限责任公司、杭州先临三维科技有限公司等。
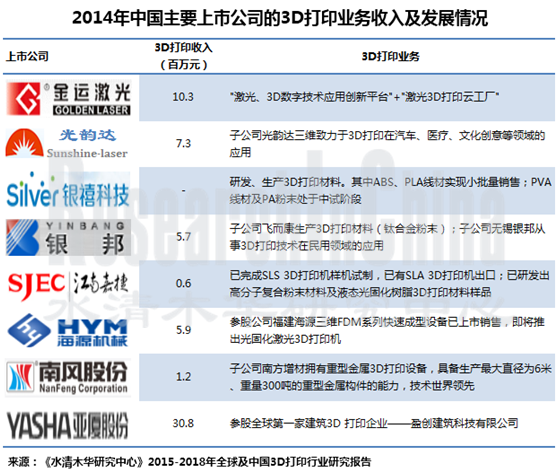
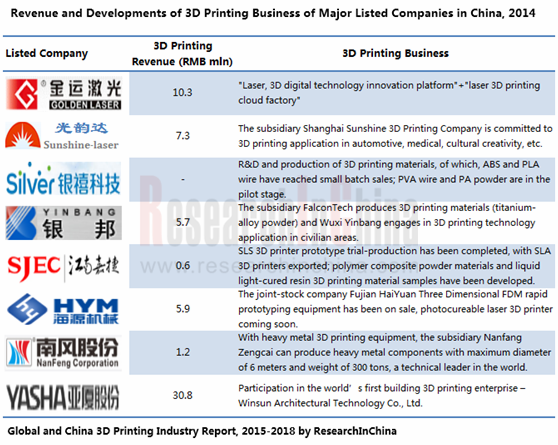
近年来,由于国家政策对3D打印行业的大力支持,越来越多的上市公司进入该行业,有利于中国3D打印行业的整合与发展。2014年,中国涉及3D打印业务的上市公司有10余家,主要有金运激光、光韵达、银禧科技、银邦股份、亚太科技等。
水清木华研究中心《2015-2018年全球及中国3D打印行业研究报告》主要包括以下几个内容:
 全球3D打印行业市场规模、竞争格局及发展预测等; 全球3D打印行业市场规模、竞争格局及发展预测等;
中国3D打印行业市场规模、竞争格局及发展预测等;
全球及中国26家3D打印生产企业的经营情况、3D打印业务分析等。
3D printing (also called additive manufacturing) is a technology with which, based on digital model file, to fabricate objects by using binding materials like plastic or metal powder and through layer-by-layer printing. It is widely used in many fields such as manufacturing, medical treatment, education, archaeology, architecture, and military.
Since 2010, the global 3D printing market has been in a period of rapid development, with an AAGR of 30% or so. In 2014, the market size totaled USD4.1 billion. 3D printing mainly involves software, equipment, materials and service, of which 3D printing equipment accounted for about 46.5% in the industry in 2014.
3D printing equipment can be roughly divided into two categories, personal and industrial. The personal 3D printers, whose prices are relatively low, get chiefly used in personal DIY, education, among others. In 2014, the global sales volume amounted to approximately 100,000 units. By contrast, industrial 3D printers have wide applications and are principally marketed in the United States, Japan and Germany. Among them, the United States occupied a market share of around 40% in 2014.
Through acquisition, 3D Systems and Stratasys have become the world’s two 3D printing giants, whose businesses cover the whole 3D printing industry chain. In terms of sales value, the two companies swept a 34% market share in 2014. In 2014, Stratasys acquired Solid Concept, Harvest Technologies, GrabCAD, and Interfacial Solutions, while 3D Systems purchased Cimatron, Simbionix, LayerWise, Laser Reproductions, Robtec, etc.
At present, China's 3D printing market is still at its initial stage, with the industry chain to be improved. For example, some core components and 3D printing materials for China-made 3D printing equipment have to be imported from overseas. But 3D printing technologies in national defense and aviation industries have taken the lead in the world. In 2014, China’s 3D printing market size approximated 4.65 billion. It is projected that in the following years the market size will still grow at an average rate of around 40%, and that it will very likely exceed RMB20 billion by 2018.
In 2014, China's 3D printing market featured a rather low concentration degree, and the number of enterprises involved was close to 100, but mostly small-sized. The 3D printing equipment manufacturers consist mainly of Beijing Tiertime Technology Co., Ltd., Hunan Farsoon High-tech Co., Ltd., and Shining 3D.
In recent years, as the State introduced policies incentive to the development of 3D printing industry, more and more listed companies have entered the industry, a situation that helped integrate and develop China’s 3D printing industry. In 2014, there were more than 10 enterprises operating 3D printing business in China, mainly including Golden Laser, Sunshine Laser & Electronics, Guangdong Silver Age Sci & Tech, Yinbang Clad Material, and Jiangsu Asia-Pacific Light Alloy Technology, etc.
Global and China 3D Printing Industry Report, 2015-2018 compiled by ResearchInChina is primarily concerned with the following:
 Market size, competitive landscape and development prediction of global 3D printing industry; Market size, competitive landscape and development prediction of global 3D printing industry;
Market size, competitive landscape and development prediction of China’s 3D printing industry;
Operation and 3D printing business of 26 global and Chinese 3D Printer manufacturers.
第一章 3D打印概述
1.1 定义
1.2 流程
1.3 技术
1.4 应用
1.5 产业链
第二章 全球3D打印市场分析
2.1 发展历程
2.2 相关政策
2.3 市场规模
2.4 3D打印机
2.5 竞争格局
2.6 发展趋势
第三章 中国3D打印市场分析
3.1 发展历程
3.2 政策
3.3 市场规模
3.4 竞争格局
第四章 全球重点企业
4.1 美国Stratasys
4.1.1 公司简介
4.1.2 经营情况
4.1.3 营收构成
4.1.4 利润构成
4.1.5 3D打印业务
4.2 美国3D Systems
4.2.1 公司简介
4.2.2 经营情况
4.2.3 营收构成
4.2.4 利润构成
4.2.5 3D打印业务
4.3 其他企业
4.3.1 Cimatron
4.3.2 Autodesk
4.3.3 Materialise
4.3.4 Arcam
4.3.5 Envisiontec
第五章 中国重点企业
5.1 先临三维
5.1.1 公司简介
5.1.2 经营情况
5.1.3 营收构成
5.1.4 毛利率
5.1.5 客户及供应商
5.1.6 3D打印业务
5.1.7 发展及预测
5.2 北科光大
5.2.1 公司简介
5.2.2 经营情况
5.2.3 营收构成
5.2.4 3D打印业务
5.2.5 发展及预测
5.3 乐彩科技
5.3.1 公司简介
5.3.2 经营情况
5.3.3 营收构成
5.3.4 3D打印业务
5.3.5 发展及预测
5.4 腾冉电气
5.4.1 公司简介
5.4.2 经营情况
5.4.3 营收构成
5.4.4 3D打印业务
5.4.5 发展及预测
5.5 光韵达
5.5.1 公司简介
5.5.2 经营情况
5.5.3 营收构成
5.5.4 毛利率
5.5.5 3D打印业务
5.5.6 发展及预测
5.6 金运激光
5.6.1 公司简介
5.6.2 经营情况
5.6.3 营收构成
5.6.4 毛利率
5.6.5 3D打印业务
5.6.6 发展及预测
5.7 银邦股份
5.7.1 公司简介
5.7.2 经营情况
5.7.3 3D打印业务
5.8 银禧科技
5.8.1 公司简介
5.8.2 经营情况
5.8.3 3D打印业务
5.9 亚太科技
5.9.1 公司简介
5.9.2 经营情况
5.9.3 3D打印业务
5.10 江南嘉捷
5.10.1 公司简介
5.10.2 经营情况
5.10.3 3D打印业务
5.11 海源机械
5.11.1 公司简介
5.11.2 经营情况
5.11.3 3D打印业务
5.12 机器人
5.12.1 公司简介
5.12.2 经营情况
5.12.3 3D打印业务
5.13 南风股份
5.13.1 公司简介
5.13.2 经营情况
5.13.3 3D打印业务
5.14 亚厦股份
5.14.1 公司简介
5.14.2 经营情况
5.14.3 3D打印业务
5.15 其他企业
5.15.1 太尔时代
5.15.2 华曙高科
5.15.3 极光尔沃
5.15.4 滨湖机电
5.15.5 隆源成型
第六章 总结与预测
6.1 总结
6.2 发展预测
6.2.1 全球
6.2.2 中国
1 Overview of 3D Printing
1.1 Definition
1.2 Process
1.3 Technology
1.4 Application
1.5 Industry Chain
2 Global 3D Printing Market
2.1 Development History
2.2 Relevant Policies
2.3 Market Size
2.4 3D Printer
2.5 Competitive Landscape
2.6 Development Trend
3 China’s 3D Printing Market
3.1 Development History
3.2 Policies
3.3 Market Size
3.4 Competitive Landscape
4 Key Global Companies
4.1 Stratasys
4.1.1 Profile
4.1.2 Operation
4.1.3 Revenue Structure
4.1.4 Profit Structure
4.1.5 3D Printing Business
4.2 3D Systems
4.2.1 Profile
4.2.2 Operation
4.2.3 Revenue Structure
4.2.4 Profit Structure
4.2.5 3D Printing Business
4.3 Others
4.3.1 Cimatron
4.3.2 Autodesk
4.3.3 Materialise
4.3.4 Arcam
4.3.5 Envisiontec
5 Key Chinese Enterprises
5.1 Shining 3D
5.1.1 Profile
5.1.2 Operation
5.1.3 Revenue Structure
5.1.4 Gross Margin
5.1.5 Clients and Suppliers
5.1.6 3D Printing Business
5.1.7 Development and Forecast
5.2 Beijing Beike Guangda Information Technology Co., Ltd.
5.2.1 Profile
5.2.2 Operation
5.2.3 Revenue Structure
5.2.4 3D Printing Business
5.2.5 Development and Forecast
5.3 Zhengzhou LECAI Science and Technology Co., Ltd.
5.3.1 Profile
5.3.2 Operation
5.3.3 Revenue Structure
5.3.4 3D Printing Business
5.3.5 Development and Forecast
5.4 Suzhou TOPRUN Electrical Equipment Co. Ltd.
5.4.1 Profile
5.4.2 Operation
5.4.3 Revenue Structure
5.4.4 3D Printing Business
5.4.5 Development and Forecast
5.5 Shenzhen Sunshine Laser & Electronics Technology Co., Ltd.
5.5.1 Profile
5.5.2 Operation
5.5.3 Revenue Structure
5.5.4 Gross Margin
5.5.5 3D Printing Business
5.5.6 Development and Forecast
5.6 Golden Laser
5.6.1 Profile
5.6.2 Operation
5.6.3 Revenue Structure
5.6.4 Gross Margin
5.6.5 3D Printing Business
5.6.6 Development and Forecast
5.7 Yinbang Clad Material Co., Ltd.
5.7.1 Profile
5.7.2 Operation
5.7.3 3D Printing Business
5.8 Guangdong Silver Age Sci & Tech Co., Ltd.
5.8.1 Profile
5.8.2 Operation
5.8.3 3D Printing Business
5.9 Jiangsu Asia-Pacific Light Alloy Technology Co., Ltd.
5.9.1 Profile
5.9.2 Operation
5.9.3 3D Printing Business
5.10 SJEC Corporation
5.10.1 Profile
5.10.2 Operation
5.10.3 3D Printing Business
5.11 Fujian Haiyuan Automatic Equipments Co., Ltd.
5.11.1 Profile
5.11.2 Operation
5.11.3 3D Printing Business
5.12 SIASUN Robot & Automation Co., Ltd.
5.12.1 Profile
5.12.2 Operation
5.12.3 3D Printing Business
5.13 Nanfang Ventilator Co., Ltd
5.13.1 Profile
5.13.2 Operation
5.13.3 3D Printing Business
5.14 Zhejiang Yasha Decoration Co., Ltd.
5.14.1 Profile
5.14.2 Operation
5.14.3 3D Printing Business
5.15 Other Companies
5.15.1 Beijing Tiertime Technology Co., Ltd.
5.15.2 Hunan Farsoon High-tech Co., Ltd.
5.15.3 Shenzhen Aurora Technology Co., Ltd
5.15.4 Wuhan Binhu Mechanical & Electrical Co. Ltd.
5.15.5 Beijing Longyuan AFS
6 Conclusion and Anticipation
6.1 Conclusion
6.2 Development Prediction
6.2.1 Global
6.2.2 China
图:3D打印作业流程
表:3D打印采用的主要技术、适用材料及代表公司
表:3D打印与传统制造技术对比
表:3D打印技术优劣势对比
表:3D打印应用领域
图:3D打印产业链
表:3D打印发展历程
表:全球3D打印应用案例
表:全球主要国家3D打印相关政策
图:2005-2014年全球3D打印市场规模及增长率
图:2014年全球3D打印产业链各环节市场规模占比
图:2009-2014年全球个人级3D打印机销售量
图:2014年全球3D打印机应用领域分布
图:2014年全球工业级3D打印机市场分布(按销售额)
图:2014年全球工业级3D打印机市场分布(按产值)
表:全球3D打印主要商业模式
表:全球3D打印产业(分类别)代表企业
表:全球3D打印产业发展趋势
表:中国主要3D打印企业及其科研团队
表:中国3D打印产业发展历程
图:2012-2014年中国3D打印市场规模及增长率
表:2014年中国涉足3D打印的上市公司及相关业务
表:2014年中国涉足3D打印的新三板企业及相关业务
表:2014年中国3D打印设备生产企业情况
图:2010-2014年Stratasys净销售额和净利润
表:2012-2014年Stratasys(分产品)销售收入
图:2012-2014年Stratasys(分产品)销售收入占比
表:2012-2014年Stratasys(分地区)销售收入
图:2012-2014年Stratasys(分地区)销售收入占比
表:2012-2014年Stratasys(分产品)毛利润
图:2012-2014年Stratasys(分产品)毛利润占比
图:2012-2014年Stratasys(分产品)毛利率
表:Stratasys 3D打印业务发展历程
表:Stratasys 3D打印机系列产品
表:Stratasys全球分支机构
图:2010-2014年3D Systems净销售额和净利润
表:2012-2014年3D Systems(分产品)销售收入
图:2012-2014年3D Systems(分产品)销售收入占比
表:2012-2014年3D Systems(分地区)销售收入
图:2012-2014年3D Systems(分地区)销售收入占比
表:2012-2014年3D Systems(分产品)毛利润
图:2012-2014年3D Systems(分产品)毛利润占比
表:Stratasys 3D打印业务发展历程
表:3D Systems产品系列
表:3D Systems全球分支机构
图:2012-2014年先临三维营业收入和净利润
表:2012-2014年先临三维(分产品)营业收入
表:2012-2014年先临三维(分产品)营业收入占比
表:2012-2013年先临三维(分地区)营业收入
图:2012-2013年先临三维(分地区)营业收入占比
图:2012-2013年先临三维主营产品毛利率
图:2013年先临三维前五名客户名称、收入贡献及占比
表:先临三维主要原材料及供应商
图:2013年先临三维前五名供应商名称、采购金额及占比
图:先临三维3D打印相关业务
表:先临三维3D打印业务发展历程
表:2012-2013年先临三维(分市场)营业收入
图:2012-2013年先临三维(分市场)营业收入占比
表:先临三维3D打印业务合作伙伴
图:2014-2018年先临三维营业收入和净利润预测
图:2012-2014年北科光大营业收入和净利润
表:2012-2014年北科光大(分产品)营业收入
表:2012-2014年北科光大(分产品)营业收入占比
表:北科光大3D打印业务发展方向
图:2014-2018年北科光大营业收入和净利润预测
图:2012-2014年乐彩科技营业收入和净利润
表:2012-2014年乐彩科技(分产品)营业收入
表:2012-2014年乐彩科技(分产品)营业收入占比
图:2014-2018年乐彩科技营业收入和净利润预测
图:2012-2014年腾冉电气营业收入和净利润
表:2012-2014年腾冉电气(分产品)营业收入
表:2012-2014年腾冉电气(分产品)营业收入占比
图:2014-2018年腾冉电气营业收入和净利润预测
图:2010-2014年光韵达营业收入和净利润
图:2014年光韵达(分产品)营业收入占比
表:2013-2014年光韵达(分地区)营业收入
图:2013-2014年光韵达(分地区)营业收入占比
图:2014年光韵达主营产品毛利率
图:2014-2018年光韵达营业收入和净利润预测
图:2010-2014年金运激光营业收入和净利润
表:2012-2014年金运激光(分产品)营业收入
图:2012-2014年金运激光(分产品)营业收入占比
表:2012-2014年金运激光(分地区)营业收入
图:2012-2014年金运激光(分地区)营业收入占比
图:2012-2014年金运激光主营产品毛利率
表:2014-2015年金运激光3D打印业务发展情况
表:2014年武汉落地创意经营情况
表:2014年金运激光3D打印相关子公司营业收入和净利润
图:2014-2018年金运激光营业收入和净利润预测
图:2010-2014年银邦股份营业收入和净利润
图:2013-2014年飞而康营业收入和净利润
图:2013-2014年无锡银邦营业收入和净利润
图:2010-2014年银禧科技营业收入和净利润
图:2010-2014年亚太科技营业收入和净利润
图:2010-2014年江南嘉捷营业收入和净利润
图:2010-2014年海源机械营业收入和净利润
图:2013-2014年海源三维营业收入和净利润
图:2010-2014年机器人营业收入和净利润
图:2010-2014年南风股份营业收入和净利润
图:2010-2014年亚厦股份营业收入和净利润
表:盈创建筑3D打印业务发展情况
图:2013-2014年盈创建筑营业收入和净利润
表:2014年全球及中国主要3D打印企业营收情况
图:2014-2018年全球3D打印行业市场规模预测
图:2014-2018年全球个人级3D打印机销售量预测
图:2014-2018年中国3D打印行业市场规模预测
Procedure of 3D Printing Operation
Main 3D Printing Technologies, Materials, and Representative Companies
Comparison of 3D Printing Technology and Manufacturing Technology
Advantage and Disadvantage of 3D Printing Technology
3D Printing Applications
3D Printing Industry Chain
Development History of 3D Printing
Global 3D Printing Application Cases
Polices on 3D Printing in Major Countries
Market Size and Growth Rate of Global 3D Printing, 2005-2014
Proportion of Different Links of Global 3D Printing Industry by Market Size, 2014
Global Sales Volume of Personal 3D Printers, 2009-2014
Distribution of 3D Printers Worldwide by Application, 2014
Global Distribution of Industrial 3D Printers by Sales Value, 2014
Global Distribution of Industrial 3D Printers by Output Value, 2014
Main Business Models of Global 3D Printing
Major Global 3D Printing Enterprises by Category
Development Trend of Global 3D Printing Industry
Major Chinese 3D Printing Enterprises and Their R&D Teams
Development History of 3D Printing Industry in China
Market Size and Growth Rate of 3D Printing in China, 2012-2014
Listed 3D Printing Companies in China and Related Business, 2014
3D Printing Enterprises Listed in China’s New OTC Market and Related Business, 2014
3D Printing Equipment Manufacturers in China, 2014
Stratasys’ Net Revenue and Net Income, 2010-2014
Stratasys’ Revenue by Product, 2012-2014
Revenue Structure of Stratasys by Product, 2012-2014
Revenue of Stratasys by Region, 2012-2014
Revenue Structure of Stratasys by Region, 2012-2014
Stratasys’ Gross Profit by Product, 2012-2014
Gross Profit Proportion of Stratasys by Product, 2012-2014
Stratasys’ Gross Margin by Product, 2012-2014
Development History of Stratasys’ 3D Printing Business
Stratasys’ 3D Printer Series
Stratasys’ Global Arms
3D Systems’ Net Revenue and Net Income, 2010-2014
Revenue of 3D Systems by Product, 2012-2014
Revenue Structure of 3D Systems by Product, 2012-2014
Revenue of 3D Systems by Region, 2012-2014
Revenue Structure of 3D Systems by Region, 2012-2014
3D Systems’ Gross Profit by Product, 2012-2014
Gross Profit Proportion of 3D Systems by Product, 2012-2014
Development History of Stratasys’ 3D Printing Business
3D Systems’ Product Series
3D Systems’ Global Arms
Revenue and Net Income of Shining 3D, 2012-2014
Revenue of Shining 3D by Product, 2012-2014
Revenue Structure of Shining 3D by Product, 2012-2014
Revenue of Shining 3D by Region, 2012-2013
Revenue Structure of Shining 3D by Region, 2012-2013
Shining 3D’s Gross Margin for Main Products, 2012-2013
Name List and Revenue Contribution of Shining 3D’s Top 5 Clients,2013
Shining 3D’s Main Raw Materials and Suppliers
Name List and Procurement of Shining 3D’s Top 5 Suppliers, 2013
Shining 3D’s 3D Printing-related Business
Development History of Shining 3D’s 3D Printing Business
Revenue of Shining 3D by Application, 2012-2013
Revenue Structure of Shining 3D by Application, 2012-2013
Shining 3D’s 3D Printing Partners
Revenue and Net Income of Shining 3D, 2014-2018E
Revenue and Net Income of Beike Guangda, 2012-2014
Revenue of Beike Guangda by Product, 2012-2014
Revenue Structure of Beike Guangda by Product, 2012-2014
Beike Guangda’s 3D Printing Business Development Trends
Revenue and Net Income of Beike Guangda, 2014-2018E
Revenue and Net Income of LECAI, 2012-2014
Revenue of LECAI by Product, 2012-2014
Revenue Structure of LECAI by Product, 2012-2014
Revenue and Net Income of LECAI, 2014-2018E
Revenue and Net Income of Suzhou TOPRUN Electrical Equipment, 2012-2014
Revenue of Suzhou TOPRUN Electrical Equipment by Product, 2012-2014
Revenue Structure of Suzhou TOPRUN Electrical Equipment by Product, 2012-2014
Revenue and Net Income of Suzhou TOPRUN Electrical Equipment, 2014-2018E
Revenue and Net Income of Sunshine Laser & Electronics, 2010-2014
Revenue Structure of Sunshine Laser & Electronics by Product, 2014
Revenue of Sunshine Laser & Electronics by Region, 2013-2014
Revenue Structure of Sunshine Laser & Electronics by Region, 2013-2014
Sunshine Laser & Electronics’ Gross Margin for Main Products, 2014
Revenue and Net Income of Sunshine Laser & Electronics, 2014-2018E
Revenue and Net Income of Golden Laser, 2010-2014
Revenue of Golden Laser by Product, 2012-2014
Revenue Structure of Golden Laser by Product, 2012-2014
Revenue of Golden Laser by Region, 2012-2014
Revenue Structure of Golden Laser by Region, 2012-2014
Golden Laser’s Gross Margin for Main Products, 2012-2014
Development of Golden Laser’s 3D Printing Business, 2014-2015
Operation of Wuhan Loodii Creative Culture Communication, 2014
Revenue and Net Income of Golden Laser’s 3D Printing Subsidiaries, 2014
Revenue and Net Income of Golden Laser, 2014-2018E
Revenue and Net Income of Yinbang Clad Material, 2010-2014
Revenue and Net Income of FalconTech, 2013-2014
Revenue and Net Income of Wuxi Yinbang Precision Manufacturing, 2013-2014
Revenue and Net Income of Silver Age Sci & Tech, 2010-2014
Revenue and Net Income of Jiangsu Asia-Pacific Light Alloy Technology, 2010-2014
Revenue and Net Income of SJEC Corporation, 2010-2014
Revenue and Net Income of Fujian Haiyuan Automatic Equipments, 2010-2014
Revenue and Net Income of Haiyuan Three Dimensional, 2013-2014
Revenue and Net Income of SIASUN Robot & Automation, 2010-2014
Revenue and Net Income of Nanfang Ventilator, 2010-2014
Revenue and Net Income of Yasha Decoration, 2010-2014
Development of Yingchuang’s 3D Printing Business,
Revenue and Net Income of Yingchuang, 2013-2014
Revenue of Major Global and Chinese 3D Printing Enterprises, 2014
Market Size of 3D Printing Industry Worldwide, 2014-2018E
Sales Volume of Personal 3D Printers Worldwide, 2014-2018E
Market Size of 3D Printing Industry in China, 2014-2018E
如果这份报告不能满足您的要求,我们还可以为您定制报告,请 留言说明您的详细需求。
|