|
|
|
报告导航:研究报告—
制造业—化工
|
|
2014-2018年全球及中国天然橡胶行业研究报告 |
 |
字数:2.3万 |
页数:83 |
图表数:85 |
|
中文电子版:7500元 |
中文纸版:3750元 |
中文(电子+纸)版:8000元 |
|
英文电子版:1900美元 |
英文纸版:2050美元 |
英文(电子+纸)版:2200美元 |
|
编号:CYH037
|
发布日期:2015-08 |
附件:下载 |
 |
|
|
受全球天然橡胶市场价格大幅下滑等影响, 2014年,全球天然橡胶产量同比减少1.5%至1207万吨。同期,全球天然橡胶消费量同比增长6.8%至1216万吨,消耗库存8.9万吨,这主要受全球轮胎产业出现持续增长拉动。
全球天然橡胶消费市场主要集中在中国、印度、欧洲、日本等国家。其中,中国是全球天然橡胶最大的消费国,2014年消费量为476.0万吨,同比增长13.1%,占全球总消费量的39.1%。随着中国汽车行业及轮胎行业的需求拉动,天然橡胶消费仍将继续增长,至2018年总消费量有望达679.1万吨。
然而,受中国气候条件等限制,中国天然橡胶产量较低,2014年达85.7万吨,仅占全球总产量的7.1%。为了满足供需缺口,中国从泰国、印尼、马来西亚等国大量进口天然橡胶,2014年进口量为261.0万吨,占到当年总消费量的54.8%。
目前,泰国诗董、宏曼历、泰华公司等是全球主要天然橡胶生产商。近几年,各大企业借助资源优势,不断扩充其种植及生产能力。
宏曼历是全球天然橡胶产能最大的企业。 在泰国、新加坡等国拥有生产基地,截至2014年底,已具备165万吨/年的生产能力。
泰国诗董是全球第二大天然橡胶生产商。截至2014年底,已在泰国和印度尼西亚共有26家加工厂,合计产能达到140万吨/年。到2015年底,公司缅甸加工厂将投产运营,届时将新增10万吨/年天然橡胶产能。
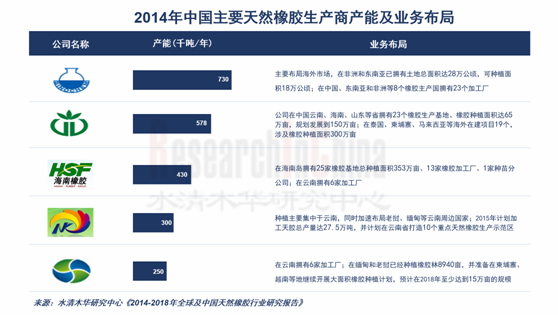
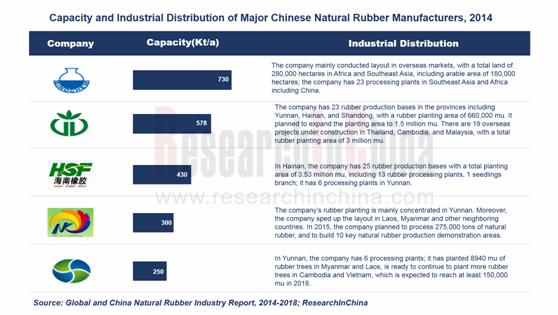
与此同时,中化国际、广垦橡胶、海南橡胶等中国主要天然橡胶生产商正积极研发新产品,加快实施“走出去”战略。
中化国际是中国最大天然橡胶供应商。截至2014年底,公司在8个橡胶主产国拥有23个加工厂,年加工产能达73万吨。其中在非洲地区新增3.6万吨/年的加工产能。
海南橡胶是中国最大天然橡胶种植生产商。截至2014年底,公司拥有可种植面积353万亩。2015年7月,公司与中橡集团曙光橡胶工业设计研究院联合研发的国产军用航空轮胎用天然橡胶材料审批通过,打破中国军用航空轮胎等高端用胶100%依赖进口的局面。
广垦橡胶自2004年开始拓展海外业务。 2015年5月,其在马来西亚新增1500公顷橡胶种植面积,经营期限为60年,进一步扩大了公司天然橡胶种植版图。
水清木华研究中心《2014-2018年全球及中国天然橡胶行业研究报告》着重研究了以下内容:
 全球天然橡胶市场供需、地区分布、市场价格、发展趋势等; 全球天然橡胶市场供需、地区分布、市场价格、发展趋势等;
中国天然橡胶市场供需、进出口、竞争格局、发展趋势等;
全球及中国天然橡胶割胶面积、种植面积等;
轮胎、胶带胶管等中国天然橡胶下游应用发展情况等;
全球5家天然橡胶企业经营情况及在华发展等;
中国5家天然橡胶重点企业经营情况及发展战略等。
Due to substantial decline in global natural rubber prices, the world’s natural rubber output fell by 1.5% from a year earlier to 12.07 million tons in 2014. Over the same period, global consumption of natural rubber saw a year-on-year growth of 6.8% to 12.16 million tons, destocking 89 kt, largely driven by continuous expansion of global tire industry.
Global natural rubber consumer markets are primarily concentrated in China, India, Europe, Japan, etc. China is the world’s largest consumer of natural rubber, guzzling 4,760 kt in 2014, representing a year-on-year rise of 13.1%, making up 39.1% of the world’s total consumption. Pulled by the demand from automobile and tire industries in China, natural rubber consumption will continue to grow and is expected to reach 6,791 kt by 2018.
However, limited by unfavorable weather conditions, the output of natural rubber in China is rather low, only 857 kt in 2014, or 7.1% of the global total. In order to meet supply-demand gap, China has to import a large amount of natural rubber from Thailand, Indonesia and Malaysia, with imports reaching 2,610 kt in 2014, 54.8% of total consumption that year.
At present, Sri Trang Agro-Industry Plc., Von Bundit and Thai Hua Rubber are major global natural rubber producers. They have, by virtue of their resource advantages, continued to boost planting and production capacity.
Von Bundit is the company with the largest natural rubber capacity in the world. It has production bases in Thailand, Singapore, etc. By the end of 2014, the company boasted annual capacity of 1,650 kt.
Sri Trang Agro-Industry Plc. is the world’s second largest natural rubber producer. By the end of 2014, it had set up 26 plants in Thailand and Malaysia, totaling a capacity of 1,400 kt/a. The company’s processing plant in Burma will go into production at the end of 2015, then adding natural rubber capacity of 100 kt/a.
Meanwhile, major Chinese natural rubber producers, including Sinochem International, Guangdong Guangken Rubber Group and China Hainan Rubber Industry Group, are actively developing new products and speeding up the implementation of “going out” strategy.
Sinochem International Corporation is the largest supplier of natural rubber in China. By the end of 2014, the company had 23 processing plants in 8 main rubber producing countries with total annual capacity of 730 kt, including a capacity of 36 kt/a added in Africa.
China Hainan Rubber Industry Group Co., Ltd. is the largest natural rubber producer in China. As of the end of 2014, the company had the planting area of 3.53 million mu (1mu equals to about 1/15 hectare). In Jul 2015, the natural rubber material for domestic military aircraft tire jointly developed by the company and Shuguang Rubber Industry Research and Design Institute of China National Tire Rubber Corporation passed technical evaluation, breaking monopoly of imported high-end products in military aircraft tire in China.
Guangdong Guangken Rubber Group Co., Ltd. began to expand its overseas business from 2004. In May 2015, the company added 1,500 hectares of rubber planting area with operation period of 60 years, further expanding its natural rubber planting territory.
Global and China Natural Rubber Industry Report, 2014-2018 by ResearchInChina highlights:
 Supply & demand, regional distribution, prices, development trends of global natural rubber market; Supply & demand, regional distribution, prices, development trends of global natural rubber market;
Supply & demand, import & export, competitive landscape, development trends of Chinese natural rubber market;
Tapping area and planting area of natural rubber in China and around the world;
Development of applications of natural rubber in China, such as rubber belt & hose;
Operation and development in China of 5 global natural rubber companies;
Operation and development strategy of 5 key Chinese natural rubber companies.
第一章 天然橡胶基础概念
1.1 定义
1.2 分类
第二章 全球天然橡胶市场发展概况
2.1 发展现状
2.2 市场供给
2.3 市场需求
2.4 地区结构
2.5 价格分析
第三章 中国天然橡胶市场发展概况
3.1 发展现状
3.2 市场供给
3.3 市场需求
3.4 进出口
3.4.1 进口
3.4.2 出口
第四章 全球及中国天然橡胶相关产业发展
4.1 天然橡胶种植情况
4.2 天然橡胶应用情况
4.2.1 轮胎行业
4.2.2 其他橡胶制品业
4.3 合成橡胶
4.3.1 合成橡胶VS天然橡胶
4.3.2 合成橡胶供需现状
4.3.3 合成橡胶取代天然橡胶最新进展
第五章 全球重点生产企业
5.1 泰国诗董橡胶股份有限公司
5.1.1 企业简介
5.1.2 经营情况
5.1.3 营收构成
5.1.4 产能和产销量
5.1.5 在华发展
5.1.6 发展战略
5.2 泰国橡胶集团有限公司(TRUBB)
5.2.1 企业简介
5.2.2 经营情况
5.2.3 营收构成
5.2.4 产能及销量
5.2.5 在华发展
5.3 泰华树胶(大众)有限公司
5.3.1 企业简介
5.3.2 产能
5.3.3 在华发展
5.4 宏曼历有限公司
5.4.1 企业简介
5.4.2 产能
5.5 泰国联益橡胶集团有限公司
5.5.1 企业简介
5.5.2 产能
5.5.3 在华发展
第六章 中国重点企业
6.1 海南天然橡胶产业集团股份有限公司(601118)
6.1.1 企业简介
6.1.2 经营情况
6.1.3 营收构成
6.1.4 毛利率
6.1.5 在建工程
6.1.6 产销量
6.1.7 发展战略
6.2 中化国际(控股)股份有限公司(600500)
6.2.1 企业简介
6.2.2 经营情况
6.2.3 营收构成
6.2.4 毛利率
6.2.5 天然橡胶业务
6.3 云南农垦集团有限责任公司
6.3.1 企业简介
6.3.2 云南天然橡胶产业股份有限公司
6.3.3 西双版纳景阳橡胶公司
6.3.4 江城橡胶公司
6.3.5 其他公司
6.4 广东省广垦橡胶集团有限公司
6.4.1 企业简介
6.4.2 经营情况
6.4.3 产能与产销量
6.4.4 橡胶业务在建项目
6.5 西双版纳新高深橡胶股份有限公司
6.5.1 企业简介
6.5.2 经营情况
6.5.3 营收构成
6.5.4 在建项目
6.5.5 产能与产销量
第七章 结论与预测
7.1 市场竞争
7.2 市场预测
1 Basic Concept of Natural Rubber
1.1 Definition
1.2 Classification
2 Development of Global Natural Rubber Market
2.1 Status Quo
2.2 Supply
2.3 Demand
2.4 Regional Structure
2.5 Price
3 Development of Chinese Natural Rubber Market
3.1 Status Quo
3.2 Supply
3.3 Demand
3.4 Import and Export
3.4.1 Import
3.4.2 Export
4 Development of Global and China Natural Rubber-related Industries
4.1 Plantation
4.2 Application
4.2.1 Tire Industry
4.2.2 Other Rubber Products Industries
4.3 Synthetic Rubber
4.3.1 Synthetic Rubber VS Natural Rubber
4.3.2 Supply and Demand of Synthetic Rubber
4.3.3 Progress in the Substitution of Synthetic Rubber for Natural Rubber
5 Key Global Players
5.1 Sri Trang Agro-Industry Plc.
5.1.1 Profile
5.1.2 Operation
5.1.3 Revenue Structure
5.1.4 Capacity, Output and Sales Volume
5.1.5 Development in China
5.1.6 Development Strategy
5.2 Thai Rubber Latex Corporation (Thailand) Public Co., Ltd. (TRUBB)
5.2.1 Profile
5.2.2 Operation
5.2.3 Revenue Structure
5.2.4 Capacity and Sales Volume
5.2.5 Development in China
5.3 Thai Hua Rubber Public Co., Ltd.
5.3.1 Profile
5.3.2 Capacity
5.3.3 Development in China
5.4 Von Bundit Co., Ltd.
5.4.1 Profile
5.4.2 Capacity
5.5 Southland Rubber Co., Ltd.
5.5.1 Profile
5.5.2 Capacity
5.5.3 Development in China
6 Major Chinese Companies
6.1 China Hainan Rubber Industry Group Co., Ltd. (601118)
6.1.1 Profile
6.1.2 Operation
6.1.3 Revenue Structure
6.1.4 Gross Margin
6.1.5 Projects under Construction
6.1.6 Output and Sales Volume
6.1.7 Development Strategy
6.2 Sinochem International Corporation (600500)
6.2.1 Profile
6.2.2 Operation
6.2.3 Revenue Structure
6.2.4 Gross Margin
6.2.5 Natural Rubber Business
6.3 Yunnan State Farms Group Co., Ltd.
6.3.1 Profile
6.3.2 Yunnan Natural Rubber Industry Co., Ltd.
6.3.3 Xishuangbanna Jingyang Rubber Co., Ltd.
6.3.4 Jiangcheng Rubber Company
6.3.5 Others
6.4 Guangdong Guangken Rubber Group Co., Ltd.
6.4.1 Profile
6.4.2 Operation
6.4.3 Capacity, Output and Sales Volume
6.4.4 Projects under Construction for Rubber Business
6.5 Yunnan Gaoshen Rubber Co., Ltd.
6.5.1 Profile
6.5.2 Operation
6.5.3 Revenue Structure
6.5.4 Projects under Construction
6.5.5 Capacity, Output and Sales Volume
7 Summary and Forecast
7.1 Market Competition
7.2 Market Forecast
表:天然橡胶的特性
表:天然橡胶的分类
图:2008-2014年全球天然橡胶产量及同比增长
图:2008-2014全球天然橡胶消费量及同比增长
表:2013-2014年全球天然橡胶(分国家)产量及构成
表:2013-2014年全球天然橡胶(分国家)消费量及构成
表:2009-2014年世界主要国家天然橡胶政策
图:2013-2015年天然橡胶STR20(分产地)CIF中国主港现货价格
图:2013-2015年中国天然橡胶期货结算价
表:2014年12月国储收储天然橡胶情况
图:2008-2014年中国天然橡胶产量及同比增长
图:2005-2014年中国天然橡胶自给率
图:2008-2014年中国天然橡胶消费量及同比增长
表:2006-2015年中国天然橡胶进口关税政策
图:2004-2014年中国天然橡胶进口量及同比增长
表:2007-2014年中国天然橡胶(分国家)进口量及构成
图:2013-2014年中国天然橡胶进口量(分产品)构成
图:2008-2014年中国天然橡胶出口量
图:2013-2015年全球九大天然橡胶主产国天然橡胶总种植面积
表:2004-2014年全球九大天然橡胶主产国天然橡胶开割面积
表:2008-2015年全球天然橡胶主产国新种与翻种面积
图:全球天然橡胶主产国停割期
图:全球天然橡胶(分应用领域)消费量构成
图:2014年轮胎(分原材料)成本构成
表:2012-2014年中国轮胎(分品种)产量及同比增长率
图:2008-2014年中国汽车产销量
表:2012-2014年中国胶管带产量及同比增长
图:2008-2015年中国胶管相关制造企业营业收入及同比增长
图:2008-2015年中国胶管制造企业毛利率
表:常用橡胶产品性能
表:2003-2014年中国合成橡胶产量与消费量
图:2014年诗董集团天然橡胶产业链
表:1987-2014年诗董集团重要发展事件
图:2008-2015年诗董集团营业收入与净利润
图:2012-2014年诗董集团(分产品)主营业务收入
图:2013-2015年诗董集团天然橡胶(分国家)主营业务收入
图:2014年诗董集团工厂和种植厂分布
图:2010-2014年诗董集团(分产品)天然橡胶销量
图:2011-2015年诗董集团天然橡胶在中国营业收入
图:2012-2014年诗董集团在华销量占中国总进口量的市场份额
图:2015年诗董集团战略计划
图:2008-2014年泰橡公司营业收入与净利润
表:2015年泰橡公司(分业务)子公司
图:2011-2014泰橡公司(分业务)收入及构成
图:2013-2014年泰橡公司(分业务)产能
表:2012-2013年泰橡公司(分业务)产品销量
图:2012-2014年泰橡公司在中国营业收入
表:泰华公司工厂与产能
表:2015年泰华公司(分产品)天然橡胶产能
图:2015年宏曼历附属子公司分布
表:2013-2014年宏曼历天然橡胶(分产品)产能
表:2015年联益橡胶(分产品)产能
表:2015年联益橡胶(分工厂)产品产能
图:2008-2015年海南橡胶营业收入与净利润
表:2010-2014年海南橡胶(分产品)主营业务收入及构成
图:2009-2014年海南橡胶(分地区)主营业务收入
图:2009-2014年海南橡胶(分产品)毛利率
表:2015年海南橡胶在建项目
图:2010-2014年海南橡胶天然橡胶(分渠道)产量
图:2008-2014年海南橡胶销量及同比增长
图:2008-2015年中化国际营业收入与净利润
图:2013-2014年中化国际(分业务)主营业务收入
图:2012-2014年中化国际(分地区)营业收入
图:2009-2014年中化国际(分业务)毛利率
图:2009-2014年中化国际天然橡胶业务营业收入及同比增长
图:2010-2014年中化国际天然橡胶产能
图:2011-2014年中化国际天然橡胶销量
表:2015年云南农垦天然橡胶计划产量
图:2011-2015年云南农垦景阳橡胶公司天然橡胶产量
图:2011-2014年云垦江城橡胶公司天然橡胶产销量
表:广垦橡胶海外子公司
图:2010-2014年广东广垦橡胶企业营业收入及同比增长
表:2010-2014年广垦集团橡胶业务(分产品)产能及产量
表:2010-2014年广垦橡胶公司(分产品/分地区)销量
表:截至2015年6月底广垦集团橡胶主要在建/拟建项目
图:2013-2014年高深股份营业收入与净利润
表:2013-2014年高深股份(分地区)主营业务收入及构成
表:2015年高深股份主要建设项目
表:2013-2104年高深股份(分工厂)产能与产量
表:2013-2014年高深股份(分产品)天然橡胶销量
图:2013-2014年全球及中国主要橡胶生产企业营业收入
表:2014年全球及中国主要天然橡胶生产企业天然橡胶产能
表:2014年中国重点天然橡胶生产企业天然橡胶产能、产销量及经营情况
表:2014-2018年全球天然橡胶产量与消费量及同比增长
表:2014-2018年中国天然橡胶产量与消费量及同比增长
Properties of Natural Rubber
Classification of Natural Rubber
Global Natural Rubber Output and YoY Growth, 2008-2014
Global Natural Rubber Consumption and YoY Growth, 2008-2014
Global Natural Rubber Output Breakdown by Country, 2013-2014
Global Natural Rubber Consumption Breakdown by Country, 2013-2014
Major Countries’ Policies on Natural Rubber, 2009-2014
CIF Chinese Major Port Spot Prices for Natural Rubber STR20 (by Origin of Production), 2013-2015
Natural Rubber Futures Settlement Prices in China, 2013-2015
Purchase and Storage of Natural Rubber by State Bureau of Material Reserve, Dec 2014
Natural Rubber Output and YoY Growth in China, 2008-2014
China’s Self-sufficiency in Natural Rubber, 2005-2014
Natural Rubber Consumption and YoY Growth in China, 2008-2014
Import Tariff Policies on Natural Rubber in China, 2006-2015
Import Volume and YoY Growth of Natural Rubber in China, 2004-2014
Import Volume Structure of Natural Rubber in China by Country, 2007-2014
Import Volume Structure of Natural Rubber in China by Product, 2013-2014
Export Volume of Natural Rubber from China, 2008-2014
Total Planting Area of the World’s Nine Largest Natural Rubber Producing Countries, 2013-2015
Tapping Area of Natural Rubber of the World’s Nine Largest Natural Rubber Producing Countries, 2004-2014
New Planting & Replanting Area of the World’s Major Natural Rubber Producing Countries, 2008-2015
Stoppage Periods of the World’s Major Natural Rubber Producing Countries
Global Consumption Structure of Natural Rubber by Application
Cost Structure of Tire by Raw Material, 2014
Tire Output and YoY Growth in China by Type, 2012-2014
Automobile Output and Sales Volume in China, 2008-2014
Rubber Hose & Belt Output and YoY Growth in China, 2012-2014
Revenue and YoY Growth of Rubber Hose-related Manufacturers in China, 2008-2015
Gross Margin of Rubber Hose Manufacturers in China, 2008-2015
Performance of Common Rubber Products
Synthetic Rubber Output and Consumption in China, 2003-2014
Natural Rubber Industry Chain of Sri Trang, 2014
Milestones in the Development of Sri Trang, 1987-2014
Revenue and Net Income of Sri Trang, 2008-2015
Operating Revenue Breakdown of Sri Trang by Product, 2012-2014
Operating Revenue Breakdown of Natural Rubber Business of Sri Trang by Country, 2013-2015
Distribution of Factories and Plantations of Sri Trang, 2014
Natural Rubber Sales Volume Breakdown of Sri Trang by Product, 2010-2014
Sri Trang’s Revenue from Its Natural Rubber Business in China, 2011-2015
Sri Trang’s Share of China’s Total Natural Rubber Imports, 2012-2014
Strategic Planning of Sri Trang, 2015
Revenue and Net Income of TRUBB, 2008-2014
Subsidiaries of TRUBB by Business, 2015
Revenue Structure of TRUBB by Business, 2011-2014
Capacity of TRUBB by Business, 2013-2014
Sales Volume Breakdown of TRUBB by Business, 2012-2013
TRUBB’s Revenue from China, 2012-2014
Factories and Capacity of Thai Hua Rubber Public Company Ltd.
Natural Rubber Capacity of Thai Hua Rubber Public Company Ltd. by Product, 2015
Distribution of Von Bundit’s Affiliated Companies, 2015
Natural Rubber Capacity Breakdown of Von Bundit by Product, 2013-2014
Capacity Breakdown of Southland Rubber by Product, 2015
Capacity Breakdown of Southland Rubber by Factory, 2015
Revenue and Net Income of Hainan Rubber Group, 2008-2015
Operating Revenue Structure of Hainan Rubber Group by Product, 2010-2014
Operating Revenue Breakdown of Hainan Rubber Group by Region, 2009-2014
Gross Margin of Hainan Rubber Group by Product, 2009-2014
Projects under Construction of Hainan Rubber Group, 2015
Natural Rubber Output Breakdown of Hainan Rubber Group by Channel, 2010-2014
Sales Volume and YoY Growth of Hainan Rubber Group, 2008-2014
Revenue and Net Income of Sinochem International, 2008-2015
Operating Revenue Breakdown of Sinochem International by Business, 2013-2014
Revenue Breakdown of Sinochem International by Business, 2012-2014
Gross Margin of Sinochem International by Business, 2009-2014
Sinochem International’s Revenue from Natural Rubber Business and YoY Growth, 2009-2014
Natural Rubber Capacity of Sinochem International, 2010-2014
Natural Rubber Sales Volume of Sinochem International, 2011-2014
Planned Natural Rubber Output of Yunnan State Farms Group, 2015
Natural Rubber Output of Jingyang Rubber Company of Yunnan State Farms Group, 2011-2015
Natural Rubber Output and Sales Volume of Jiangcheng Rubber Company of Yunnan State Farms Group, 2011-2014
Overseas Subsidiaries of Guangdong Guangken Rubber Group
Revenue and YoY Growth of Rubber Companies of Guangdong Guangken Rubber Group, 2010-2014
Rubber Capacity and Output Breakdown of Guangdong Guangken Rubber Group by Product, 2010-2014
Sales Volume Breakdown of Rubber Companies of Guangdong Guangken Rubber Group by Product/Region, 2010-2014
Major Rubber Projects under Construction/Planned of Guangdong Guangken Rubber Group by the end of Jun 2015
Revenue and Net Income of Yunnan Gaoshen Rubber, 2013-2014
Operating Revenue Structure of Yunnan Gaoshen Rubber by Region, 2013-2014
Major Projects under Construction of Yunnan Gaoshen Rubber, 2015
Capacity and Output Breakdown of Yunnan Gaoshen Rubber by Factory, 2013-2014
Natural Rubber Sales Volume Breakdown of Yunnan Gaoshen Rubber by Product, 2013-2014
Revenue of Key Global and Chinese Rubber Producers, 2013-2014
Natural Rubber Capacity of Key Global and Chinese Natural Rubber Producers, 2014
Natural Rubber Capacity, Output, Sales Volume and Operation of Key Chinese Natural Rubber Producers, 2014
Global Natural Rubber Output, Consumption and YoY Growth, 2014-2018E
Natural Rubber Output, Consumption and YoY Growth in China, 2014-2018E
如果这份报告不能满足您的要求,我们还可以为您定制报告,请 留言说明您的详细需求。
|