|
|
|
报告导航:研究报告—
制造业—化工
|
|
2015-2018年中国工程胶粘行业研究报告 |
 |
字数:3.5万 |
页数:123 |
图表数:117 |
|
中文电子版:9000元 |
中文纸版:4500元 |
中文(电子+纸)版:9500元 |
|
英文电子版:2400美元 |
英文纸版:2600美元 |
英文(电子+纸)版:2700美元 |
|
编号:ZYM067
|
发布日期:2015-08 |
附件:下载 |
 |
|
|
近几年,中国工程胶粘剂市场发展较快。2009-2014年中国工程胶粘剂产量年均复合增长率达20.6%。其中,2014年中国工程胶粘剂产量约71.1万吨,同比增长20.7%。并且,在汽车、风电、高铁等高端用胶领域,中国工程胶粘剂产品已经实现对部分进口产品的替代。
有机硅胶粘剂、环氧树脂胶、聚氨酯胶是中国目前需求最大的三类产品,2014年其市场占比分别为45.1%、30.3%和15.9%。不过,其他小品种胶虽然市场占比相对很低,但价格和毛利率却非常可观,如厌氧胶。2014年中国厌氧产量仅有3850吨左右,但出厂价均价可达10万元/吨,回天、天山等厂家产品甚至在15万/吨以上。
H.B. Fuller、Henkel、3M、Sika、ITW等全球知名胶粘剂生产商由于其产品品种齐全、技术领先,占据着中国工程胶粘剂市场大部分份额。并且这些跨国企业仍然在加大在华投资,以扩大其市场占有率。
2013年,Henkel在上海建成了产能42.8万吨/年的全球最大工业胶粘剂工厂(市场定位于包括中国在内的亚太地区的汽车和各种消费品领域胶粘剂需求)。2014年6月底,H.B. Fuller宣布,以14亿元人民币(约2.3亿美元)现金收购北京天山新材料技术股份有限公司95%的股权;2015年初该收购获中国政府批准。
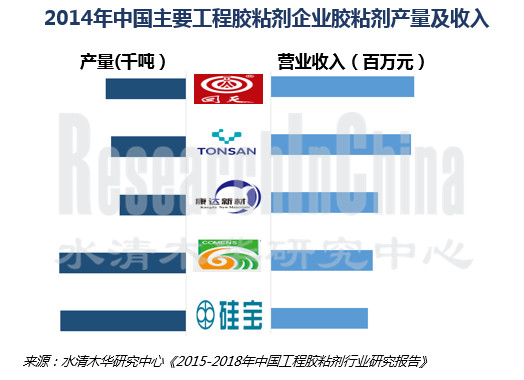
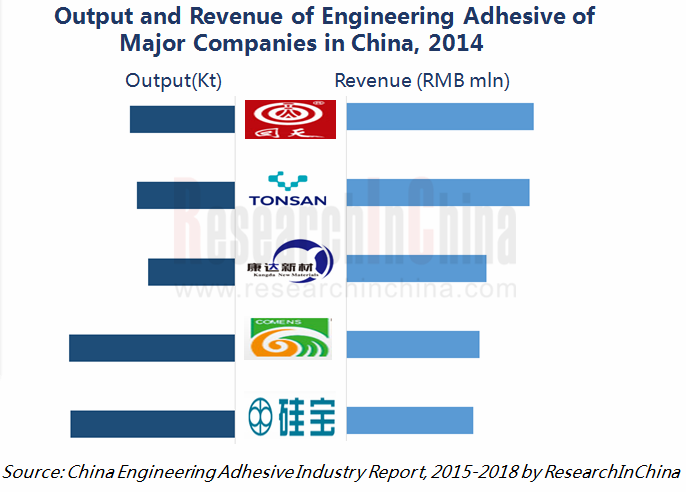
中国本土工程胶粘剂企业大多成立于20世纪80-90年代,尽管起步较晚,但发展较快,并已在某一细分市场形成同外资相抗衡的优势企业。中国本土企业主要有回天新材、康达新材、硅宝科技、高盟新材、杭州之江、广州新展等。
回天新材是中国工程胶粘市场重要供应商,下游消费主要在汽车工业和可再生能源领域。2014年其工程胶粘剂产销2万吨以上,营业收入6.347亿元,其中有机硅胶、聚氨酯胶的收入合计占比82.8%。此外,2015年公司又新增10kt/年有机硅胶和10kt/年聚氨酯胶项目。
康达新材主要生产环氧结构胶,2014年其产销量1.6万吨左右,营业收入5.272亿元,其中环氧结构胶收入占比70.0%。2015年3月20日,公司环氧结构胶等募投项目建设完成,目前正在向有关部门申请试生产,预计2015年可产生部分效益。
《2015-2018年中国工程胶粘剂行业研究报告》主要包括以下几个方面:
  中国工程胶粘剂行业发展现状、市场供需、竞争格局及发展预测等; 中国工程胶粘剂行业发展现状、市场供需、竞争格局及发展预测等;
中国有机硅胶、聚氨酯胶、环氧胶、丙烯酸酯胶等工程胶粘剂细分市场的发展现状、竞争格局及发展预测等;
海外11家、中国10家工程胶粘剂企业经营状况、胶粘剂业务及发展前景等。
It is over the recent years that China's engineering adhesive market has seen rapid development, with a CAGR of 20.6% during 2009-2014. In 2014, the output of engineering adhesives in China totaled approximately 711,000 tons, up 20.7% from a year ago. Moreover, in automobiles, wind power, high-speed rail, and other high-end fields in which adhesives are used, China-made engineering adhesives have partially substituted for imports.
In China, the demand for silicone adhesive, epoxy resin adhesive, and polyurethane adhesive is the largest, and accounted for 45.1%, 30.3%, and 15.9%, respectively, in 2014. However, other small adhesive varieties including anaerobic adhesive, though occupying a small market share, have high prices and handsome gross margins. In 2014, China’s output of anaerobic adhesive totaled only 3,850 tons, but with the average ex-factory price of RMB100,000/ton. Even the products from the manufacturers like Huitian Adhesive and Tonsan Adhesive are priced at more than RMB150,000 /ton.
With a full range of product varieties and advanced technologies, the global well-known adhesive manufacturers such as H.B. FULLER, Henkel, 3M, Sika, and ITW have held the larger portion of the engineering adhesive market in China. What’s more, these players are still increasing investments in China to sweep more market shares.
In 2013, Henkel established in Shanghai the world's largest industrial adhesive plant with an annual capacity of 428,000 tons, a plant that is positioned to satisfy the demand for adhesives used in automobiles and consumer goods in Asia. At the end of June 2014, H.B. FULLER announced to acquire a 95% stake in Tonsan Adhesive for RMB1.4 billion (USD230 million) in cash. In early 2015, the acquisition was approved by the Chinese government.
The Chinese engineering adhesive enterprises were mostly founded in the 1980s-1990s. These enterprises, which started very late, develop very fast and can compete with foreign counterparts in some market segments. They consist mainly of Hubei Huitian Adhesive Enterprise, Kangda New Material, Chengdu Guibao Science & Technology, Comens New Materials, Zhijiang Silicone, and Guangzhou Xiinzhan, among others.
As an important supplier of engineering adhesive in China, Hubei Huitian Adhesive Enterprise applies its products in the fields of automobile and renewable energy. In 2014, its output and sales volume of engineering adhesives exceeded 20,000 tons, which generated revenue of RMB634.7 million. Among them, silicone adhesive and polyurethane adhesive accounted for a combined 82.8% share of total revenue. In addition, the company increased the projects of 10kt/a silicone adhesive and 10kt/a polyurethane adhesive in 2015.
Kangda New Materials mainly produces epoxy structural adhesive. In 2014, the company produced and sold around 16,000 tons of adhesive and realized revenue of RMB527.2 million, of which epoxy structural adhesive represented 70.0%. On March 20, 2015, the company finished construction of the project with raised funds for epoxy structural adhesive and so forth. The company is now working to apply for trial production, and it is expected to partially yield benefits in 2015.
China Engineering Adhesive Industry Report, 2015-2018 by ResearchInChina highlights the followings:
Development status, demand and supply, competitive landscape, and development prediction of China’s Engineering Adhesive industry;
Current situation, competitive landscape, and development forecast of China’s engineering adhesive market segments, including silicone adhesive, polyurethane adhesive, epoxy adhesive, and acrylate adhesive;
Operation, adhesive business, and development prospects of 11 overseas and 10 Chinese engineering adhesives enterprises.
第一章 工程胶粘剂概述
1.1 胶粘剂定义及分类
1.2 工程胶粘剂定义和分类
第二章 全球及中国工程胶粘剂市场概况
2.1 运行环境
2.1.1 全球市场环境
2.1.2 中国政策环境
2.2 总体现状
2.3 市场供需
2.3.1 全球
2.3.2 中国
2.3.3 市场需求
2.4 竞争格局
2.5 工程胶粘剂下游
2.5.1 建筑领域
2.5.2 汽车领域
2.5.3 风电、光伏领域
2.5.4 电子电器领域
2.5.5 其他领域
2.6 发展前景
第三章 中国工程胶粘剂细分市场分析
3.1 有机硅结构胶
3.2 环氧结构胶
3.3 聚氨酯结构胶
3.4 丙烯酸酯结构胶及其他
第四章 全球主要供应商
4.1 H.B. FULLER
4.1.1 公司简介
4.1.2 经营情况
4.1.3 营收构成
4.1.4 毛利率
4.1.5研发与投资
4.1.6 在华发展
4.2 HENKEL
4.2.1 公司简介
4.2.2 经营情况
4.2.3 营收构成
4.2.4 毛利率
4.2.5 研发与投资
4.2.6 胶粘剂
4.2.7 在华发展
4.3 THREEBOND
4.3.1 公司简介
4.3.2 经营情况
4.3.3 在华发展
4.4 3M
4.4.1 公司简介
4.4.2 经营情况
4.4.3 营收构成
4.4.4 研发与投资
4.4.5 在华发展
4.5 ITW
4.5.1 公司简介
4.5.2 经营情况
4.5.3 营收构成
4.5.4 研发
4.5.5 在华发展
4.6 SIKA
4.6.1 公司简介
4.6.2 经营情况
4.6.3 营收构成
4.6.5 研发与投资
4.6.6 在华发展
4.7 CYTEC INDUSTRIES
4.7.1 公司简介
4.7.2 经营情况
4.7.3 营收构成
4.7.4 毛利率
4.7.5 投资
4.7.6 在华发展
4.8 MOMENTIVE
4.8.1 公司简介
4.8.2 MSC
4.8.3 MPM
4.8.4 在华发展
4.9 DOW CORNING
4.9.1 公司简介
4.9.2 经营情况
4.9.3 在华发展
4.10 ASHLAND
4.10.1 公司简介
4.10.2 经营情况
4.10.3 胶粘剂
4.10.4 在华发展
4.11 德渊企业股份有限公司
4.11.1 公司简介
4.11.2 经营情况
4.11.3 营收构成
4.11.4 毛利率
4.11.5 研发
4.11.6 胶粘剂
4.11.7 在华业务
第五章 中国大陆主要供应商
5.1 湖北回天新材料股份有限公司
5.1.1 公司简介
5.1.2 经营情况
5.1.3 营收构成
5.1.4 毛利率
5.1.5 研发与投资
5.1.6客户与供应商
5.1.7发展预测
5.2 上海康达化工新材料股份有限公司
5.2.1 公司简介
5.2.2 经营情况
5.2.3营收构成
5.2.4 毛利率
5.2.5 研发与投资
5.2.6 客户与供应商
5.2.7 发展预测
5.3 成都硅宝科技股份有限公司
5.3.1 公司简介
5.3.2 经营情况
5.3.3 营收构成
5.3.4 毛利率
5.3.5 研发与投资
5.3.6 客户与供应商
5.3.7 发展预测
5.4 北京高盟新材料股份有限公司
5.4.1 公司简介
5.4.2 经营情况
5.4.3 营收构成
5.4.4 毛利率
5.4.5 研发与投资
5.4.6 客户与供应商
5.4.7发展预测
5.5 北京天山新材料技术股份有限公司
5.5.1 公司简介
5.5.2 经营状况
5.5.3 发展前景
5.6 山东北方现代化学工业公司
5.6.1 公司简介
5.6.2 胶粘剂厂商
5.7 广州市白云化工实业有限公司
5.7.1公司简介
5.7.2 经营情况
5.7.3 研发
5.8 杭州之江有机硅化工有限公司
5.8.1 公司简介
5.8.2 经营情况
5.9 广州新展有机硅有限公司
5.9.1 公司简介
5.10 东莞市普赛达密封粘胶有限公司
5.10.1公司简介
5.10.2 发展情况
第六章 总结与预测
6.1 企业
6.2 市场
1. Overview of Engineering Adhesive
1.1 Definition and Classification of Adhesives
1.2 Definition and Classification of Engineering Adhesive
2. Global and China Engineering Adhesive Market
2.1 Operating Environment
2.1.1 Market Environment Worldwide
2.1.2 Policy Climate in China
2.2 Overall Status Quo
2.3 Demand & Supply
2.3.1 Global
2.3.2 China
2.3.3 Market Demand
2.4 Competitive Landscape
2.5 Downstream Demand for Engineering Adhesives
2.5.1 Construction
2.5.2 Automobile
2.5.3 Wind Power and PV
2.5.4 Electrical & Electronics
2.5.5 Other Fields
2.6 Development Prospects
3. Chinese Engineering Adhesive Market Segments
3.1 Organic Silicone Structural Adhesive
3.2 Epoxy Structural Adhesive
3.3 PU Structural Adhesives
3.4 Acrylate Structural Adhesive and Others
4. Major Global Suppliers
4.1 H.B. FULLER
4.1.1 Profile
4.1.2 Operation
4.1.3 Revenue Structure
4.1.4 Gross Margin
4.1.5 R&D and Investment
4.1.6 Development in China
4.2 HENKEL
4.2.1 Profile
4.2.2 Operation
4.2.3 Revenue Structure
4.2.4 Gross Margin
4.2.5 R&D and Investment
4.2.6 Adhesive
4.2.7 Development in China
4.3 THREEBOND
4.3.1 Profile
4.3.2 Operation
4.3.3 Development in China
4.4 3M
4.4.1 Profile
4.4.2 Operation
4.4.3 Revenue Structure
4.4.4 R&D and Investment
4.4.5 Development in China
4.5 ITW
4.5.1 Profile
4.5.2 Operation
4.5.3 Revenue Structure
4.5.4 R&D
4.5.5 Development in China
4.6 SIKA
4.6.1 Profile
4.6.2 Operation
4.6.3 Revenue Structure
4.6.5 R&D and Investment
4.6.6 Development in China
4.7 CYTEC INDUSTRIES
4.7.1 Profile
4.7.2 Operation
4.7.3 Revenue Structure
4.7.4 Gross Margin
4.7.5 Investment
4.7.6 Development in China
4.8 MOMENTIVE
4.8.1 Profile
4.8.2 MSC
4.8.3 MPM
4.8.4 Development in China
4.9 DOW CORNING
4.9.1 Profile
4.9.2 Operation
4.9.3 Development in China
4.10 ASHLAND
4.10.1 Profile
4.10.2 Operation
4.10.3 Adhesive
4.10.4 Development in China
4.11 Tex Year Industries Inc.
4.11.1 Profile
4.11.2 Operation
4.11.3 Revenue Structure
4.11.4 Gross Margin
4.11.5 R&D
4.11.6 Adhesive
4.11.7 Business in China
5. Major Suppliers in Mainland China
5.1 Hubei Huitian Adhesive Enterprise Co., Ltd.
5.1.1 Profile
5.1.2 Operation
5.1.3 Revenue Structure
5.1.4 Gross Margin
5.1.5 R&D and Investment
5.1.6 Clients and Suppliers
5.1.7 Development Prediction
5.2 Shanghai Kangda New Materials Co., Ltd.
5.2.1 Profile
5.2.2 Operation
5.2.3 Revenue Structure
5.2.4 Gross Margin
5.2.5 R&D and Investment
5.2.6 Clients and Suppliers
5.2.7 Development Prediction
5.3 Chengdu Guibao Science & Technology Co., Ltd.
5.3.1 Profile
5.3.2 Operation
5.3.3 Revenue Structure
5.3.4 Gross Margin
5.3.5 R&D and Investment
5.3.6 Clients and Suppliers
5.3.7 Development Prediction
5.4 Beijing Comens New Materials Co., Ltd.
5.4.1 Profile
5.4.2 Operation
5.4.3 Revenue Structure
5.4.4 Gross Margin
5.4.5 R&D and Investment
5.4.6 Clients and Suppliers
5.4.7 Development Prediction
5.5 Tonsan Adhesive, Inc.
5.5.1 Profile
5.5.2 Operation
5.5.3 Development Prospects
5.6 Shandong North Modern Chemistry Industry Co., Ltd.
5.6.1 Profile
5.6.2 Adhesive Manufacturers
5.7 Guangzhou Baiyun Chemical Industry Co., Ltd.
5.7.1 Profile
5.7.2 Operation
5.7.3 R&D
5.8 Hangzhou Zhijiang Silicone Chemicals Co., Ltd.
5.8.1 Profile
5.8.2 Operation
5.9 Guangzhou Xinzhan Silicone Co., Ltd.
5.9.1 Profile
5.10 Dongguan Pustar Adhesives & Sealants Co., Ltd.
5.10.1 Profile
5.10.2 Development
6. Conclusion and Forecast
6.1 Enterprise
6.2 Market
表:胶粘剂定义和分类
表:工程胶粘剂分类及应用
图:工程胶粘剂产业链
表:2006-2014年中国工程胶粘剂相关的主要政策
图:2003-2014年中国胶粘剂产量及同比增长
图:2003-2014年中国胶粘剂销售收入及同比增长
图:2014年全球胶粘剂和密封剂市场容量
图:2014年全球胶粘剂市场结构(按化学组分)
图:2014年全球胶粘剂市场结构(按应用领域)
图:2009-2018年中国工程胶粘剂产量及同比增长
图:2014年中国工程胶粘剂产量结构(按化学组分)
图:2014年中国工程胶粘剂市场结构(按应用领域)
图:2007-2014年中国房屋新开工面积、施工面积和竣工面积
图:2005-2018年中国汽车产量
图:2007-2014年全球及中国风电新增装机容量
图:2007-2014年全球及中国光伏累计装机容量
图:2010-2014年中国电子信息行业销售收入
图:2008-2018年中国有机硅结构胶产量及同比增长
表:2015年中国有机硅胶粘剂拟/在建项目
图:2008-2018年中国环氧树脂结构胶产量及同比增长
图:2008-2018年中国聚氨酯结构胶产量及同比增长
表:2008-2018年中国其他结构胶产量
图:2014年中国厌氧胶企业竞争格局(按产量)
图:2014年中国主要厌氧胶企业产品出厂均价
表:2014年Fuller全球工厂分布
图:FY2009-FY2015年富乐公司营业收入和EBITDA
图:FY2012-FY2015年Fuller(分业务)营业收入
图:2008-2015年富乐公司毛利率
图:2008-2014年富乐公司研发支出及其占比
图:2008-2015年Henkel营业收入和净利润
表:2010-2015年Henkel(分业务)营业收入构成
表:2010-2015年Henkel(分地区)营业收入构成
图:2009-2015年Henkel毛利率
图:2009-2015年Henkel研发支出及其占比
图:2009-2015年Henkel胶粘剂技术业务销售收入及同比增长
图:2001-2013年Threebond销售收入
图:2013年Threebond公司销售收入构成(分产品)
图:2008-2015年3M销售收入和净利润
表:2011-2014年3M销售收入和营业利润(分部门)
表:2011-2013年3M销售收入和营业利润(分地区)
图:2009-2015年3M研发支出及其占比
图:3M在华办事处分布
图:2008-2015年ITW营业收入和营业利润
表:2011-2015年ITW(分业务)营业收入
表:2012-2015年ITW(分地区)营业收入
图:2008-2014年ITW研发支出及其占比
图:2008-2014年Sika销售收入和净利润
表:2009-2014年Sika(按应用市场)销售收入构成
图:2014年Sika(分地区)销售收入构成
图:2008-2014年Sika研发支出及其占比
表:截至2014年底Sika在华子公司
图:2008-2015年Cytec Industries销售收入和净利润
表:2011-2015年Cytec Industries(按应用领域)销售收入构成
表:2011-2014年Cytec Industries(分地区)销售收入构成
图:2008-2014年Cytec Industries毛利率
图:2008-2014年MSC销售收入和净利润
图:2013年MSC(分产品)销售收入
图:2008-2015年MPM销售收入和净利润
表:2008-2015MPM(分产品)销售收入构成
表:2008-2015年Dow Corning销售收入和净利润
图:2012-2015财年Ashland销售收入和净利润
图:2014年ASH特殊添加剂业务(分产品)收入构成
图:2008-2015年德渊股份营业收入和净利润
图:2013-2014年德源股份(分产品)营业收入及构成
表:2013-2014年德润股份(分地区)营业收入
图:2008-2013年德润(分业务)营业收入
图:2008-2015年德润毛利率
图:2008-2015年德润研发支出及其占比
图:2013-2014年德润德润热熔胶及其他胶营业收入及其占比
图:2013-2014年德渊股份热熔胶及其他胶产能及产销量
表:2013-2014年德润股份热熔胶及其他胶产值及销售额
表:截止到2014年底德润在华控股子公司名称、主营业务及持股比例
表:2012-2014年回天新材工程胶粘剂产销量
图:2009-2015年回天新材营业收入和净利润
表:2008-2015年回天新材(分产品)营业收入
表:2012-2015年回天新材(按应用领域)收入
表:2008-2015年回天新材(分地区)营业收入
图:2008-2014年回天新材(分产品)毛利率
图:2008-2015年回天新材研发支出及其占比
图:2009-2014回天新材前五名客户营业收入及营收占比
图:2009-2014回天新材前五名供应商采购额及占比
图:2014-2018年回天新材营业收入和净利润预测
表:2011-2014年康达新材胶粘剂产销量
图:2008-2015年康达新材营业收入和净利润
表:2008-2015年康达新材(分产品)营业收入
图:2008-2015年康达新材(分地区)营业收入
图:2008-2015年康达新材(分产品)毛利率
图:2011-2015年康达新材研发支出及其占比
表:截止到2013年底康达新材项目投资及进展情况
图:2009-2014年康达新材前五名客户营业收入及营收占比
图:2009-2014年康达新材前五名供应商采购额及占比
图:2014-2018康达新材营业收入和净利润预测
图:2008-2015年硅宝科技营业收入和净利润
表:2008-2015年硅宝科技(分产品)营业收入
图:2011-2015年硅宝科技有机硅室温胶(按应用领域)营业收入
图:2008-2014年硅宝科技(分地区)营业收入
图:2008-2013年硅宝科技(分产品)毛利率
图:2008-2015年硅宝科技研发支出及其占比
图:2009-2014年硅宝科技前五名客户营业收入及营收占比
表:2013年硅宝科技前五名客户名称及其营业贡献
图:2009-2014年硅宝科技前五名供应商采购额及占比
图:2014-2018年硅宝科技营业收入和净利润预测
表:2008-2014年高盟新材复合聚氨酯胶粘剂产能、产销量、产能利用率及产销率
图:2009-2015年高盟新材营业收入和净利润
表:2009-2014年高盟新材(分产品)营业收入
图:2009-2014年高盟新材(分产品)毛利率
图:2009-2014年高盟新材研发支出及其占比
图:2009-2014年高盟新材前五名客户营业收入及营收占比
图:2009-2014年高盟新材前五名供应商采购额及占比
图:2014-2018年高盟新材营业收入和净利润预测
图:2011-2015年天山新材营业收入
表:天山新材下游消费领域及客户
表:2013-2014年上半年白云化工研发新产品及其特点
表:2010-2015年全球及中国工程胶粘剂主要生产商收入
表:2010-2015年全球及中国工程胶粘剂主要生产商净利润
表:2010-2015年全球工程胶粘剂主要生产商净利润率
图:2014-2018年中国工程胶粘剂(分产品)产量
Definition and Classification of Adhesives
Classification and Application of Engineering Adhesives
Engineering Adhesive Industry Chain
Major Policies on Engineering Adhesive in China, 2006-2014
Adhesive Output and YoY Growth in China, 2003-2014
Adhesive Revenue and YoY Growth in China, 2003-2014
Global Adhesive and Sealant Market Volume, 2014
Global Adhesive Market Structure by Chemical Composition, 2014
Global Adhesive Market Structure by Application, 2014
Output and YoY Growth of Engineering Adhesives in China, 2009-2018E
Output of Engineering Adhesives in China by Chemical Composition, 2014
Market Structure of Engineering Adhesives in China by Application, 2014
New Housing Starts, Floor Space under Construction, and Completed Floor Space of Houses in China, 2007-2014
Output of Automobiles in China, 2005-2018E
Added Installed Capacity of Wind Power in China and Worldwide, 2007-2014
Installed Solar PV Capacity in China and Worldwide, 2007-2014
Revenue of China Electronic Information Industry, 2010-2014
Output and YoY Growth of Organic Silicone Adhesives in China, 2008-2018E
China’s Organic Silicone Adhesive Projects Proposed/under Construction, 2015
Output and YoY Growth of Epoxy Resin Adhesives in China, 2008-2018E
Output and YoY Growth of Polyurethane Adhesives in China, 2008-2018E
Output of Other Structural Adhesives in China, 2008-2018E
Competitive Landscape of Anaerobic Adhesive Enterprises in China by Output, 2014
Average Ex-factory Price for Products of Major Anaerobic Adhesive Enterprises in China, 2014
Distribution of H.B. Fuller’s Plants Worldwide, 2014
Revenue and EBITDA of H.B. Fuller, FY2009-FY2015
Revenue of H.B. Fuller by Business, FY2012-FY2015
Gross Margin of H.B. Fuller, 2008-2015
H.B. Fuller’s R&D Costs and % of Total Revenue, 2008-2014
Revenue and Net Income of Henkel, 2008-2015
Henkel’s Revenue Structure by Business, 2010-2015
Henkel’s Revenue Structure by Region, 2010-2015
Henkel’s Gross Margin, 2009-2015
Henkel’s R&D Costs and % of Total Revenue, 2009-2015
Revenue and YoY Growth of Henkel’s Adhesive Technical Service, 2009-2015
Threebond’s Revenue, 2001-2013
Revenue Structure of Threebond by Product, 2013
Revenue and Net Income of 3M, 2008-2015
3M’s Revenue and Operating Income by Sector, 2011-2014
3M’s Revenue and Operating Income by Region, 2011-2013
3M’s R&D Costs and % of Total Revenue, 2009-2015
3M’s Offices in China
ITW’s Revenue and Operating Income, 2008-2015
ITW’s Revenue by Business, 2011-2015
ITW’s Revenue by Region, 2012-2015
ITW’s R&D Costs and % of Total Revenue, 2008-2014
Sika’s Revenue and Net Income, 2008-2014
Sika’s Revenue Structure by Application, 2009-2014
Sika’s Revenue Structure by Region, 2014
Sika’s R&D Costs and % of Total Revenue, 2008-2014
Sika’s Subsidiaries in China as of the End of 2014
Revenue and Net Income of Cytec Industries, 2008-2015
Revenue Structure of Cytec Industries by Application, 2011-2015
Revenue Structure of Cytec Industries by Region, 2011-2014
Gross Margin of Cytec Industries, 2008-2014
MSC’s Revenue and Net Income, 2008-2014
MSC’s Revenue by Product, 2013
MPM’s Revenue and Net Income, 2008-2015
MPM’s Revenue Structure by Product, 2008-2015
Revenue and Net Income of Dow Corning, 2008-2015
Ashland’s Revenue and Net Income, FY2012-FY2015
Revenue Structure of ASH’s Special Additives by Product, 2014
Revenue and Net Income of Tex Year, 2008-2015
Revenue Structure of Tex Year by Product, 2013-2014
Revenue of Tex Year by Region, 2013-2014
Revenue of Tex Year by Business, 2008-2013
Gross Margin of Tex Year, 2008-2015
R&D Costs and % of Total Revenue of Tex Year, 2008-2015
Tex Year’s Revenue from Hot Melt Adhesives and Other Adhesives and % of Total Revenue, 2013-2014
Capacity, and Output, and Sales Volume of Tex Year’s Hot Melt Adhesives and Other Adhesives, 2013-2014
Output Value and Revenue of Tex Year’s Hot Melt Adhesives and Other Adhesives, 2013-2014
Name List, Operating Revenue, and Shareholding Ratio of Tex Year’s Holding Subsidiaries in China as of the End of 2014
Engineering Adhesive Output and Sales Volume of Hubei Huitian Adhesive Enterprise, 2012-2014
Revenue and Net Income of Hubei Huitian Adhesive Enterprise, 2009-2015
Revenue of Hubei Huitian Adhesive Enterprise by Product, 2008-2015
Revenue of Hubei Huitian Adhesive Enterprise by Application, 2012-2015
Revenue of Hubei Huitian Adhesive Enterprise by Region, 2008-2015
Gross Margin of Hubei Huitian Adhesive Enterprise by Product, 2008-2014
R&D Costs and % of Total Revenue of Hubei Huitian Adhesive Enterprise, 2008-2015
Revenue from Top 5 Clients and % of Total Revenue of Hubei Huitian Adhesive Enterprise, 2009-2014
Procurement from Top 5 Suppliers and % of Total Procurement of Hubei Huitian Adhesive Enterprise, 2009-2014
Revenue and Net Income of Hubei Huitian Adhesive Enterprise, 2014-2018E
Adhesive Output and Sales Volume of Kangda New Materials, 2011-2014
Revenue and Net Income of Kangda New Materials, 2008-2015
Revenue of Kangda New Materials by Product, 2008-2015
Revenue of Kangda New Materials by Region, 2008-2015
Gross Margin of Kangda New Materials by Product, 2008-2015
R&D Costs and % of Total Revenue of Kangda New Materials, 2011-2015
Project Investment and Progress of Kangda New Materials as of the End of 2013
Revenue from Top 5 Clients and % of Total Revenue of Kangda New Materials, 2009-2014
Procurement from Top 5 Suppliers and % of Total Procurement of Kangda New Materials, 2009-2014
Revenue and Net Income of Kangda New Materials, 2014-2018E
Revenue and Net Income of Chengdu Guibao Science & Technology, 2008-2015
Revenue of Chengdu Guibao Science & Technology by Product, 2008-2015
Revenue from Room Temperature Silicone Adhesive of Chengdu Guibao Science & Technology by Application, 2011-2015
Revenue of Chengdu Guibao Science & Technology by Region, 2008-2014
Gross Margin of Chengdu Guibao Science & Technology by Product, 2008-2013
R&D Costs and % of Total Revenue of Chengdu Guibao Science & Technology, 2008-2015
Revenue from Top 5 Clients and % of Total Revenue of Chengdu Guibao Science & Technology, 2009-2014
Name List and Revenue Contribution of Chengdu Guibao Science & Technology’s Top 5 Clients, 2013
Procurement from Top 5 Suppliers and % of Total Procurement of Chengdu Guibao Science & Technology, 2009-2014
Revenue and Net Income of Chengdu Guibao Science & Technology, 2014-2018E
Capacity, Output, Sales Volume, Capacity Utilization, and Sales-output Ratio of Polyurethane Adhesive of Comens New Materials, 2008-2014
Revenue and Net Income of Comens New Materials, 2009-2015
Revenue of Comens New Materials by Product, 2009-2014
Gross Margin of Comens New Materials by Product, 2009-2014
R&D Costs and % of Total Revenue of Comens New Materials, 2009-2014
Revenue from Top 5 Clients and % of Total Revenue of Comens New Materials, 2009-2014
Procurement from Top 5 Suppliers and % of Total Procurement of Comens New Materials, 2009-2014
Revenue and Net Income of Comens New Materials, 2014-2018E
Revenue of Tonsan Adhesive, 2011-2015
Tonsan Adhesive’s Downstream Consumption and Clients
Baiyun Chemical’s New Product Development and Characteristics, 2013-2014H1
Revenue of Major Global and Chinese Engineering Adhesive Manufacturers, 2010-2015
Net Income of Major Global and Chinese Engineering Adhesive Manufacturers, 2010-2015
Net Income of Major Global Engineering Adhesive Manufacturers, 2010-2015
Output of Major Chinese Engineering Adhesive by Product, 2014-2018E
如果这份报告不能满足您的要求,我们还可以为您定制报告,请 留言说明您的详细需求。
|