|
|
|
报告导航:研究报告—
TMT产业—电子半导体
|
|
2014-2015年全球及中国汽车半导体产业研究报告 |
 |
字数:1.2万 |
页数:119 |
图表数:127 |
|
中文电子版:9000元 |
中文纸版:4500元 |
中文(电子+纸)版:9500元 |
|
英文电子版:2200美元 |
英文纸版:2400美元 |
英文(电子+纸)版:2500美元 |
|
编号:ZYW215
|
发布日期:2015-09 |
附件:下载 |
 |
|
|
《2014-2015年全球及中国汽车半导体产业研究报告》包含以下内容:
1、全球汽车市场与产业分析
2、中国汽车市场与产业分析
3、汽车半导体产业与市场分析
4、15家典型汽车半导体企业研究
2014年全球汽车半导体市场规模大约280亿美元,比2013年增长7.3%,预计2015年市场规模达到296亿美元,比2014年增长5.7%,预计2016年增速继续放缓,只有3.7%。增速放缓的原因有两点,一是全球通缩明显,日元和欧元相对美元都大幅度贬值;二是全球最大的汽车市场中国市场面临下滑,在2015年中国汽车市场预计微增1%,而2016年可能下滑2%。
汽车半导体可以分为五大类,分别是功率半导体(Power)、传感器(Sensor)、处理器(Processor,Main for MCU)、ASSP(主要是Connectivity和Amplifier)、Logic和其他。在传统汽车里,平均每辆汽车的半导体成本大约320美元,这其中Power占26%,Sensor占16%。在HEV中,每辆HEV的半导体成本大约690美元,Power占比高达75%,在EV中,半导体成本大约700美元,Power占55%。不过因为油价将长期低迷,HEV/EV的市场空间被大幅度压缩了,如果油价再回到100美元以上,那么汽车半导体市场将大幅度增加。
2015年汽车传感器市场规模大约为47亿美元。汽车传感器主要由CMOS Image Sensor、Pressure、Acceleration 、Speed and Position、Magnetic(Hall effect)、Angle。CMOS Image Sensor领域主要是ON Semiconductor 和OVT。Pressure Sensor最大厂家为Sensata,这也是全球最大的汽车传感器厂家,Sensata还擅长Speed and Position领域。Bosch是全球第二大汽车传感器厂家,擅长Acceleration和Angle。ON Semiconductor则是全球第三大传感器厂家。Infineon是全球第四大汽车传感器厂家,主要擅长Magnetic(Hall effect)和Acceleration。Allegro全球第五大汽车传感器厂家,隶属日本Sanken集团,擅长Magnetic(Hall effect)和Acceleration。比较大的汽车传感器厂家还有Analog Devices、Melexis、Micronas、NXP、STMicroelectronics。
2015年汽车处理器市场规模大约70亿美元,汽车处理器包括MCU,DSP和GPU。汽车MCU市场中,Renesas占绝对第一的位置,市场占有率为40%,Freescale占22%,在32Bits MCU市场中,Freescale所占比例较高。Infineon市场占有率大约13%。TI市场占有率大约8%,其余较大的厂家还有STMicroelectronics和Spansion(Cypress)。
汽车功率半导体主要是Power Management ICs、MOSFET、IGBT、Diodes(Fast Recovery,Schottky,High Voltage)。IGBT价格很高,而HEV/EV需要使用大量的IGBT,这就导致HEV/EV的功率半导体成本大增。小功率电路一般使用MOSFET,高功率大电流电路则需要使用IGBT,而SiC MOSFET则具备最高效率,耐高温,价格相对GaN要低的多,技术也相对更成熟,未来前景看好。
汽车功率半导体领域市场集中度比较低,有很多小厂家的生存空间。值得一提的是丰田为了发展混合动力车而自己投入了功率半导体领域,在IGBT领域的实力不弱于专业的IGBT厂家,而SiC MOSFET领域,丰田的进展速度也不弱于专业的汽车功率半导体厂家。
汽车功率半导体领域第一大厂家是Infineon,其收购了IR,填补了LV MOSFET的短板,市场占有率增加到24%,STMicroelectronics以Power Management见长,排名第二,Renesas、Fuji Electric、Bosch分列三四五名。
Global and China Automotive Semiconductor Industry Report, 2014-2015 mainly focuses on the following:
1. Global automotive market and industry;
2. China’s automotive market and industry;
3. Automotive semiconductor industry and market;
4. Fifteen major automotive semiconductor companies
In 2014, the global automotive semiconductor market size approximated USD28 billion, up 7.3% from 2013. It is predicted that in 2015 the market size will amount to USD29.6 billion, up 5.7% from a year earlier, and that by 2016 the growth rate will continue to decline, to only 3.7%. That was mainly attributed to the following two factors: first, remarkable deflation globally, which resulted in a substantial depreciation of the Japanese yen and the euro against the dollar; second, China, the world’s largest auto market, is very likely to go into decline. In 2015, China’s auto market is expected to edge up merely 1%, but may slide by 2% in 2016.
Automotive semiconductor falls into five categories: power semiconductor, sensor semiconductor, processor (main for MCU) semiconductor, ASSP (principally Connectivity and Amplifier) semiconductor, and logic semiconductor. In the field of traditional automobiles, the semiconductor costs for each unit approximate USD320, of which power occupies 26% and sensor 16%. In HEV, however, this figure is USD690, of which power represents as much as 75%. In EV, the semiconductor costs come to USD700, of which power accounts for 55%. But due to ongoing depressed oil prices, the market space of HEV/EV has been considerably squeezed. If the oil price returns back more than USD100, then the automotive semiconductor market will increase significantly.
In 2015, the market size of automotive sensors would reach about USD4.7 billion. Automotive sensors consist of CMOS Image Sensor, Pressure, Acceleration, Speed and Position, Magnetic (Hall effect), and Angle, among which CMOS Image Sensor mainly involves ON Semiconductor and OVT. The largest pressure sensor player is Sensata, which is also the biggest auto sensor maker worldwide. Moreover, Sensata is adept at Speed and Position. As the world’s second largest auto sensor company, Bosch specializes in Acceleration and Angle. ON Semiconductor is the world’s third largest sensor company. Infineon, the fourth largest sensor player in the world, mainly operates Magnetic (Hall effect) and Acceleration. Allegro, the world’s fifth sensor player under Sanken, is good at Magnetic (Hall effect) and Acceleration. In addition, other large auto sensor companies include Analog Devices, Melexis, Micronas, NXP, and STMicroelectronics.
In 2015, the market size of automotive processors, including MCU, DSP, and GPU, totaled some USD7 billion. In MCU market, Renesas takes absolutely the first place, with a market share of 40%, in contrast to 22% for Freescale. In the 32-Bit MCU market, Freescale accounts for the largest portion, Infineon and TI follows with 13% and 8% share, respectively. Other large players include STMicroelectronics and Spansion (Cypress).
Automotive power semiconductor mainly involves Power Management ICs, MOSFET, IGBT, and Diodes (Fast Recovery, Schottky, and High Voltage). HEV/EV needs a large quantity of IGBT, whose price is very high, thus leading to a sharp increase in costs of power semiconductor. Low-power circuit typically uses MOSFET while high-power and high-current circuit needs IGBT. SiC MOSFET is the most efficient, with high temperature resistance, far lower price than that of GaN, and more mature technology. So, it has good prospects in the future.
Automotive power semiconductor market has a low concentration, which provides a living space to some small companies. It is worth noting that to develop hybrid electric vehicle, Toyota ventured into the field of power semiconductor, so that its strength in IGBT is not inferior to specialized IGBT companies. Besides, Toyota is also not dwarfed by specialized automotive power semiconductor players in SiC MOSFET field.
Infineon, the largest automotive power semiconductor vendor, acquired IR, a move that helped bridge the gap in LV MOSFET, with the market share rising to 24%. STMicroelectronics, which specializes in Power Management, ranks second. What comes next is Renesas, Fuji Electric, and Bosch.
第一章、全球半导体产业
1.1、半导体市场概况
1.2、半导体产业供应链
1.3、半导体产业概况
第二章、全球与中国汽车市场
2.1、全球汽车市场
2.2、中国汽车市场概况
2.3、中国汽车市场近况
第三章、汽车半导体市场与产业
3.1、汽车半导体市场规模
3.2、汽车传感器(Automotive Sensor)简介
3.3、汽车CMOS图像传感器
3.4、汽车传感器产业
3.5、汽车处理器(Processor)
3.6、汽车处理器产业
3.7、汽车功率半导体
3.8、HEV/EV功率半导体
3.9、汽车功率半导体产业
3.10、ADAS、Infotainment、Body半导体分布
3.11、汽车半导体收入排名
第四章、汽车半导体厂家研究
4.1、英飞凌(Infineon)
4.2、博世半导体(Bosch Semiconductor)
4.3、罗姆半导体(Rohm)
4.4、安森美(ON SEMI)
4.5、德州仪器(TI)
4.6、意法半导体(STMicroelectronics)
4.7、瑞萨(Renesas)
4.8、Freescale
4.9、恩智浦半导体(NXP)
4.10、迈来芯(Melexis)
4.11、森萨塔(Sensata)
4.12、富士电机(Fuji Electric)
4.13、TDK
4.14、村田(Murata)
4.15、急速微电子(Allegro)
1 Global Semiconductor Industry
1.1 Market Status
1.2 Supply Chain
1.3 Industry Overview
2 Global and China Automobile Market
2.1 Global Automobile Market
2.2 Automobile Market Overview in China
2.3 Latest Development of Automobile Market in China
3 Automotive Semiconductor Market and Industry
3.1 Automotive Semiconductor Market Size
3.2 Overview of Automotive Sensor
3.3 Automotive CMOS imaging sensor
3.4 Automotive Sensor Industry
3.5 Automotive Processor
3.6 Automotive Processor Industry
3.7 Automotive Power Semiconductor
3.8 HEV/EV Power Semiconductor
3.9 Automotive Power Semiconductor Industry
3.10 Distribution of ADAS, Infotainment, and Body Semiconductor
3.11 Ranking of Automotive Semiconductor by Revenue
4. Automotive Semiconductor Companies
4.1 Infineon
4.2 Bosch Semiconductor
4.3 Rohm
4.4 ON SEMI
4.5 TI
4.6 STMicroelectronics
4.7 Renesas
4.8 Freescale
4.9 NXP
4.10 Melexis
4.11 Sensata
4.12 Fuji Electric
4.13 TDK
4.14 Murata
4.15 Allegro
2013-2019年全球半导体市场规模
2013-2016年全球半导体市场产品分布
2013-2016年全球半导体产品增幅
Semiconductor Outsourced Supply Chain
Semiconductor Company Systems
Semiconductor Outsourced Supply Chain Example
Food Chain IC CAD Design Industry
2014年1季度Top25 Semiconductor Sales Leaders
2015年1季度 Top25 Semiconductor Sales Leaders
2010-2016年全球汽车销量
2003-2015年全球Light Vehicles 产量地域分布
2005-2015年中国汽车销量
2005-2014年中国各类型汽车年销量同比增幅
2012-2018年全球汽车半导体市场规模
2014年汽车半导体产品分布
2012-2018年汽车半导体市场应用分布
汽车传感器分布
传感器在动力系统中的应用
传感器在安全系统中的应用
2009-2018年汽车CMOS图像传感器出货量
2015汽车CMOS图像传感器主要厂家市场占有率
2014-2015年全球汽车传感器厂家收入排名
2013-2014年全球MEMS厂家收入排名
2012、2019年汽车处理器市场规模
2007、2012、2020年 Automotive Processor Per Vehicles
2015年汽车MCU主要厂家市场占有率
EV Vehicles Current Block Diagram
Toyota Prius使用的功率半导体器件
Toyota Lexus Ls600H使用的功率半导体器件
2014年汽车功率半导体主要厂家市场占有率
2013年ADAS 半导体结构
2013年Infotainment Semiconductor By Type
2013年Body Semiconductor By Type
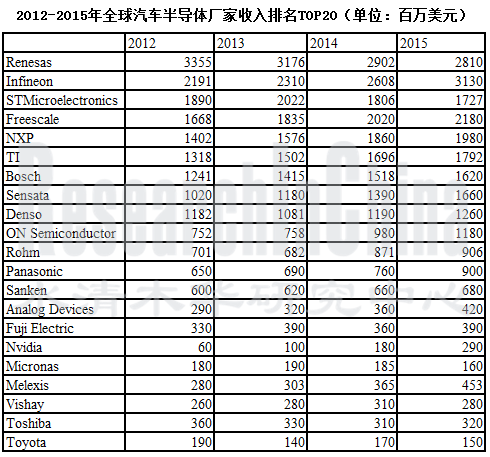
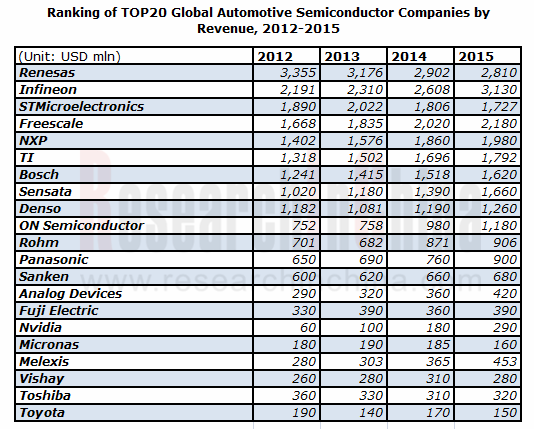
2012-2015年Top 20 汽车半导体厂家收入排名
2010-2015财年英飞凌收入及毛利率
2010-2015财年英飞凌营业利润率和净利率
2015财年上半年英飞凌资产及负债
2015财年上半年英飞凌员工地域分布
2010-2015财年英飞凌收入地域分布
2011-2015财年英飞凌收入部门分布
2011-2015财年英飞凌营业利润部门分布
2014财年英飞凌汽车半导体产品市场份额
英飞凌汽车部门收入地域结构
英飞凌汽车部门收入结构(按产品)
英飞凌汽车部门收入结构(按应用)
2009-2015财年英飞凌投资数据
2011-2016财年Rohm收入及营业利润率
2011-2016财年Rohm收入部门分布
2011-2016财年Rohm营业利润部门分布
2004-2016财年Rohm收入应用分布
ROHM 汽车半导体发展重心
2010-2015 年ON Semi 收入及营业利润
2010-2015 年ON Semi 收入部门结构
2012-2014 年ON Semi 收入地域分布
2012-2017年 ON Semi 收入应用分布
On Semi 主要产品应用及客户
2012-2014年 On Semi汽车半导体业务收入
On Semi 主要产品
2014 年On Semi SPG部门应用结构
On Semi Position
2014 年On Semi SSG部门应用结构
ON SEMI ISG 部门发展历程
2012-2014年 ON SEMI APG部门汽车收入
2010-2015 年TI收入及毛利率
2010-2014年 TI收入部门分布
2010-2014年 TI营业利润部门分布
2013-2015年 TI收入应用分布
TI Automotive Infotainment 框架图
TI 汽车充电点
2010-2015年 STMicro 收入及毛利率
2014 年STMicro收入地域结构
2014 年STMicro 收入产品结构
2005-2016年 STMicro APG 部门收入
STMicro 汽车半导体市场地位
2011-2016财年 Renesas收入及毛利率
2013-2015 财年Renesas 季度毛利率
2013-2015 财年Renesas 季度营业利润率
2013-2015 财年Renesas 汽车业务季度收入
2013-2015 财年Renesas General-purpose业务季度收入
Renesas Automotive Focus
Renesas HEV/EV Automotive Focus
Renesas HEV/EV Automotive MCU 路线图
Renesas Powertratin MCU 路线图
Renesas Chassis MCU 路线图
Renesas Airbag MCU路线图
Renesas ADAS MCU 路线图
Renesas Instrument Cluster MCU 路线图
Renesas Car Audio MCU 路线图
2007-2015年 Freescale收入及营业利润率
2012-2015年Freescale收入业务分布
2014年 Freescale收入客户结构
2011及2014年Freescale收入地域结构
Freescale 主要产品及应用
Freescale ADAS
Major Freescale Location
2010-2015年NXP 收入及营业利润率
2010-2014 年NXP 资产负债表
2014-2015年NXP收入产品分布
2014 年NXP汽车业务收入产品结构
2014 年NXP汽车业务收入地域结构
NXP 客户
Major NXP Automotive Facilities
2010-2015财年Melexis收入及毛利率
2013-2014年Melexis 收入地域分布
2010-2015 年Sensata收入及营业利润
2004-2014年 Sensata资本支出
2012-2015年 Sensata 收入部门分布
2012-2014年Sensata收入地域分布
Sensata+CST收入应用结构
2012-2014 年Sensata Sensor收入分布(按类型)
Fuji Electric Electronic Devices结构
2013-2015财年Fuji Electric Electronic Devices 部门收入及营业利润
2013-2014财年Fuji Electric Electronic Devices 部门收入应用分布
Fuji Electric Electronic Devices Segment 新产品
2006-2015财年TDK收入
2014-2015财年TDK Sales by Segment
2006-2015财年TDK Operation Income
2006-2015财年TDK R&D 支出
2006-2015财年TDK Capex
2012-2015财年TDK收入应用结构
2012-2015财年TDK Passive Components 收入应用结构
2015财年1季度-2016财年1季度TDK收入应用结构
2015-2016财年TDK 季度汽车收入
2009-2016 财年Murata收入及营业利润率
2013-2016财年Murata收入产品分布
Murata 主要产品
2013-2016财年Murata收入应用分布
2014-2015财年Murata营业利润
2012年2季度-2015年1季度Murata收入,订单额及Backlog
2014-2015财年Murata收入地域结构
Global Semiconductor Market Size, 2013-2019E
Global Semiconductor Market Distribution by Product, 2013-2016E
Growth Rate of Global Semiconductor Products, 2013-2016E
Semiconductor Outsourced Supply Chain
Semiconductor Company Systems
Semiconductor Outsourced Supply Chain Example
Food Chain IC CAD Design Industry
Top 25 Semiconductor Sales Leaders, 1Q2014
Top25 Semiconductor Sales Leaders, 1Q2015
Global Automobile Sales Volume, 2010-2015
Global Light Vehicle Output by Region, 2003-2015
Automobile Sales Volume in China, 2005-2015
Output YoY Growth of Vehicles in China by Model, 2008-2015
Global Automotive Semiconductor Market Size, 2012-2018E
Automotive Semiconductor Distribution by Product, 2014
Automotive Semiconductor Distribution by Application, 2012-2018E
Automotive Sensor Distribution
Sensors in Powertrain Applications
Sensors in Safety Applications
Shipments of Automotive CMOS Imaging Sensors, 2009-2018E
Market Share of Major Automotive CMOS Imaging Sensor Manufacturers, 2015
Ranking of Automotive Sensor Player by Revenue, 2014-2015
Ranking of Global MEMS Manufacturers by Revenue, 2013-2014
Automotive Processor Market Size, 2012 vs 2019E
Automotive Processor Per Vehicles, 2007 vs 2012 vs 2020E
Market Share of Major Automotive MCU Manufacturers, 2015
EV Vehicles Current Block Diagram
Power Semiconductor Devices in Toyota Prius
Power Semiconductor Devices in Toyota Lexus Ls600H
Market Share of Major Power Semiconductor Companies, 2014
ADAS Semiconductor by Type, 2013
Infotainment Semiconductor by Type, 2013
Body Semiconductor by Type, 2013
Ranking of Top 20 Automotive Semiconductor Companies by Revenue, 2012-2015
Infineon’s Revenue vs Gross Margin, FY2010-FY2015
Infineon’s Operation Margin and Net Margin, FY2010-FY2015
Infineon’s Assets and Liabilities, CY2015 H1
Infineon’s Employee by Region, CY2015 H1
Infineon’s Revenue by Region, FY2010-FY2015
Infineon’s Revenue by Segment, FY2011-FY2015
Infineon’s Operation Profit by Segment, FY2011-FY2015
Infineon’s Automotive Semiconductors Position
Infineon’s Automotive Segment Revenue by Region
Infineon’s Automotive Segment Revenue by Product
Infineon’s Automotive Segment Revenue by Application
Infineon’s Investments, FY2009-FY2015
Rohm’s Sales and Operation Margin, FY2011-FY2016
Rohm’s Sales by Segment, FY2011-FY2016
Rohm’s Operation Profit by Segment, FY2011-FY2016
Rohm’s Revenue by Application, FY2004-FY2016
ON Semi’s Revenue vs Operation Income, 2010-2015
Revenue of ON Semi by Segment, 2010-2015
Revenue Structure of ON Semi by Geographic Location, 2012-2014
Revenue Structure of ON Semi by Application, 2012-2017E
On Semi’s Major Product Application and Customer
On Semi’s Automotive Semiconductor Focus, 2014
On Semi’s Major Products
On Semi’s SPG Segment by Application, 2014
On Semi’s Position
On Semi’s SSG Segment by Application, 2014
ON SEMI’s ISG Segment Milestone
ON SEMI’s APG Segment Automotive Revenue, 2012-2014
TI’s Revenue vs Gross Margin, 2010-2015
TI’s Revenue by Segment, 2010-2014
TI’s Operation Profit by Segment, 2010-2014
TI’s Revenue by Application, 2013-2015
TI’s Automotive Infotainment Block Diagram
TI’s Automotive Charging Spot
STMicro Revenue vs Gross Margin, 2010-2015
STMicro’s Revenue by Region, 2014
STMicro’s Revenue by Product, 2014
STMicro’s APG Segment Revenue, 2005-2014
STMicro’s Automotive Semiconductor Market Position
Renesas’ Revenue vs Gross Margin, FY2011-FY2016
Renesas’ Gross Margin, Q2/CY2013-Q2/CY2015
Renesas’ Operation Margin, Q2/CY2013-Q2/CY2015
Renesas’ Automotive Business Revenue, Q2/CY2013-Q2/CY2015
Renesas’ General-purpose Business Revenue, Q2/CY2013-Q2/CY2015
Renesas Automotive Focus
Renesas HEV/EV Automotive Focus
Renesas HEV/EV Automotive MCU Roadmap
Renesas Powertrain MCU Roadmap
Renesas Chassis MCU Roadmap
Renesas Airbag MCU Roadmap
Renesas ADAS MCU Roadmap
Renesas Instrument Cluster MCU Roadmap
Renesas Car Audio MCU Roadmap
Freescale’s Revenue vs Operation Margin, 2007-2015
Freescale’s Revenue Breakdown by business, 2012-2015
Freescale’s Revenue Breakdown by customer, 2014
Freescale’s Revenue Breakdown by region, 2011 vs 2014
Freescale’s Major Product and Application
Freescale ADAS
Major Locations of Freescale
NXP Revenue Vs Operation Margin, 2010-2015
NXP Consolidated Balance Sheet Data, 2010-2014
NXP Automotive Sales by Product, 2014
NXP Automotive Sales by Region, 2014
NXP Customers
Major NXP Automotive Facilities
Melexis’ Financial Position, CY 2015H1
Melexis’ Revenue by Region, 2013-2014
Sensata’s Revenue vs Operation Income, 2010-2015
Sensata’s Capital Expenditures, 2004-2014
Sensata’s Revenue by Segment, 2012-2015
Sensata’s Revenue by Region, 2012-2014
Sensata+CST’s Revenue by Application
Sensata’s Sensor Revenue by Type, 2012-2014
Structure of Fuji Electric Electronic Devices Segment
Sales and Operation Income of Electronic Devices Segment, FY2013-FY2015
Sales of Fuji Electric Electronic Devices Segment by Application, FY2013-FY2014
New Products of Fuji Electric Electronic Devices Segment
TDK’s Net Sales, FY2006-FY2015
TDK’s Sales by Segment, FY2014-FY2015
TDK’s Operation Income, FY2006-FY2015
TDK’s R&D Costs, FY2006-FY2015
TDK’s Capex, FY2006-FY2015
TDK’s Sales by application, FY2012-FY2015
TDK’s Passive Components Sales by Application, FY2012-FY2015
Quarterly Sales of TDK by applications, 1Q/FY2015-1Q/FY2016
Quarterly Sales of TDK For Automobiles, 1Q/FY2015-1Q/FY2016
Murata’s Sales and Operation Margin, FY2009-FY2016
Murata’s Sales by product, FY2013-FY2016
Murata’s Major Products
Murata’s sales by Application, FY2013-FY2016
Murata’s Operation Income Bridge, FY2014-FY2015
Murata’s Quarterly Sales, Order and Backlog, 2012Q2-2015Q1
Murata’s Sales by Region, FY2014-FY2015
如果这份报告不能满足您的要求,我们还可以为您定制报告,请 留言说明您的详细需求。
|