|
|
|
报告导航:研究报告—
制造业—材料
|
|
2014-2018年全球及中国生物降解塑料行业研究报告 |
 |
字数:4.0万 |
页数:98 |
图表数:79 |
|
中文电子版:8500元 |
中文纸版:4250元 |
中文(电子+纸)版:9000元 |
|
英文电子版:2300美元 |
英文纸版:2500美元 |
英文(电子+纸)版:2600美元 |
|
编号:HK061
|
发布日期:2015-09 |
附件:下载 |
 |
|
|
生物降解塑料(Biodegradable Plastic)是在自然环境或堆肥条件下通过微生物的生命活动能很快降解的高分子材料。目前全球生物降解塑料主要应用于包装行业,占市场总量的70%以上。
近年来,随着低碳经济的持续推进,全球生物降解塑料产量保持较快的增长速度,2014年约达66.8万吨。全球能够实现工业化生产的生物降解塑料主要有淀粉基塑料(PSM)、聚乳酸(PLA)、聚丁二酸丁二醇酯(PBS)等,2014年全球这三种产品的产量占比分别为41%、24%和21%。
全球生物降解塑料需求主要集中于欧洲和北美,2014年这两个地区的生物降解塑料需求量合计占比约达70%。不过,近年来亚洲市场生物降解塑料需求增长较快,预计2018年有望增长至32.3%。
全球生物降解塑料企业主要由欧洲、美国、日本企业占据,如欧洲的巴斯夫、Novamont、Corbion,美国的NatureWorks、Metabolix,日本的三菱化学、昭和电工等。其中德国巴斯夫和美国NatureWorks产能最大,分别拥有14万吨/年的PBS产能和14万吨/年的PLA产能。
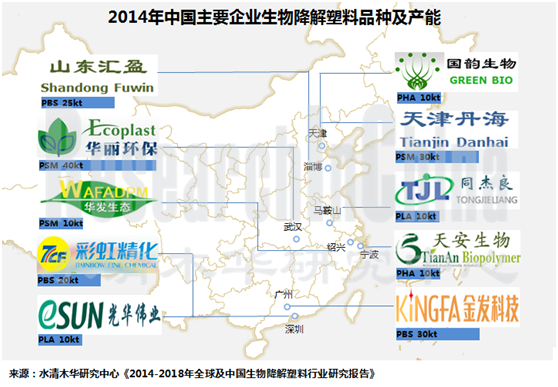
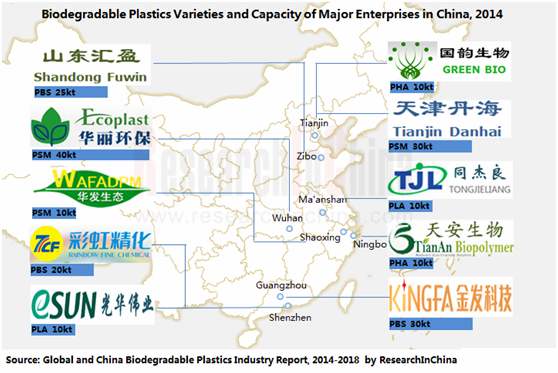
目前,中国生物降解塑料市场处于供过于求的状态,大部分生产企业依托出口维持运营,国内市场需求较低。但是,随着政府对能源浪费、环境保护的日益重视,生物降解塑料产业政策有望陆续出台,进而带动中国生物降解塑料需求较快增长。2014年,中国生物降解塑料产能达到38万吨左右,主要应用市场为包装薄膜、农用薄膜、日用塑料等领域。
2014年,中国生物降解塑料生产企业主要包括华丽环保、金发科技、天津丹海、山东汇盈、彩虹精化等,这五家企业产能之和约占全国总产能的40%。
目前,中国拟在建生物降解塑料项目较多,包括金发科技PBSA二期9万吨/年扩建项目、亿帆鑫富2万吨/年的全生物降解塑料PBS项目二期、彩虹精化新建年产6万吨/年低碳生物分解材料与制品项目、华丽环保6万吨/年生物塑料研发生产基地项目等。
水清木华研究中心《2014-2018年全球及中国生物降解塑料行业研究报告》主要包括以下几个内容:
 全球生物降解塑料市场供需分析、产品结构、区域结构、竞争格局、发展趋势等; 全球生物降解塑料市场供需分析、产品结构、区域结构、竞争格局、发展趋势等;
中国生物降解塑料市场供需分析、竞争格局、发展趋势等;
PSM、PLA、PHA、PBS等生物降解塑料细分产品的发展现状、竞争格局等;
全球及中国25家生物降解塑料生产企业的运营状况、生物降解塑料业务分析及发展前景等。
Biodegradable plastics are polymer materials which are quickly degradable through microbial life activities in natural environments or under conditions of composting. Currently, more than 70% of global biodegradable plastics are used in the packaging industry.
In recent years, with the continued promotion of the low-carbon economy, the global biodegradable plastics output has maintained a high growth rate, attaining about 668 kilotons in 2014. All over the world, only plastarch material (PSM), polylactic acid (PLA), polybutylene succinate (PBS), etc. have realized industrial production. In 2014, PSM, PLA and PBS accounted for 41%, 24% and 21% of the world's total output, respectively.
Global demand for biodegradable plastics is mainly concentrated in Europe and North America, and their demand accounted for approximately 70% in 2014 together. However, in recent years, the Asian market has generated fast-growing demand, which is expected to represent 32.3% in 2018.
Global biodegradable plastics enterprises are mainly from Europe, America and Japan, such as Europe-based BASF, Novamont and Corbion, America-based NatureWorks and Metabolix, Japan-based Mitsubishi Chemical and Showa Denko. By capacity, BASF and NatureWorks top the list with respective capacities of 140 kt/a PBS and 140 kt/a PLA.
At present, Chinese biodegradable plastics market witnesses oversupply, most manufacturers rely on exports, and the domestic demand stays at a low level. However, as the government pays more attention to energy waste and environmental protection, biodegradable plastics industry policies are expected to be launched soon, thus stimulating China’s demand for biodegradable plastics swiftly. In 2014, China’s biodegradable plastics capacity reached around 380 kilotons, mainly serving packaging film, agricultural film, household plastics and other fields.
In 2014, Chinese biodegradable plastics manufacturers included Wuhan Huali Environment Technology, Kingfa Sci & Tech, Tianjin Danhai, Shandong Fuwin, Shenzhen Rainbow Fine Chemical Industry, etc. The capacity of these five companies accounted for about 40% of the national total capacity.
Now, China intends to build numerous biodegradable plastics projects, including a 90 kt/a PBSA Phase II expansion project of Kingfa Sci & Tech, a 20 kt/a biodegradable plastics PBS project Phase II of Yifan Xinfu Pharmaceutical, a 60 kt/a low-carbon biodegradable materials and products project of Shenzhen Rainbow Fine Chemical Industry, a 60 kt/ a bio-plastics R & D production base project of Wuhan Huali Environment Technology.
The report mainly covers the followings:
 Supply and demand, product mix, regional structure, competition pattern, development trends of global biodegradable plastics market; Supply and demand, product mix, regional structure, competition pattern, development trends of global biodegradable plastics market;
Supply and demand, competition pattern, development trends of Chinese biodegradable plastics market;
Development status and competition pattern of biodegradable plastic product segments such as PSM, PLA, PHA, PBS;
Operation, biodegradable plastics business, prospects, etc. of 25 domestic and foreign biodegradable plastics manufacturers.
第一章 生物降解塑料行业概述
1.1 定义
1.2 分类
1.3 产业链
第二章 全球生物降解塑料市场分析
2.1 供需分析
2.2 产品结构
2.3 区域结构
2.4.1 美国
2.4.2 欧洲
2.4.3 日本
2.4.4 巴西
2.4.5 泰国
2.5 技术趋势
2.6 竞争格局
2.7 发展趋势
第三章 中国生物降解塑料市场分析
3.1 市场供给
3.2 市场需求
3.3 竞争格局
3.4 政策趋势
3.5 发展趋势
第四章 生物降解塑料行业细分市场分析
4.1 可塑淀粉生物降解塑料(PSM)
4.1.1 发展现状
4.1.2 竞争格局
4.2 聚乳酸(PLA)
4.2.1 简介
4.2.2 竞争格局
4.3 聚羟基烷酸酯(PHA)
4.3.1 发展现状
4.3.2 竞争格局
4.4 聚丁二酸丁二醇酯(PBS)
4.4.1 简介
4.4.2 竞争格局
4.5 其他
4.5.1 聚己内酯(PCL)
4.5.2 二氧化碳共聚物(PPC)
4.5.3 脂肪族芳香族共聚酯
4.5.4 聚乙烯醇(PVA)
第五章 生物降解塑料行业主要外国企业
5.1 德国巴斯夫(BASF)
5.1.1 企业简介
5.1.2 经营情况
5.1.3 功能材料及解决方案部门经营情况
5.1.4 生物降解塑料业务
5.1.5 在华业务
5.2 NatureWorks
5.2.1 企业简介
5.2.2 在华业务
5.3 Novamont
5.3.1 企业介绍
5.4 美国杜邦(DuPont)
5.4.1 公司简介
5.4.2 经营情况
5.4.3 生物降解材料业务
5.4.4 在华业务
5.5 三菱化学
5.5.1 公司简介
5.5.2 经营情况
5.5.3 生物降解塑料业务
5.5.4 在华业务
5.6 昭和电工
5.6.1 企业简介
5.6.2 经营情况
5.6.3 生物降解塑料业务
5.7 科碧恩(Corbion)
5.7.1 公司简介
5.7.2 经营情况
5.7.3 生物降解塑料业务
第六章 生物降解塑料行业中国主要企业
6.1 金发科技
6.1.1 企业简介
6.1.2 经营情况
6.1.3 营收构成
6.1.4 毛利率
6.1.5 研发
6.1.6 生物降解塑料业务
6.1.7 发展与预测
6.2 亿帆鑫富
6.2.1 企业简介
6.2.2 经营情况
6.2.3 营收构成
6.2.4 毛利率
6.2.5 研发
6.2.6 生物降解塑料业务
6.2.7 发展与预测
6.3 彩虹精化
6.3.1 企业简介
6.3.2 经营情况
6.3.3 营收构成
6.3.4 毛利率
6.3.5 研发
6.3.6 生物降解塑料业务
6.3.7 发展与预测
6.4 华丽环保
6.4.1 企业简介
6.4.2 生物降解塑料业务
6.5 和兴化工
6.5.1 企业简介
6.5.2 生物降解塑料业务
6.6 中国其他生物降解塑料生产商发展动态
6.6.1 海正生物
6.6.2 天安生物
6.6.3 浙江天禾
6.6.4 永乐生物
6.6.5 同杰良生物
6.6.6 华发生态
6.6.7 福建百事达
6.6.8 上九生物
6.6.9 山东汇盈
6.6.10 天津丹海
6.6.11 国韵生物
6.6.12 光华伟业
6.6.13 蓝山屯河
第七章 总结与预测
7.1 总结
7.2 供需预测
7.2.1 全球市场
7.2.2 中国市场
1. Overview of Biodegradable Plastics Industry
1.1 Definition
1.2 Classification
1.3 Industry Chain
2. Global Biodegradable Plastics Market
2.1 Supply and Demand
2.2 Product Mix
2.3 Regional Structure
2.3.1 USA
2.3.2 Europe
2.3.3 Japan
2.3.4 Brazil
2.3.5 Thailand
2.4 Technology Trends
2.5 Competition Pattern
2.6 Development Trends
3. China Biodegradable Plastics Market
3.1 Market Supply
3.2 Market Demand
3.3 Competition Pattern
3.4 Policy Trends
3.5 Development Trends
4. Biodegradable Plastics Market Segments
4.1 Plastarch Material (PSM)
4.1.1 Development Status
4.1.2 Competition Pattern
4.2 Polylactic Acid (PLA)
4.2.1 Introduction
4.2.2 Competition Pattern
4.3 Polyhydroxyalkanoates (PHA)
4.3.1 Development Status
4.3.2 Competition Pattern
4.4 Polybutylene Succinate (PBS)
4.4.1 Introduction
4.4.2 Competition Pattern
4.5 Others
4.5.1 Polycaprolactone (PCL)
4.5.2 Polypropylene Carbonate (PPC)
4.5.3 Aliphatic-Aromatic Copolyester
4.5.4 Polyvinyl Alcohol (PVA)
5. Main Foreign Players
5.1 BASF
5.1.1 Profile
5.1.2 Operation
5.1.3 Operation of Functional Materials & Solutions Division
5.1.4 Biodegradable Plastics Business
5.1.5 Business in China
5.2 NatureWorks
5.2.1 Profile
5.2.2 Business in China
5.3 Novamont
5.3.1 Profile
5.4 DuPont
5.4.1 Profile
5.4.2 Operation
5.4.3 Biodegradable Materials Business
5.4.4 Business in China
5.5 Mitsubishi Chemical
5.5.1 Profile
5.5.2 Operation
5.5.3 Biodegradable Plastics Business
5.5.4 Business in China
5.6 Showa Denko
5.6.1 Profile
5.6.2 Operation
5.6.3 Biodegradable Plastics Business
5.7 Corbion
5.7.1 Profile
5.7.2 Operation
5.7.3 Biodegradable Plastics Business
6. Main Chinese Players
6.1 Kingfa Sci & Tech
6.1.1 Profile
6.1.2 Operation
6.1.3 Revenue Structure
6.1.4 Gross Margin
6.1.5 R & D
6.1.6 Biodegradable Plastics Business
6.1.7 Development and Forecast
6.2 Yifan Xinfu Pharmaceutical
6.2.1 Profile
6.2.2 Operation
6.2.3 Revenue Structure
6.2.4 Gross Margin
6.2.5 R & D
6.2.6 Biodegradable Plastics Business
6.2.7 Development and Forecast
6.3 Shenzhen Rainbow Fine Chemical Industry
6.3.1 Profile
6.3.2 Operation
6.3.3 Revenue Structure
6.3.4 Gross Margin
6.3.5 R & D
6.3.6 Biodegradable Plastics Business
6.3.7 Development and Forecast
6.4 Wuhan Huali Environment Technology
6.4.1 Profile
6.4.2 Biodegradable Plastics Business
6.5 Anqing Hexing Chemical
6.5.1 Profile
6.5.2 Biodegradable Plastics Business
6.6 Others
6.6.1 Zhejiang Hisun Biomaterials Co., Ltd.
6.6.2 Ningbo Tianan Biologic Material Co., Ltd.
6.6.3 Zhejiang Tianhe Environmental Technology Co., Ltd.
6.6.4 Henan Yongle Biological Engineering Co., Ltd.
6.6.5 Maanshan Tong-Jie-Liang Biomaterials Co., Ltd.
6.6.6 Zhejiang Wafa Ecosystem Science & Technology Co., Ltd.
6.6.7 Fujian Beststarch Biodegradable Material Co., Ltd.
6.6.8 Guangdong Shangjiu Biodegradable Plastics Co., Ltd.
6.6.9 Shandong Fuwin New Material Co., Ltd.
6.6.10 Tianjin Danhai Co., Ltd.
6.6.11 Tianjin GreenBio Materials Co., Ltd.
6.6.12 Shenzhen BrightChina Industrial Co., Ltd.
6.6.13 Xinjiang Blue Ridge Tunhe Chemical Industry Joint Stock Co., Ltd
7. Summary and Forecast
7.1 Summary
7.2 Supply and Demand Forecast
7.2.1 Global Market
7.2.2 Chinese market
表:生物降解塑料(按原料)分类及用途
图:生物降解塑料行业产业链
图:2013-2015年全球生物降解塑料产量
图:2014年全球生物降解塑料(分用途)需求量占比
图:2014年全球生物降解塑料(分品种)产量占比
图:2013年全球生物降解塑料(分地区)需求量占比
图:2014年全球生物降解塑料(分地区)产能占比
表:日本从事生物降解塑料应用开发的企业及其主要事件
表:2008-2015年生物降解塑料技术发展
表:2014年全球生物降解塑料主要企业及产能
图:2009-2015年中国生物降解塑料产能及增长率
图:2009-2015年中国塑料薄膜产量及同比增长
图:2009-2015年中国农用薄膜产量及同比增长
图:2013年中国生物降解塑料主要企业产能
表:中国生物降解塑料行业相关政策
表:PSM塑料主要成分及来源
表:2014全球淀粉基生物降解塑料主要企业产能分布
表:聚乳酸材料的性能和用途
表:2014年全球PLA降解生物塑料主要企业产能
表:PHA在医药领域的主要应用
表:聚羟基烷酸脂材料进化史
表:2014年全球PHA生物降解塑料主要企业产能
表:2014年全球PBS降解塑料主要企业产能
表:2014年中国PPC主要生产企业及其产能
表:巴斯夫事业部门及其主营业务
图:2010-2015年巴斯夫销售收入及净利润
图:2015上半年巴斯夫(分部门)销售收入占比
图:2012-2015年巴斯夫功能材料及解决方案部门销售收入及EBITDA
表:2013-2015年巴斯夫功能材料及解决方案部门(分产品)销售收入
图:2013-2015年巴斯夫功能材料及解决方案部门(分产品)销售收入占比
图:2014年巴斯夫高性能材料业务(分地区)销售收入占比
表:Ecoflex与Ecovio的成分及用途
图:2010-2015年美国杜邦净销售额和净利润
图:2013-2015年美国杜邦(分部门)销售收入占比
图:2012-2014年美国杜邦(分地区)销售收入占比
图:FY2010-FY2014三菱化学控股净销售额与净利润
表:FY2014三菱化学运营领域及主营业务销售收入占比
图:2010-2015年昭和电工净销售额及净利润
图:2015H1昭和电工(分部门)净销售额占比
表:普拉克公司主要产品和业务领域
图:2012-2015年科碧恩销售收入及EBITDA
图:2014年科碧恩(分部门)净销售额占比
图:2014年科碧恩生物化学品部门(分产品)收入占比
图:2014年科碧恩(分地区)净销售额占比
表:2014年普拉克公司生产工厂情况
图:2010-2015年金发科技营业收入及净利润
表:2013-2015年金发科技(分产品)营业收入
图:2013-2015年金发科技(分产品)营业收入占比
表:2013-2015年金发科技(分地区)营业收入
图:2013-2015年金发科技(分地区)营业收入占比
图:2013-2015年金发科技研发支出及占营业收入的比例
图:2012-2015年珠海万通总资产及净利润
图:2010-2015年亿帆鑫富营业收入及净利润
表:2014-2015年亿帆鑫富(分产品)营业收入
图:2014-2015年亿帆鑫富(分产品)营业收入占比
表:2014-2015年亿帆鑫富(分地区)营业收入
图:2014-2015年亿帆鑫富(分地区)营业收入
图:2014-2015年亿帆鑫富(分产品)毛利率
图:2013-2015年亿帆鑫富研发支出及占营业收入的比例
表:2012-2014年亿帆鑫富高分子材料业务(分产品)营业收
图:2012-2014年亿帆鑫富高分子材料业务(分产品)营业收入占比
图:2014年亿帆鑫富高分子材料业务(分产品)毛利率
表:2014-2018年亿帆鑫富营业收入和净利润预测
图:2010-2015年彩虹精化营业收入及净利润
表:2013-2015年彩虹精化(分产品)营业收入
图:2013-2015年彩虹精化(分产品)营业收入占比
表:2013-2015年彩虹精化(分地区)营业收入
图:2013-2015年彩虹精化(分地区)营业收入占比
图:2013-2015年彩虹精化研发支出及占营业收入的比例
图:2012-2014年彩虹精化生物基材料及制品产销量
图:2013-2015年虹彩科技营业收入和净利润
表:2014-2018年彩虹精化营业收入和净利润预测
表:华丽环保生物降解塑料业务发展历程
图:2014年全球生物降解塑料(分地区)需求量、产量占比
表:2014年全球及中国主要企业生物降解塑料产能对比
图:2014-2018年全球生物降解塑料产量及增长率预测
图:2018年全球生物降解塑料应用领域预测
图:2018年全球生物降解塑料(分地区)需求占比预测
表:2014-2018年中国塑料薄膜、农业薄膜、生物降解塑料薄膜产量预测
Classification and Usage of Biodegradable Plastics (by Raw Materials)
Biodegradable Plastics Industry Chain
Global Biodegradable Plastics Output, 2013-2015
Global Biodegradable Plastics Demand Structure by Usage, 2014
Global Biodegradable Plastics Output Structure by Variety, 2014
Global Biodegradable Plastics Demand Structure by Region, 2013
Global Biodegradable Plastics Capacity Structure by Region, 2014
Major Events of Japanese Enterprises Engaged in Biodegradable Plastic Application Development
Biodegradable Plastic Technology Development, 2008-2015
Main Biodegradable Plastic Enterprises and Their Capacity in the World, 2014
China’s Biodegradable Plastic Capacity and Growth Rate, 2009-2015
China’s Plastic Film Output and YoY Growth, 2009-2015
China’s Agricultural Film Output and YoY Growth, 2009-2015
Capacity of Main Biodegradable Plastics Enterprises in China, 2013
Policies of China’s Biodegradable Plastics Industry
Main Constituents and Source of PSM
Capacity Distribution of PSM Companies in the World, 2014
Properties and Applications of PLA
Capacity of Main PLA Companies in the World, 2014
Main Application of PHA in Medicine
Evolution of PHA
Capacity of Main PHA Companies in the World, 2014
Capacity of Main PBS Companies in the World, 2014
Main PPC Companies and Their Capacity in China, 2014
BASF’s Divisions and Main Business
BASF's Revenue and Net Income, 2010-2015
BASF's Revenue Structure (by Division), H1 2015
Revenue and EBITDA of BASF's Functional Materials & Solutions Division, 2012-2015
Sales of BASF's Functional Materials & Solutions Division (by Product), 2013-2015
Revenue Structure of BASF's Functional Materials & Solutions Division (by Product), 2013-2015
Revenue Structure of BASF's Functional Materials & Solutions Division (by Region), 2014
Composition and Usages of Ecoflex and Ecovio
DuPont's Net Sales and Net Income, 2010-2015
DuPont's Revenue Structure (by Division), 2013-2015
DuPont's Revenue Structure (by Region), 2012-2014
Net Sales and Net Income of Mitsubishi Chemical, FY2010-FY2014
Operational Fields and Main Business of Revenue Structure of Mitsubishi Chemical, FY2014
Net Sales and Net Income of Showa Denko, 2010-2015
Net Sales Structure of Showa Denko (by Division), H1 2015
Purac's Main Products and Business Fields
Corbion's Revenue and EBITDA, 2012-2015
Corbion's Net Sales Structure (by Division), 2014
Revenue Contribution of Corbion's Biochemical Division (by Product), 2014
Corbion's Net Sales Structure (by Region), 2014
Purac's Plants, 2014
Revenue and Net Income of Kingfa Sci & Tech, 2010-2015
Revenue of Kingfa Sci & Tech (by Product), 2013-2015
Revenue Structure of Kingfa Sci & Tech (by Product), 2013-2015
Revenue of Kingfa Sci & Tech (by Region), 2013-2015
Revenue Structure of Kingfa Sci & Tech (by Region), 2013-2015
R & D Costs and% of Total Revenue of Kingfa Sci & Tech, 2013-2015
Total Assets and Net Income of Zhuhai Wantong, 2012-2015
Revenue and Net Income of Yifan Xinfu Pharmaceutical, 2010-2015
Revenue of Yifan Xinfu Pharmaceutical (by Product), 2014-2015
Revenue Structure of Yifan Xinfu Pharmaceutical (by Product), 2014-2015
Revenue of Yifan Xinfu Pharmaceutical (by Region), 2014-2015
Revenue of Yifan Xinfu Pharmaceutical (by Region), 2014-2015
Gross Margin of Yifan Xinfu Pharmaceutical (by Product), 2014-2015
R & D Costs and% of Total Revenue of Yifan Xinfu Pharmaceutical, 2013-2015
Polymer Materials Revenue of Yifan Xinfu Pharmaceutical (by Product), 2012-2014
Polymer Materials Revenue Structure of Yifan Xinfu Pharmaceutical (by Product), 2012-2014
Gross Margin of Polymer Materials Business of Yifan Xinfu Pharmaceutical (by Product), 2014
Revenue and Net Income of Yifan Xinfu Pharmaceutical, 2014- 2018E
Revenue and Net Income of Shenzhen Rainbow Fine Chemical Industry, 2010-2015
Revenue of Shenzhen Rainbow Fine Chemical Industry (by Product), 2013-2015
Revenue Structure of Shenzhen Rainbow Fine Chemical Industry (by Product), 2013-2015
Revenue of Shenzhen Rainbow Fine Chemical Industry (by Region), 2013-2015
Revenue Structure of Shenzhen Rainbow Fine Chemical Industry (by Region), 2013-2015
R & D Costs and% of Total Revenue of Shenzhen Rainbow Fine Chemical Industry, 2013-2015
Output and Sales Volume of Bio-based Materials and Products of Shenzhen Rainbow Fine Chemical Industry, 2012-2014
Revenue and Net Income of Shenzhen Rainbow Fine Chemical Industry, 2013-2015
Revenue and Net Income of Shenzhen Rainbow Fine Chemical Industry, 2014- 2018E
Development Process of Biodegradable Plastics Business of Wuhan Huali Environment Technology
Global Demand and Output Structure of Biodegradable Plastics (by Region), 2014
Biodegradable Plastics Capacity Comparison between Global and Chinese Enterprises, 2014
Global Biodegradable Plastics Output and Growth Rate, 2014- 2018E
Global Biodegradable Plastics Applications, 2018E
Global Biodegradable Plastics Demand Structure (by Region), 2018E
Output of Plastic Films, Agricultural Film and Biodegradable Plastic Film in China, 2014-2018E
如果这份报告不能满足您的要求,我们还可以为您定制报告,请 留言说明您的详细需求。
|