|
|
|
报告导航:研究报告—
制造业—能源矿产
|
|
2015年中国节能服务行业研究报告 |
 |
字数:3.9万 |
页数:128 |
图表数:136 |
|
中文电子版:8000元 |
中文纸版:4000元 |
中文(电子+纸)版:8500元 |
|
英文电子版:2400美元 |
英文纸版:2600美元 |
英文(电子+纸)版:2700美元 |
|
编号:WLQ034
|
发布日期:2015-09 |
附件:下载 |
 |
|
|
节能服务产业是为企业和项目在节能减排等方面提供服务和支持的产业。节能服务公司(ESCO)是指提供用能状况诊断、能效项目设计、改造(施工、设备安装、调试)、运行管理等服务的专业化公司。节能服务公司开展节能业务主要商业模式为合同能源管理EMC(Energy Management Contracting)/EPC(Energy Performance Contracting)等,包括节能效益分享型、节能量保证型、能源费用托管型等。
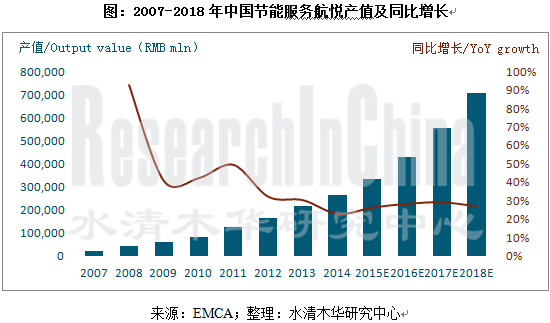
截至2014年底,中国节能服务业企业数量和从业人员分别为5125家、56.2万人,分别同比增长5.6%、10.6%。2014年,中国节能服务产业总产值2650.37 亿,同比增长23.0%(2007-2013年,每年增速都在30%以上)。
从商业模式来看,合同能源管理模式占据较大地位,2014 年,合同能源管理投资额958.76 亿,同比增长29.2%,在行业产值中占比36.2%。就具体方式看,节能效益分享型占据主导地位。受节能服务公司资本额限制,未来,EMC模式中的节能量保证型和能源费用托管型在EMC投资额中占比有望提升。同时,随着中国落实“允许社会资本通过特许经营等方式参与城市基础设施投资和运营”的改革后,PPP模式(由节能服务公司、社会资本、政府参与)的节能服务有望在基础设施和公共事业领域成为主导模式。
从应用领域来看,目前,中国节能服务应用领域以工业领域(能耗占全国能源消费总量的70%左右)为主,工业领域的节能服务产值在行业总产值中占比达到70%以上。在工业领域中,节能服务主要集中在余热/余压回收利用,电机系统节能,能量系统优化,窑炉/锅炉改造等领域。除工业外,建筑、交通等领域的节能潜力也较大,如截至2014年底,中国既有建筑节能改造市场潜力达到44,340亿元。
从节能服务公司项目服务方式来看,目前,因资产规模较小,融资不易,中国节能服务公司提供的服务主要是投资额较小的单项节能类型业务。随着,融资渠道拓展和业务水平提高,未来,为客户提供系统(包括供热系统、空调制冷系统、照明系统、通风换气系统、水系统等多项子系统)的集节能、环保、智能化为一体的综合解决方案成为趋势。
《2015年中国节能服务行业研究报告》主要包括以下内容:
 节能服务行业概况(包括定义,商业模式,美国和中国合同能源管理模式对比,PPP模式等) 节能服务行业概况(包括定义,商业模式,美国和中国合同能源管理模式对比,PPP模式等)
节能服务行业运行(包括相关政策,企业和员工数量,行业产值,EMC投资,应用领域,竞争格局等)
节能服务细分市场(包括余热发电/电机节能/建筑节能行业现状、市场规模、竞争格局、发展前景等)
17家主要节能服务公司(包括公司简介、经营业绩、营收构成、毛利率、节能服务业务、发展战略等)
Energy conservation service industry provides service and support for enterprises and projects in terms of energy conservation and emission reduction. An Energy Service Company, more commonly referred to as an "ESCO," is a company that provides/installs and manages a suite of comprehensive energy solutions for a client company which reduces the energy expenses and greenhouse gas emissions for the client. Main business models for an ESCO to carry out energy saving business are Energy Management Contracting (EMC) / Energy Performance Contracting (EPC), etc, involving Shared Savings, Guaranteed Savings, Chauffage, etc.
By the end of 2014, there were 5,125 energy conservation service companies and 562,000 practitioners in China, up 5.6% and 10.6% respectively on a year-on-year basis. In 2014, China’s energy conservation service industry created output value of RMB265.037 billion, up 23.0% year-on-year (annual growth of 30% or over during 2007-2013)
Output Value and YoY Growth of China Energy Conservation Service Industry, 2007-2018E
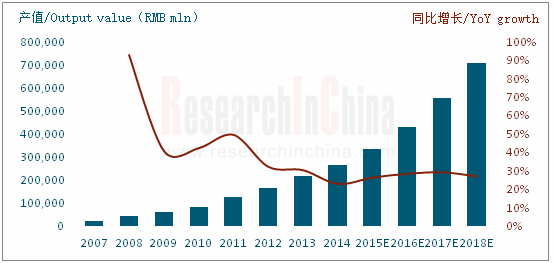
Source: EMCA, ResearchInChina
With respect to business models, EMC occupies an important position, seeing investment up 29.2% year-on-year to RMB95.876 billion, making up 36.2% of the industry’s output value. Concerning specific ways, shared savings dominates the market. Restricted by capital of energy conservation service companies, guaranteed savings and chauffage are expected to see a larger proportion of EMC investment in the future. At the same time, along with China’s implementation of the reform that allows social capital to participate in the urban infrastructure investment and operations through franchise and other ways, PPP mode (participation from energy conservation service companies, social capital and government) energy conservation service will possibly become dominant in infrastructure and public utilities.
At present, China’s energy conservation service applications are mainly found in industrial sectors (about 70% of the total energy consumption in the country), whose energy conservation service output value makes up more than 70% of the industry-wide output value. In the industrial field, energy conservation services are mainly concentrated in recycling of waste heat / residual pressure, energy-saving of motor system, optimization of energy system, improvement of furnace / boiler, etc. Besides, construction, transportation and other fields also have great energy saving potentials e.g. China’s existing building energy-saving renovation market potential reached RMB4.434 trillion by the end of 2014.
Because of small assets scale and difficult financing, services provided by Chinese energy conservation service companies are mainly single energy conservation types with small amount of investment. However, with the expansion of financing channels and improvement of professional skill, an integrated solution covering energy saving, environmental protection and intellectualization for systems (including heating system, air conditioning and refrigeration system, lighting system, ventilation and air exchange system, water system and other subsystems) will become a trend.
China Energy Conservation Service Industry Report, 2015 mainly covers the following:
 Overview of energy conservation service industry, including definition, business model, EMC comparison between China and the US, PPP mode, etc.; Overview of energy conservation service industry, including definition, business model, EMC comparison between China and the US, PPP mode, etc.;
Operation of energy conservation service industry, including relevant policies, number of enterprises and employees, industry output value, EMC investment, applications, competition pattern, etc.;
Energy conservation service market segments, including status, market size, competition pattern, prospects, etc. of waste heat power generation / motor energy saving / building energy saving;
17 major players, including their profile, operating performance, revenue structure, gross margin, energy conservation services, development strategy, etc.
第一章 节能服务行业概况
1.1 定义及商业模式
1.1.1 定义
1.1.2 商业模式
1.2 合同能源管理(EMC/EPC)
1.2.1 概况
1.2.2 美国EPC
1.2.3 中国EMC
1.2.4 中美对比
1.3 PPP模式
第二章 节能服务市场运行
2.1 相关政策
2.2 市场规模
2.2.1 企业和员工数量
2.2.2 行业产值
2.2.3 EMC投资
2.3 应用领域
2.3.1 市场现状
2.3.2 重点节能领域
2.4竞争格局
第三章 节能服务行业细分市场
3.1余热发电
3.1.1 市场现状
3.1.2 市场规模
3.1.3 竞争格局
3.1.4发展前景
3.2 电机节能
3.2.1 市场概况
3.2.2 市场规模
3.3 建筑节能
3.3.1 市场概况
3.3.2 市场规模
3.3.3 竞争格局
第四章 节能服务行业主要公司
4.1中材节能股份有限公司
4.1.1 公司简介
4.1.2 经营业绩
4.1.3 营收构成
4.1.4 毛利率
4.1.5 节能服务业务
4.1.6 发展战略
4.1.7 发展前景
4.2 南方电网综合能源有限公司
4.2.1 公司简介
4.2.2 商业模式
4.2.3 经营业绩
4.2.4 节能服务业务
4.3 北京仟亿达科技有限公司
4.3.1 公司简介
4.3.2 经营业绩
4.3.3 营收构成
4.3.4 毛利率
4.3.5 前五大客户
4.3.6 节能服务业务
4.4 施耐德电气
4.4.1 公司简介
4.4.2 经营业绩
4.4.3 营收构成
4.4.4 毛利率
4.4.5 节能服务业务
4.4.6 在华业务
4.5 广州智光电气股份有限公司
4.5.1 公司简介
4.5.2 经营业绩
4.5.3 营收构成
4.5.4 毛利率
4.5.5 节能服务业务
4.5.6 发展战略
4.6 双良节能系统股份有限公司
4.6.1 公司简介
4.6.2 经营业绩
4.6.3 营收构成
4.6.4 毛利率
4.6.5 节能服务业务
4.6.6 发展战略
4.7 北京源深节能技术有限责任公司
4.8 浙江科维节能技术股份有限公司
4.8.1 公司简介
4.8.2 经营业绩
4.8.3 营收构成
4.8.4 毛利率
4.8.5 前五大客户
4.8.6 节能服务业务
4.9 深圳市英威腾能源管理有限公司
4.10 北京志能祥赢节能环保科技有限公司
4.10.1 公司简介
4.10.2 经营业绩
4.10.3 营收构成
4.10.4 毛利率
4.10.5 前五大客户
4.10.6 节能服务业务
4.11东方绿源节能环保工程有限公司
4.12 北京动力源科技股份有限公司
4.12.1 公司简介
4.12.2 经营业绩
4.12.3 营收构成
4.12.4 毛利率
4.12.5 节能服务业务
4.12.6 发展战略
4.13 大连易世达新能源发展股份有限公司
4.13.1 公司简介
4.13.2 经营业绩
4.13.3 营收构成
4.13.4 毛利率
4.13.5 主要参股公司
4.13.6 研发
4.13.7 主要案例
4.14浙江盾安人工环境股份有限公司
4.14.1 公司简介
4.14.2 经营业绩
4.14.3 营收构成
4.14.4 毛利率
4.14.5 研发
4.14.6 节能服务业务
4.15 北京思能达节能电气股份有限公司
4.16 烟台龙源电力技术股份有限公司
5.16.1 公司简介
4.16.2 经营业绩
4.16.3 营收构成
4.16.4 毛利率
4.16.5 研发
4.16.6 节能服务业务
4.17 神雾环保技术股份有限公司
4.17.1 公司简介
4.17.2 经营业绩
4.17.3 营收构成
4.17.4 毛利率
4.17.5 节能服务业务
1. Overview of Energy-saving Service Sector
1.1 Definition and Business Model
1.1.1 Definition
1.1.2 Business Model
1.2 EMC/EPC
1.2.1 Overview
1.2.2 EPC in the US
1.2.3 EMC in China
1.2.4 Comparison between China and the US
2. Energy Saving Service Market Operation
2.1 Relevant Policies
2.2 Market Size
2.2.1 Number of Enterprises and Employees
2.2.2 Output Value
2.2.3 EMC Investment
2.3 Applications
2.4 Competition Pattern
3. Energy Saving Service Market Segments
3.1 Waste Heat to Power (WHP)
3.1.1 Market Status
3.1.2 Market Size
3.1.3 Competitive Landscape
3.1.4 Prospects
3.2 Motor Energy Saving
3.2.1 Market Overview
3.2.2 Market Size
3.3 Building Energy Saving
3.3.1 Market Profile
3.3.2 Market Size
3.3.3 Competition Pattern
4. Major Companies
4.1 Sinoma Energy Conservation Ltd.
4.1.1 Profile
4.1.2 Operating Performance
4.1.3 Revenue Structure
4.1.4 Gross Margin
4.1.5 Energy Conservation Services
4.1.6 Development Strategy
4.1.7 Prospects
4.2 China Southern Power Grid Comprehensive Energy Co., Ltd.
4.2.1 Profile
4.2.2 Business Model
4.2.3 Operating Performance
4.2.4 Energy Conservation Services
4.3 Beijing Kingtech Co., Ltd.
4.3.1 Profile
4.3.2 Operating Performance
4.3.3 Revenue Structure
4.3.4 Gross Margin
4.3.5 Top 5 Customers
4.3.6 Energy Conservation Services
4.4 Schneider Electric
4.4.1 Profile
4.4.2 Operating Performance
4.4.3 Revenue Structure
4.4.4 Gross Margin
4.4.5 Energy Conservation Services
4.4.6 Business in China
4.5 Guangzhou Zhiguang Electric Co., Ltd.
4.5.1 Profile
4.5.2 Operating Performance
4.5.3 Revenue Structure
4.5.4 Gross Margin
4.5.5 Energy Conservation Services
4.5.6 Development Strategy
4.6 Shuangliang Eco-Energy Systems Co., Ltd.
4.6.1 Profile
4.6.2 Operating Performance
4.6.3 Revenue Structure
4.6.4 Gross Margin
4.6.5 Energy Conservation Services
4.6.6 Development Strategy
4.7 Beijing Yuanshen Energy Saving Technology Co., Ltd.
4.8 Zhejiang Ecowell Energy Management Technology Co., Ltd.
4.8.1 Profile
4.8.2 Operating Performance
4.8.3 Revenue Structure
4.8.4 Gross Margin
4.8.5 Top 5 Customers
4.8.6 Energy Conservation Services
4.9 INVT Energy Management (Shenzhen) Co., Ltd.
4.10 Beijing ZNXY Energy & Environment Co., Ltd.
4.10.1 Profile
4.10.2 Operating Performance
4.10.3 Revenue Structure
4.10.4 Gross Margin
4.10.5 Top 5 Customers
4.10.6 Energy Conservation Services
4.11 Oriental Green Energy-Saving Environmental Protection Engineering Co., Ltd.
4.12 Beijing Dynamic Power Co., Ltd.
4.12.1 Profile
4.12.2 Operating Performance
4.12.3 Revenue Structure
4.12.4 Gross Margin
4.12.5 Energy Conservation Services
4.12.6 Development Strategy
4.13 East New Energy
4.13.1 Profile
4.13.2 Operating Performance
4.13.3 Revenue Structure
4.13.4 Gross Margin
4.13.5 Major Shareholding Companies
4.13.6 R & D
4.13.7 Major Cases
4.14 Zhejiang Dun'An Artificial Environment Co., Ltd.
4.14.1 Profile
4.14.2 Operating Performance
4.14.3 Revenue Structure
4.14.4 Gross Margin
4.14.5 R&D
4.14.6 Energy Conservation Services
4.15 Beijing SNTA Energy-Efficient Electric Co., Ltd.
4.16 Yantai Longyuan Power Technology Co., Ltd.
4.16.1 Profile
4.16.2 Operating Performance
4.16.3 Revenue Structure
4.16.4 Gross Margin
4.16.5 R&D
4.16.6 Energy Conservation Services
4.17 Shenwu Environmental Technology Co., Ltd
4.17.1 Profile
4.17.2 Operating Performance
4.17.3 Revenue Structure
4.17.4 Gross Margin
4.17.5 Energy Conservation Services
表:节能服务行业主要商业模式
表:合同能源管理的主要类型
表:美国节能服务行业成功创新及作用
表:中国EMC项目融资来源
表:中国和美国EMC对比
表:适合PPP模式的节能项目
表:2006-2015年中国节能服务行业相关政策
表:“十二五”节能减排重点工程的节能能力
图:2007-2018年中国节能服务行业企业数量及同比增长
图:2007-2018年中国节能服务行业员工数量及同比增长
图:2007-2018年中国节能服务行业产值及同比增长
图:2007-2018年中国节能服务行业平均每家企业/员工产值
图:2007-2018年中国EMC项目投资额及同比增长
图:2013年中国EMC项目数量(分技术)
图:2007-2018 年中国EMC项目节能量及同比增长
表:2013-2014年中国节能服务项目市场份额(分应用行业)
表:2013年中国节能服务行业Top30企业(按节能量)
图:中国节能服务行业Top100企业区域分布及服务区域
表:2011-2014年中国节能服务行业Top100企业(按节能量)员工人数/产值/EMC项目投资额
表:2013年中国节能服务行业Top100企业营业额/EMC项目投资额(分资产规模)
表:2013年中国节能服务行业Top100企业营业额/EMC项目投资额(分企业性质)
表:2013年中国节能服务行业Top100企业EMC项目节能量(分模式和行业)
表:2007-2014年中国水泥新建生产线及新增产能
表:2010-2018年中国配置余热发电的水泥生产线条数及投资额
表:2010-2015年中国主要企业余热发电业务收入
表:中国水泥外其他工业余热发电潜在市场规模
表:电机节能的主要途径
表:中国高效电机国家补贴方案
表:2013-2015年中国高效电机推广目标
表:2013-2015年中国高效电机生产目标
图:2013-2018年高效电机销售收入及同比增长
表:电机系统节能技术改造市场容量
表:中国从事电机节能的公司
图:中国建筑能耗构成
表:2010-2018年中国新建节能建筑面积及累计建成节能建筑面积
表:截至2014年底中国既有建筑节能改造市场潜力
图:2013-2018年中国建筑节能行业市场规模及同比增长
表:2010-2015年中国主要厂商建筑节能业务收入
表:2013-2014年中材节能员工人数(分专业和学历)
图:2010-2015年中材节能营业收入及同比增长
图:2010-2015年中材节能净利润及同比增长
图:2010-2015年中材节能营收构成(分业务)
图:2010-2015年中材节能营收构成(分区域)
图:2010-2015年中材节能毛利率(分业务)
表:2008-2014年中材节能新签余热发电项目生产线数量及装机规模(分业务模式)
图:2015-2018年中材节能营业收入及同比增长
表:南方电网综合能源公司主营业务
图:南方电网综合能源公司主要合作伙伴
表:南方电网综合能源公司商业模式
图:2011-2018年南方电网综合能源公司营业收入及同比增长
图:2011-2018年南方电网综合能源公司净利润及同比增长
表:2014-2015年南方电网综合能源公司节能服务业务竣工项目
表:仟亿达主营业务
图:仟亿达网点分布
图:2012-2018年仟亿达营业收入及同比增长
图:2012-2018年仟亿达净利润及同比增长
图:2012-2015年仟亿达营收构成(分业务)
图:2012-2015年仟亿达毛利及毛利率(分业务)
表:2012-2015年仟亿达来自前五大客户的销售额
表:施耐德电气主要业务
图:截至2014年底施耐德电气员工数量(分区域)
图:2010-2015年施耐德电气营业收入及同比增长
图:2010-2015年施耐德电气净利润及同比增长
图:2010-2015年施耐德电气营收构成(分业务)
图:2010-2015年施耐德电气营收构成(分区域)
图:2010-2015年施耐德电气毛利、同比增长及毛利率
表:施耐德电气在华子公司
图:2010-2018年施耐德电气在华收入及同比增长
表:智光电气主营业务
图:2010-2015年智光电气营业收入及同比增长
图:2010-2015年智光电气净利润及同比增长
图:2010-2015年智光电气营收构成(分业务)
图:2010-2015年智光电气营收构成(分区域)
图:2010-2015年智光电气毛利率(分业务)
图:2010-2015年智光电气毛利率(分区域)
图:2010-2015年智光电气主要产品销量
表:2014-2015年智光电气节能服务业务新签项目
图:2015-2018年智光电气营业收入及同比增长
图:2010-2015年双良节能营业收入及同比增长
图:2010-2015年双良节能净利润及同比增长
图:2010-2015年双良节能营收构成(分业务)
图:2010-2015年双良节能营收构成(分区域)
图:2010-2015年双良节能毛利率(分业务)
图:双良节能余热利用业务
表:北京源深节能技术有限责任公司主营业务
图:2011-2018年科维节能营业收入及同比增长
图:2011-2018年科维节能净利润及同比增长
图:2011-2014年科维节能营收构成(分行业)
图:2011-2014年科维节能营收构成(分区域)
图:2011-2014年科维节能毛利率(分行业)
表:2011-2014年科维节能来自前五大客户的销售额
表:科维节能主要节能服务业务
表:2011-2014年科维节能合同能源管理项目数量及节电量
表:2011-2014年科维节能原材料采购金额(分业务)
表:英威腾能源管理公司主营业务
表:英威腾能源管理公司主要成功案例
图:2013-2014年英威腾能源管理公司主要财务指标
表:志能祥赢主营业务
图:2013-2018年志能祥赢营业收入及同比增长
图:2013-2018年志能祥赢净利润及同比增长
图:2013-2015年志能祥赢营收构成(分业务)
图:2013-2015年志能祥赢毛利率(分业务)
表:2013-2015年志能祥赢来自前五大客户的销售额
表:北京志能祥赢节能服务业务
表:2013-2014年志能祥赢已投产合同能源管理项目
图:2013-2014年志能祥合同能源管理项目成本构成
表:2010-2015年动力源营业收入及同比增长
表:2010-2015年动力源净利润及同比增长
表:2010-2015年动力源营收构成(分业务)
表:2010-2015年动力源营收构成(分区域)
表:2010-2015年动力源毛利率(分业务)
表:2015年动力源涉及节能服务业务主要子公司
表:2010-2015年易世达营业收入及同比增长
表:2010-2015年易世达净利润及同比增长
表:2010-2015年易世达营收构成(分业务)
表:2010-2015年易世达毛利率(分业务)
表:2015年上半年易世达主要参股公司及净利润
表:2010-2015年盾安环境营业收入及同比增长
表:2010-2015年盾安环境净利润及同比增长
表:2010-2015年盾安环境营收构成(分业务)
表:2010-2015年盾安环境营收构成(分区域)
表:2010-2015年盾安环境分业务毛利率
表:2010-2015年盾安环境研发费用及营收占比
表:2014年-2015年盾安环境主要项目
表:2010-2015年龙源技术营业收入及同比增长
表:2010-2015年龙源技术净利润及同比增长
表:2010-2015年龙源技术营收构成(分业务)
表:2010-2014年龙源技术营收构成(分区域)
表:2010-2015年龙源技术毛利率(分业务)
表:2010-2015年龙源技术研发费用及营收占比
表:2013-2014年公司节能环保产品产量及销量
表:2015年上半年龙源技术节能环保工程类订单新增及执行情况
表:2010-2015年神雾环保营业收入及同比增长
表:2010-2015年神雾环保净利润及同比增长
表:2010-2015年神雾环保营收构成(分业务)
表:2010-2015年神雾环保毛利率(分业务)
Number of Enterprises and YoY Growth in China Energy Conservation Service Industry, 2007-2018E
Number of Employees and YoY Growth in China Energy Conservation Service Industry, 2007-2018E
Output Value and YoY Growth in China Energy Conservation Service Industry, 2007-2018E
Average Output Value of Each Enterprise/Employee in China Energy Conservation Service Industry, 2007-2018E
Investment and YoY Growth of Chinese EMC Projects, 2007-2018E
Number of Chinese EMC Projects (by Technology), 2013
Energy Saving Capacity and YoY Growth of Chinese EMC Projects, 2007-2018E
High-efficiency Electrical Machine Sales and YoY Growth, 2013-2018E
China’s Building Energy Consumption Structure
Market Size and YoY Growth of China Building Energy Saving Industry, 2013-2018E
Revenue and YoY Growth of Sinoma Energy Conservation, 2010-2015
Net Income and YoY Growth of Sinoma Energy Conservation, 2010-2015
Revenue Structure of Sinoma Energy Conservation (by Business), 2010-2015
Revenue Structure of Sinoma Energy Conservation (by Region), 2010-2015
Gross Margin of Sinoma Energy Conservation (by Business), 2010-2015
Revenue and YoY Growth of Sinoma Energy Conservation, 2015-2018E
Major Co-partners of China Southern Power Grid Comprehensive Energy
Revenue and YoY Growth of China Southern Power Grid Comprehensive Energy, 2011-2018E
Net Income and YoY Growth of China Southern Power Grid Comprehensive Energy, 2011-2018E
Outlets of Kingtech
Revenue and YoY Growth of Kingtech, 2012-2018E
Net Income and YoY Growth of Kingtech, 2012-2018E
Revenue Structure of Kingtech by Business, 2012-2015
Gross Profit and Gross Margin of Kingtech by Business, 2012-2015
Employee of Schneider Electric by Region by the end of 2014
Revenue and YoY Growth of Schneider Electric, 2010-2015
Net Income and YoY Growth of Schneider Electric, 2010-2015
Revenue Structure of Schneider Electric by Business, 2010-2015
Revenue Structure of Schneider Electric by Region, 2010-2015
Gross Profit, YoY Growth and Gross Margin of Schneider Electric, 2010-2015
Schneider Electric’s Subsidiaries in China
Schneider Electric’s Revenue from China and YoY Growth, 2010-2018E
Revenue and YoY Growth of Guangzhou Zhiguang Electric, 2010-2015
Net Income and YoY Growth of Guangzhou Zhiguang Electric, 2010-2015
Revenue Structure of Guangzhou Zhiguang Electric by Business, 2010-2015
Revenue Structure of Guangzhou Zhiguang Electric by Region, 2010-2015
Gross Margin of Guangzhou Zhiguang Electric by Business, 2010-2015
Gross Margin of Guangzhou Zhiguang Electric by Region, 2010-2015
Sales Volume of Guangzhou Zhiguang Electric’s Main Products, 2010-2015
Revenue and YoY Growth of Guangzhou Zhiguang Electric, 2015-2018
Revenue and YoY Growth of Shuangliang Eco-Energy, 2010-2015
Net Income and YoY Growth of Shuangliang Eco-Energy, 2010-2015
Revenue Structure of Shuangliang Eco-Energy by Business, 2010-2015
Revenue Structure of Shuangliang Eco-Energy by Region, 2010-2015
Gross Margin of Shuangliang Eco-Energy by Business, 2010-2015
Revenue and YoY Growth of Zhejiang Ecowell, 2011-2018
Net Income and YoY Growth of Zhejiang Ecowell, 2011-2018E
Revenue Structure of Zhejiang Ecowell by Sector, 2011-2014
Revenue Structure of Zhejiang Ecowell by Region, 2011-2014
Gross Margin of Zhejiang Ecowell by Sector, 2011-2014
Main Financial Indicators of INVT Energy Management (Shenzhen), 2013-2014
Revenue and YoY Growth of Beijing ZNXY Energy & Environment, 2013-2018E
Net Income and YoY Growth of Beijing ZNXY Energy & Environment, 2013-2018E
Revenue Breakdown of Beijing ZNXY Energy & Environment (by Business), 2013-2015
Gross Margin of Beijing ZNXY Energy & Environment (by Business), 2013-2015
Cost Structure of EMC Projects of Beijing ZNXY Energy & Environment, 2013-2014
China’s Fixed-Asset Investment and YoY Growth, 2013-2015
China’s Import/Export Scale and YoY Growth, 2013-2015
China’s Total Retail Sales of Consumer Goods and YoY Growth, 2013-2015
Main Business Models of Energy-saving Service Sector
US Innovation in Energy-saving Service Sector and Effect
Funding Sources of EMC Projects in China
EMC Comparison between China and the US
Policies on China Energy Saving Service Industry, 2006-2015
Energy-Saving Capacity of Key Energy Saving & Emission Reduction Projects during the 12th Five-Year Plan Period
Average EMC Contract Size in Each Sector and Sectoral Share in Total, 2010-2011
Market Share of Chinese Energy Conservation Service Projects (by Application), 2013-2014
Top 30 Enterprises in China Energy Conservation Service Industry (by Energy Saving Capacity), 2013
Number of Employees/Output Value/EMC Project Investment of Top 100 Enterprises in China Energy Conservation Service Industry (by Energy Saving Capacity), 2011-2014
Revenue / EMC Project Investment of Top 100 Enterprises in China Energy Conservation Service Industry (by Assets), 2013
Revenue / EMC Project Investment of Top 100 Enterprises in China Energy Conservation Service Industry (by Corporate Nature), 2013
EMC Project Energy Saving Capacity of Top 100 Enterprises in China Energy Conservation Service Industry (by Model and Industry), 2013
New Cement Production Lines and Added Capacity in China, 2007-2014
Number and Investment in China of Cement Production Lines Equipped with WHP Facilities, 2010-2018E
WHP Revenue of Major Enterprises in China, 2010-2015
China’s Potential Market Size of Industrial WHP Excluding Cement
Main Paths for Electrical Machine Energy Saving
High-efficiency Electrical Machine Promotion Targets in China, 2013-2015
High-efficiency Electrical Machine Production Targets in China, 2013-2015
Market Capacity of Electrical Machine System Energy-saving Technical Retrofit
Domestic Companies Engaged in Motor Energy Saving
Revenue of Motor Energy Saving Business
China’s Newly-built Energy Saving Building Area and Cumulative Built-up Energy Saving Building Area, 2010-2018E
China’s Existing Building Energy-Saving Renovation Market Potential as of End-2014
Building Energy Saving Revenue of Major Manufacturers in China, 2010-2015
Number of Employees of Sinoma Energy Conservation (by Professional and Educational Background), 2013-2014
Number of Production Lines and Installed Capacity of New Cogeneration Projects (by Business Model) of Sinoma Energy Conservation, 2008-2014
Business Model of China Southern Power Grid Comprehensive Energy
Completed Energy Conservation Service Projects of China Southern Power Grid Comprehensive Energy, 2014-2015
Kingtech’s Revenue from Top5 Customers, 2014-2015
Main Business of Schneider Electric
Schneider Electric (China) Co Ltd. is Schneider Electric’s subsidiary that engages in energy saving service business in China.
Newly-signed Energy Saving Service Projects of Guangzhou Zhiguang Electric, 2014-2015
Main Business of Beijing Yuanshen Energy Saving Technology
Revenue from Zhejiang Ecowell’s Top 5 Customers, 2013-2014
Zhejiang Ecowell’s Major Energy-saving Services
Zhejiang Ecowell’s Energy Performance Contracting Projects and Electricity Saving Amount, 2011-2014
Raw Material Procurement of Zhejiang Ecowell by Product, 2011-2014
Main Business of INVT Energy Management (Shenzhen)
Main Successful Cases of INVT Energy Management (Shenzhen)
Beijing ZNXY Energy & Environment’s Sales from Top 5 Customers, 2014-2015
Energy Saving Service Business of Beijing ZNXY Energy & Environment
In-Production EMC Projects of Beijing ZNXY Energy & Environment, 2013-2014
Energy Savings of Oriental Green Energy-Saving Environmental Protection Engineering, 2013-2014
Revenue and YoY Growth of Beijing Dynamic Power, 2010-2015
Net Income and YoY Growth of Beijing Dynamic Power, 2010-2015
Revenue of Beijing Dynamic Power by Product, 2010-2015
Revenue of Beijing Dynamic Power by Region, 2010-2015
Consolidated Gross Margin of Beijing Dynamic Power, 2010-2015
Gross Margin of Beijing Dynamic Power by Product, 2010-2015
Major Energy Conservation Service Subsidiaries of Beijing Dynamic Power, 2015
Revenue and YoY Growth of East New Energy, 2010-2015
Net Income and YoY Growth of East New Energy, 2010-2015
Revenue of East New Energy by Product, 2010-2015
Consolidated Gross Margin of East New Energy, 2010-2015
Gross Margin of East New Energy by Product, 2010-2015
Major Shareholding Companies and Net Income of East New Energy, H1 2015
Revenue and YoY Growth of Zhejiang Dun'An Artificial Environment, 2010-2015
Net Income and YoY Growth of Zhejiang Dun'An Artificial Environment, 2010-2015
Revenue Breakdown of Zhejiang Dun'An Artificial Environment by Product, 2010-2015
Revenue Breakdown of Zhejiang Dun'An Artificial Environment by Region, 2010-2015
Consolidated Gross Margin of Zhejiang Dun'An Artificial Environment, 2010-2015
Gross Margin of Zhejiang Dun'An Artificial Environment by Product, 2010-2015
R&D Costs and % of Total Revenue of Zhejiang Dun'An Artificial Environment, 2010-2015
Main Projects of Zhejiang Dun'An Artificial Environment, 2014-2015
Revenue and YoY Growth of Yantai Longyuan Power Technology, 2010-2015
Net Income YoY Growth of Yantai Longyuan Power Technology, 2010-2015
Revenue Breakdown of Yantai Longyuan Power Technology by Product, 2010-2015
Revenue Breakdown of Yantai Longyuan Power Technology by Region, 2010-2014
Consolidated Gross Margin of Yantai Longyuan Power Technology, 2010-2015
Gross Margin of Yantai Longyuan Power Technology by Product, 2010-2015
R&D Costs and % of Total Revenue of Yantai Longyuan Power Technology, 2010-2015
Output and Sales Volume of Energy-efficient and Environment-friendly Products, 2013-2014
New Order and Execution of Energy Saving and Environmental Protection Projects of Yantai Longyuan Power Technology, 2015H1
Revenue and YoY Growth of Shenwu Environmental Technology, 2010-2015
Net Income and YoY Growth of Shenwu Environmental Technology, 2010-2015
Revenue Breakdown of Shenwu Environmental Technology by Product, 2010-2015
Consolidated Gross Margin of Shenwu Environmental Technology, 2010-2015
Gross Margin of Shenwu Environmental Technology by Product, 2010-2015
如果这份报告不能满足您的要求,我们还可以为您定制报告,请 留言说明您的详细需求。
|