|
|
|
报告导航:研究报告—
制造业—工业机械
|
|
2015-2018年全球及中国轴承行业研究报告 |
 |
字数:4.2万 |
页数:143 |
图表数:171 |
|
中文电子版:9000元 |
中文纸版:4500元 |
中文(电子+纸)版:9500元 |
|
英文电子版:2550美元 |
英文纸版:2750美元 |
英文(电子+纸)版:2850美元 |
|
编号:ZHP028
|
发布日期:2015-09 |
附件:下载 |
 |
|
|
轴承是当代机械设备中的一种关键零部件,广泛应用于汽车、机电、工程机械、家用电器、冶金矿山机械等领域。
2014年,全球轴承市场规模达680亿美元,其中亚洲占45%,欧洲占28%,美洲占25%。亚洲轴承市场又主要集中在日本、印度和中国。
中国作为全球轴承主要生产国之一,2014年轴承产量为202亿套,同比增长3.1%。其中滚动轴承最多,占比为92.6%。预计2015年中国轴承产量可以达到215亿套。
目前,汽车是轴承最大的应用市场。2014年中国汽车轴承需求量12亿套,预计2015年将增长至13亿套。除汽车之外,中国铁路建设的提速也拉动了铁路轴承需求量的增长,2014年铁路轴承需求量约为561万套,预计2015年将增长至587万套。
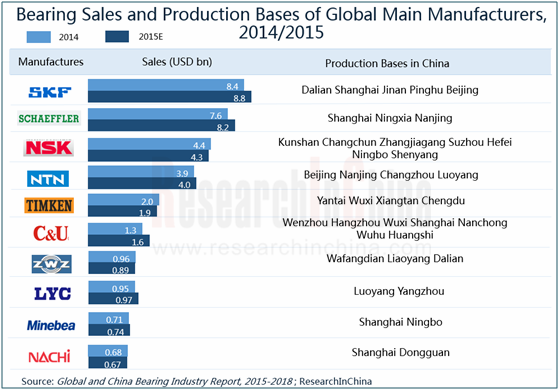
2014年,全球前十大制造商中包括2家欧洲企业(瑞典SKF、德国Schaeffler),1家美国企业(TIMKEN)、4家日本企业(日本精工、NTN、美蓓亚、Nachi)以及3家中国企业(人本集团、瓦轴、洛轴)。目前,SKF、NSK、NTN等国外主要轴承生产商已经全部进入中国。
SKF:全球最大的轴承制造商,2014年全球市场占有率12.4%,在中国设有5个轴承生产基地(分布在上海、北京、大连、济南、平湖等地)。2014年12月,与沈阳鼓风机集团(SBW)签订了S2M磁浮轴承供货合同;2015年1月,获得重庆齿轮箱有限责任公司价值1.5亿克朗的轴承供应订单,提高了在中国风电齿轮箱市场的占有率。
Schaeffler:2014年,大中华区营业收入约15.4亿欧元,占公司营收总额的12.7%。2015年,南京生产基地的卡车轮毂轴承生产线正按计划建设,预计年底投产,届时产能可达50万套/年。
人本集团:轴承产能8.1亿套/年,2014年市场占有率首次超过瓦轴,成为中国第一。2014年12月,投资5亿元在芜湖生产基地建设的“年产6,000万套高效精密工业轴承项目”正式投产。
瓦轴:中国风电轴承主要制造商,近年一直在加大高端风电轴承的研发。2015年6月,公司研发的FL-249/750CA/W33风电主轴轴承获得了GL-A认证证书(此乃国内第一例),由此获得了欧盟市场的准入资格。
轴研科技:2014年5月,投资1.6亿元建设“高速精密重载轴承产业化示范线项目”,产品主要以高速铁路用轴承、城市轨道车辆轴承、机车及传动轴承为主。项目已于2015年6月完成投产,新增圆锥滚子轴承产能6万套/年。
水清木华研究中心《2015-2018年全球及中国轴承行业研究报告》着重研究了以下内容:
 全球轴承市场规模、市场结构、竞争格局等情况; 全球轴承市场规模、市场结构、竞争格局等情况;
中国轴承行业发展环境;
中国轴承生产、销售、市场结构、竞争格局、进出口等情况;
轴承主要下游行业需求、竞争格局等情况;
全球8家、中国10家轴承厂商经营情况、发展战略、研发能力等。
Bearing, a critical component for contemporary mechanical equipment, finds wide applications in automobile, electromechanics, construction machinery, household appliances, metallurgy and mining machinery, etc.
In 2014, global bearing market size reached USD68 billion, with Asia accounting for 45%, Europe 28% and the Americas 25%. In particular, the Asian bearing market is mainly concentrated in Japan, India and China.
As one of major bearing producers in the world, China produced 20.2 billion sets of bearings in 2014, rising by 3.1% from a year earlier, of which rolling bearing held the lion’s share (92.6%). China’s bearing output is expected to arrive at 21.5 billion sets in 2015.
Currently, automobile is the largest application market for bearing in China. The country’s demand for automotive bearing was 1.2 billion sets in 2014, and is expected to grow to 1.3 billion sets in 2015. Besides the demand from automobile, accelerated railway construction in China also stimulates the demand for railway bearing, which approximated 5.61 million sets in 2014 and is predicted to reach 5.87 million sets in 2015.
In 2014, global top10 manufacturers included two European companies (Swedish SKF, German Schaeffler), one American firm (TIMKEN), four Japanese players (NSK, NTN, Minebea, Nachi), and three Chinese ones (C&U Group, Wafangdian Bearing Group, Luoyang LYC Bearing). Major foreign bearing producers including SKF, NSK, and NTN now have entered China.
SKF: The company is the world's largest bearing manufacturer; it seized a 12.4% global market share in 2014; it has five bearing production bases in China (separately located in Shanghai, Beijing, Dalian, Jinan, and Pinghu). The company signed S2M magnetic bearings supply contract with Shenyang Blower Works Group (SBW) in Dec 2014, and won SEK150 million worth of bearing supply order from Chongqing Gearbox Co., Ltd. in Jan 2015, thus boosting its share in the Chinese wind power gearbox market.
Schaeffler: The company made revenue of EUR1.54 billion, or 12.7% of total revenue, from the Greater China region in 2014. The truck hub bearing production lines in Nanjing production base are under construction as planned in 2015, and is expected to go into production at the end of the year, delivering a capacity of 500,000 sets/a.
C&U Group: The company, with capacity of 810 million sets/a, surpassed Wafangdian Bearing Group for the first time as China’s the largest bearing manufacturer in terms of market share in 2014. “60 million sets/a high-efficiency and precision industrial bearing project” with an investment of RMB500 million in Wuhu production base officially went into operation in December 2014.
Wafangdian Bearing Group: The company is a major wind power bearing manufacturer, and has been intensifying its efforts in R&D of high-end wind power bearing in recent years. FL-249/750CA/W33 wind power spindle bearing developed by the company got GL-A certificate (the first in China) in Jun 2015, thus wining the access to the EU market.
Luoyang Bearing Science & Technology: The company invested RMB160 million to construct “high-speed precision heavy-duty bearing industrialization demonstration line project” in May 2014. Products are mainly high-speed railway bearings, urban rail vehicle bearings, and locomotive and transmission bearings. The project was completed and went into production in Jun 2015, adding capacity of 60,000 sets/a tapered roller bearings.
Global and China Bearing Industry Report, 2015-2018 by ResearchInChina highlights the followings:
 Global bearing market size, structure, competitive landscape, etc; Global bearing market size, structure, competitive landscape, etc;
Development environments for bearing industry in China;
Bearing production, sales, market structure, competitive landscape, import & export, etc. in China;
Demand from main downstream sectors of bearing, competitive landscape, etc.;
Operation, development strategy, R&D capacity, etc. of 8 global and 10 Chinese bearing manufacturers.
第一章 轴承简介
1.1 定义
1.2 分类
1.3 行业特点
1.3.1 周期性
1.3.2 区域性
1.4 存在的问题
1.5 产业链
第二章 全球轴承行业发展现状
2.1 市场规模
2.2 市场结构
2.3 竞争格局
第三章 中国轴承行业分析
3.1 政策环境
3.1.1 重点产品支持政策
3.1.2 贸易政策
3.1.3 外商准入政策
3.2 行业现状
3.3 市场规模
3.4 进出口
3.4.1 进口
3.4.2 出口
3.5 竞争格局
3.5.1 行业集中度
3.5.2 企业格局
3.5.3 区域格局
第四章 轴承细分市场分析
4.1 汽车轴承
4.1.1 简介
4.1.2 市场需求
4.1.3 企业竞争格局
4.1.4 发展动态
4.2 铁路轴承
4.2.1 简介
4.2.2 市场需求
4.2.3 企业竞争格局
4.2.4 发展动态
4.3 风电轴承
4.3.1 简介
4.3.2 市场供需现状
4.3.3 企业竞争格局
4.3.4 发展动态
4.4 工程机械轴承
4.4.1 简介
4.4.2 市场需求
4.4.3 发展动态
4.5 冶金矿山机械轴承
4.5.1 简介
4.5.2 市场需求
4.5.3 企业竞争格局
4.6 其他轴承市场
4.6.1 石油化工轴承
4.6.2 机床轴承
4.6.3 家电轴承
第五章 国外主要轴承生产商
5.1 斯凯孚集团(SKF)
5.1.1 企业简介
5.1.2 经营情况
5.1.3 营收结构
5.1.4 轴承业务
5.1.5 在华发展
5.2 日本精工株式会社(NSK)
5.2.1 企业简介
5.2.2 经营情况
5.2.3 营收结构
5.2.4 轴承业务
5.2.5 营销网络
5.2.6 在华发展
5.3 恩梯恩株式会社(NTN)
5.3.1 企业简介
5.3.2 经营情况
5.3.3 营收结构
5.3.4 轴承业务
5.3.5 在华发展
5.4 美蓓亚集团(Minebea)
5.4.1 企业简介
5.4.2 经营情况
5.4.3 营收结构
5.4.4 轴承业务
5.4.5 在华发展
5.5 铁姆肯公司(TIMKEN)
5.5.1 企业简介
5.5.2 经营情况
5.5.3 营收结构
5.5.4 轴承业务
5.5.5 在华发展
5.6 舍弗勒集团(Schaeffler)
5.6.1 企业简介
5.6.2 经营情况
5.6.3 营收结构
5.6.4 轴承业务
5.6.5 在华发展
5.7 株式会社不二越(Nachi)
5.7.1 企业简介
5.7.2 经营情况
5.7.3 营收结构
5.7.4 轴承业务
5.7.5 在华发展
5.8 株式会社捷太格特(Jtekt)
5.8.1 企业简介
5.8.2 经营情况
5.8.3 营收结构
5.8.4 轴承业务
5.8.5 在华发展
第六章 中国主要轴承生产商
6.1 瓦房店轴承集团有限责任公司
6.1.1 企业简介
6.1.2 经营情况
6.1.3 营收结构
6.1.4 产品研发
6.1.5 营销网络
6.1.6 主要子公司——瓦房店轴承股份有限公司
6.1.7 发展战略
6.2 洛阳LYC轴承有限公司
6.2.1 企业简介
6.2.2 经营情况
6.2.3 营销网络
6.2.4 发展动态
6.3 哈尔滨轴承制造有限公司
6.3.1 企业简介
6.3.2 经营情况
6.3.3 发展战略
6.4 天马轴承集团股份有限公司
6.4.1 企业简介
6.4.2 经营情况
6.4.3 营收结构
6.4.4 毛利率
6.4.5 轴承业务
6.4.6 竞争优势
6.5 襄阳汽车轴承股份有限公司
6.5.1 企业简介
6.5.2 主要客户及供应商
6.5.3 经营情况
6.5.4 营收结构
6.5.5 毛利率
6.5.6 轴承业务
6.5.7 营销网络
6.6 福建龙溪轴承(集团)股份有限公司
6.6.1 企业简介
6.6.2 经营情况
6.6.3 营收结构
6.6.4 毛利率
6.6.5 轴承业务
6.6.6 竞争优势
6.6.7 发展动态
6.7 洛阳轴研科技股份有限公司
6.7.1 企业简介
6.7.2 经营情况
6.7.3 营收结构
6.7.4 毛利率
6.7.5 轴承业务
6.7.6 竞争优势
6.7.7 发展动态
6.8 宝塔实业股份有限公司
6.8.1 企业简介
6.8.2 主要客户及供应商
6.8.3 经营情况
6.8.4 营收结构
6.8.5 毛利率
6.8.6 轴承业务
6.8.7 研发情况
6.8.8 发展动态
6.9 人本集团
6.9.1 企业简介
6.9.2 经营情况
6.9.3 轴承业务
6.9.4 发展动态
6.10 万向钱潮股份有限公司
6.10.1 企业简介
6.10.2 主要客户及供应商
6.10.3 经营情况
6.10.4 营收结构
6.10.5 毛利率
6.10.6 轴承业务
6.10.7 发展战略
第七章 总结与预测
7.1 市场
7.2 企业
1 Introduction to Bearing
1.1 Definition
1.2 Classification
1.3 Industry Characteristics
1.3.1 Periodicity
1.3.2 Regionality
1.4 Existing Problems
1.5 Industry Chain
2 Development of Global Bearing Industry
2.1 Market Size
2.2 Market Structure
2.3 Competitive Landscape
3 Bearing Industry in China
3.1 Policy Environment
3.1.1 Supportive Policies for Key Products
3.1.2 Trade Policy
3.1.3 Foreign Access Policies
3.2 Status Quo
3.3 Market Size
3.4 Import & Export
3.4.1 Import
3.4.2 Export
3.5 Competitive Landscape
3.5.1 Industry Concentration
3.5.2 Enterprise Pattern
3.5.3 Regional Structure
4 Bearing Market Segments
4.1 Automotive Bearing
4.1.1 Overview
4.1.2 Market Demand
4.1.3 Competition among Enterprises
4.1.4 Developments
4.2 Railway Bearing
4.2.1 Overview
4.2.2 Market Demand
4.2.3 Competition among Enterprises
4.2.4 Developments
4.3 Wind Power Bearing
4.3.1 Overview
4.3.2 Market Demand
4.3.3 Competition among Enterprises
4.3.4 Developments
4.4 Construction Machinery Bearing
4.4.1 Overview
4.4.2 Market Demand
4.4.3 Developments
4.5 Metallurgical and Mining Machinery Bearing
4.5.1 Overview
4.5.2 Market Demand
4.5.3 Competition among Enterprises
4.6 Other Bearing Markets
4.6.1 Petrochemical Bearing
4.6.2 Machine Tool Bearing
4.6.3 Home Appliance Bearing
5 Major Foreign Bearing Manufacturers
5.1 SKF
5.1.1 Profile
5.1.2 Operation
5.1.3 Revenue Structure
5.1.4 Bearing Business
5.1.5 Development in China
5.2 NSK
5.2.1 Profile
5.2.2 Operation
5.2.3 Revenue Structure
5.2.4 Bearing Business
5.2.5 Marketing Network
5.2.6 Development in China
5.3 NTN
5.3.1 Profile
5.3.2 Operation
5.3.3 Revenue Structure
5.3.4 Bearing Business
5.3.5 Development in China
5.4 Minebea
5.4.1 Profile
5.4.2 Operation
5.4.3 Revenue Structure
5.4.4 Bearing Business
5.4.5 Development in China
5.5 TIMKEN
5.5.1 Profile
5.5.2 Operation
5.5.3 Revenue Structure
5.5.4 Bearing Business
5.5.5 Development in China
5.6 Schaeffler
5.6.1 Profile
5.6.2 Operation
5.6.3 Revenue Structure
5.6.4 Bearing Business
5.6.5 Development in China
5.7 Nachi
5.7.1 Profile
5.7.2 Operation
5.7.3 Revenue Structure
5.7.4 Bearing Business
5.7.5 Development in China
5.8 Jtekt
5.8.1 Profile
5.8.2 Operation
5.8.3 Revenue Structure
5.8.4 Bearing Business
5.8.5 Development in China
6 Major Chinese Bearing Manufacturers
6.1 Wafangdian Bearing Group Corp
6.1.1 Profile
6.1.2 Operation
6.1.3 Revenue Structure
6.1.4 Product R&D
6.1.5 Marketing Network
6.1.6 Major Subsidiary- Wafangdian Bearing Co., Ltd.
6.1.7 Development Strategy
6.2 Luoyang LYC Bearing Co., Ltd
6.2.1 Profile
6.2.2 Operation
6.2.3 Marketing Network
6.2.4 Developments
6.3 Harbin Bearing Manufacturing Co., Ltd
6.3.1 Profile
6.3.2 Operation
6.3.3 Development Strategy
6.4 Tianma Bearing Group Co., Ltd
6.4.1 Profile
6.4.2 Operation
6.4.3 Revenue Structure
6.4.4 Gross Margin
6.4.5 Bearing Business
6.4.6 Competitive Edge
6.5 Xiangyang Automobile Bearing Co., Ltd
6.5.1 Profile
6.5.2 Major Customers and Suppliers
6.5.3 Operation
6.5.4 Revenue Structure
6.5.5 Gross Margin
6.5.6 Bearing Business
6.5.7 Marketing Network
6.6 Fujian Longxi Bearing (Group) Corp., Ltd
6.6.1 Profile
6.6.2 Operation
6.6.3 Revenue Structure
6.6.4 Gross Margin
6.6.5 Bearing Business
6.6.6 Competitive Edge
6.6.7 Developments
6.7 Luoyang Bearing Science & Technology Co., Ltd.
6.7.1 Profile
6.7.2 Operation
6.7.3 Revenue Structure
6.7.4 Gross Margin
6.7.5 Bearing Business
6.7.6 Competitive Edge
6.7.7 Developments
6.8 Baota Industry Co., Ltd.
6.8.1 Profile
6.8.2 Major Customers and Suppliers
6.8.3 Operation
6.8.4 Revenue Structure
6.8.5 Gross Margin
6.8.6 Bearing Business
6.8.7 R&D
6.8.8 Developments
6.9 C&U Group
6.9.1 Profile
6.9.2 Operation
6.9.3 Bearing Business
6.9.4 Developments
6.10 Wanxiang Qianchao Co., Ltd.
6.10.1 Profile
6.10.2 Major Customers and Suppliers
6.10.3 Operation
6.10.4 Revenue Structure
6.10.5 Gross Margin
6.10.6 Bearing Business
6.10.7 Development Strategy
7 Summary and Forecast
7.1 Market
7.2 Enterprise
表:轴承的分类
图:主要轴承示意图
图:2008-2018年全球轴承销售收入
图:2014年全球轴承(分地区)销售收入构成
表:2014年/财年全球前十大轴承生产商
表:“十二五”期间中国重点发展的轴承产品
表:中国部分轴承进口优惠税率
图:2005-2015年中国轴承制造企业数量
图:2014年中国轴承行业企业类型
图:2011-2018年中国轴承行业主营业务收入及利润总额
图:2012-2015年中国轴承行业景气指数
图:2007-2018年中国轴承产量
图:2007-2018年中国滚动轴承产量及增长率
图:2007-2018年中国轴承表观消费量
表:2011-2015年中国轴承进口量和进口额
图:2014年中国轴承(分国家/地区)进口量构成
图:2014年中国轴承(分国家/地区)进口额构成
表:2008-2015年中国轴承出口量和出口额
图:2014年中国轴承(分国家/地区)出口量构成
图:2014年中国轴承(分国家/地区)出口额构成
图:2014年中国与德、美、日轴承行业集中度对比
表:2014年中国轴承收入前5家内资企业
图:2014-2015年中国轴承(分省市)产量构成
图:轿车(分类别)轴承结构
图:2008-2018年中国汽车产销量
图:2013-2018年中国汽车轴承需求量
表:全球汽车轴承主要生产商
表:2011-2015年中国铁路营业里程及投资
图:2013-2018年中国铁路轴承需求量
图:2008-2018年中国风电装机容量
表:2009-2018年中国风电轴承需求量预测
表:中国风电轴承主要生产商
表:2006-2015年工程机械销量及相应轴承需求量
表:2014年中国冶金矿山设备轴承需求量
图:2009-2014年年SKF员工人数
图:2009-2015年SKF销售额和净利润
图:2012-2015年SKF(分业务)营业收入构成
图:2013-2014年SKF(分地区)营业收入构成
图:2013-2014年SKF轴承产品主要应用领域及份额
图:2003&2008&2014年SKF轴承业务收入
表:2001-2014年SKF在华轴承业务开展情况
图:2009-2014财年NSK员工人数
图:2008-2014财年NSK销售额和净利润
图:2011-2014财年NSK(分业务)营业收入构成
图:2008-2014财年NSK(分地区)营业收入构成
图:2010-2014财年NSK轴承业务收入
图:2010-2014财年NSK(分业务)轴承销售收入构成
图:2014财年NSK工业机械轴承销售收入构成
图:2014年NSK全球营销网络
表:NSK在华轴承制造基地
图:2006-2015财年NSK中国销售额及增速
图:2014财年NSK中国(分业务)销售额构成
图:2009-2015财年NTN员工人数
图:2009-2015财年NTN销售额和净利润
图:2012-2015财年NTN(分业务)营业收入构成
图:2009-2015财年NTN(分地区)营业收入构成
表:NTN轴承产品及应用领域
图:2008-2015财年NTN轴承业务收入
表:NTN在华发展历程
图:2015年NTN在华主要生产基地及销售网点
图:2009-2015财年Minebea员工人数
图:2009-2015财年Minebea销售额和净利润
图:2013-2015财年Minebea(分业务)营业收入构成
图:2012-2015财年Minebea(分地区)营业收入结构
表:2014年Minebea主要轴承产品及全球市场份额
图:2011-2016财年Minebea轴承业务收入
图:2015年Minebea在华生产基地分布
图:2011-2015财年Minebea中国地区销售收入及增速
图:2009-2014年TIMKEN员工人数
图:2009-2015年TIMKEN销售额和净利润
图:2012-2015年TIMKEN(分业务)营业收入构成
图:2009-2014年TIMKEN(分地区)营业收入构成
表:TIMKEN主要轴承产品
图:2003&2008&2014年TIMKEN轴承业务收入
图:TIMKEN在华布局
表:TIMKEN在华工厂及核心产品
表:2009-2015年TIMKEN在华动态
图:2009-2015年Schaeffler员工人数
图:2009-2015年Schaeffler销售额和净利润
图:2011-2015年Schaeffler(分业务)营业收入
图:2009-2015年Schaeffler(分地区)营业收入构成
表:Schaeffler主要轴承产品
表:2003&2008&2014年Schaeffler轴承业务收入
表:Schaeffler在华发展历程
图:2009-2014财年NACHI员工人数
图:NACHI海外生产基地
图:2006-2015财年NACHI销售额和净利润
图:2013-2015财年NACHI(分产品)营业收入构成
图:2009-2015财年NACHI(分地区)营业收入构成
图:2006-2015财年NACHI轴承业务收入及增长率
表:NACHI在中国发展历程
图:2009-2014财年Jtekt员工人数
图:2009-2014财年Jtekt销售额和净利润
图:2013-2014财年Jtekt(分产品)营业收入结构
图:2009-2014财年Jtekt(分地区)营业收入结构
图:2010-2014财年Jtekt轴承业务收入
表:Jtekt中国区轴承生产基地
图:2004-2015年瓦轴集团主营业务收入和利润总额
图:2013-2015年瓦轴集团(分产品)轴承收入构成
图:瓦轴集团全球营销网络
图:2009-2015年瓦房店轴承股份有限公司营业收入及净利润
图:2010-2015年瓦房店轴承股份有限公司轴承业务收入及毛利率
图:2012-2014年瓦房店轴承股份有限公司轴承产销量
图:2005-2015年LYC主营业务收入和利润总额
表:LYC优势产品群
图:2004-2015年哈轴集团主营业务收入和利润总额
图:2015年天马股份股权结构
图:2009-2014年天马股份员工人数
图:2007-2015年天马股份营业收入和净利润
图:2012-2015年天马股份(分产品)营业收入构成
图:2012-2014年天马股份(分地区)营业收入构成
图:2010-2015年天马股份(分产品)毛利率
图:2007-2015年天马股份轴承营业收入及增速
表:2014年天马股份主要轴承子公司营业收入
图:2015年襄阳轴承股权结构
图:2008-2014年襄阳轴承员工人数
表:2013-2014年襄阳轴承主要客户销售额及占比
表:2013-2014年襄阳轴承主要供应商采购额及占比
图:2007-2015年襄阳轴承营业收入和净利润
图:2011-2014年襄阳轴承主要产品产销量
图:2012-2015年襄阳轴承(分产品)营业收入构成
图:2012-2015年襄阳轴承(分地区)营业收入构成
图:2008-2015年襄阳轴承(分产品)毛利率
图:2008-2015年轴承业务收入及增速
图:襄阳轴承全球营销网络
图:2015年龙溪轴承股权结构
图:2009-2014年龙溪股份员工人数
图:2006-2015年龙溪股份营业收入和净利润
图:2012-2015年龙溪股份(分产品)营业收入构成
图:2009-2015年龙溪股份(分地区)营业收入构成
图:2009-2015年龙溪股份(分产品)毛利率
图:2009-2015年龙溪股份轴承业务收入及增速
表:2014年龙溪股份主要轴承子公司营业收入
表:2015年龙溪轴承在建项目投资情况
图:2015年轴研科技股权结构
图:2009-2014年轴研科技员工人数
图:2007-2015年轴研科技营业收入和净利润
图:2012-2015年轴研科技(分产品)营业收入构成
图:2009-2015年轴研科技(分地区)营业收入构成
图:2009-2015年轴研科技(分产品)毛利率
图:2007-2015年轴研科技轴承业务收入及增速
图:2012-2014年轴研科技轴承产销量
表:2014年轴研科技主要轴承子公司营业收入
表:2015年轴研科技在建项目投资情况
图:2015年宝塔实业股权结构
图:2009-2014年西北轴承员工人数
表:2013-2014年西北轴承主要客户销售额及占比
表:2013-2014年西北轴承主要供应商采购额及占比
图:2007-2014年西北轴承营业收入和净利润
图:2012-2015年西北轴承(分产品)营业收入构成
图:2009-2015年西北轴承(分地区)营业收入构成
图:2009-2015年西北轴承(分产品)毛利率
图:2009-2015年轴承业务收入
表:2014年西北轴承主要研发项目
图:2009-2015年人本集团营业收入及增速
表:人本集团轴承生产基地
图:2009-2015年人本集团轴承业务收入及增速
图:2015年万向钱潮股权结构
图:2008-2014年万向钱潮员工人数
表:2013-2014年万向钱潮主要客户销售额及增速
表:2013-2014年万向钱潮主要供应商采购及增速
图:2007-2015年万向钱潮营业收入和净利润
图:2013-2015年万向钱潮(分产品)营业收入构成
图:2012-2015年万向钱潮(分地区)营业收入构成
图:2008-2015年万向钱潮(分产品)毛利率
图:2011-2014年万向钱潮轴承产销量
表:2014年万向钱潮主要轴承子公司营业收入
图:2009-2018年全球及中国轴承行业发展速度
图:2011-2015年中国轴承进出口
图:2014年全球轴承行业竞争格局
图:2014年中国轴承行业竞争格局
Classification of Bearings
Schematic Diagram of Bearing
Global Bearing Sales, 2008-2018E
Global Bearing Sales Structure by Region, 2014
Global Top10 Bearing Manufacturers, (FY) 2014
Key Bearings during the Twelfth Five-Year Plan Period (2011-2015) in China
China’s Preferential Tax Rates on Some Imported Bearings
Number of Bearing Manufacturers in China, 2005-2015
Type of Bearing Manufacturers in China, 2014
Operating Revenue and Total Profit of Bearing Industry in China, 2011-2018E
Prosperity Index of Bearing Industry in China, 2012-2015
China’s Bearing Output, 2007-2018E
China’s Rolling Bearing Output and Growth Rate, 2007-2018
China’s Apparent Consumption of Bearing, 2007-2018E
China’s Bearing Import Volume and Value, 2011-2015
China’s Bearing Import Volume Structure by Country/Region, 2014
China’s Bearing Import Value Structure by Country/Region, 2014
China’s Bearing Export Volume and Value, 2008-2015
China’s Bearing Export Volume Structure by Country/Region, 2014
China’s Bearing Export Value Structure by Country/Region, 2014
Comparison of Bearing Industry Concentration in China, Germany, United States, and Japan, 2014
Top5 Domestic Companies by Bearing Revenue in China, 2014
China’s Bearing Output Structure by Province/Municipality, 2014-2015
Bearing Structure of Sedan (by Type)
China’s Auto Output and Sales Volume, 2008-2018E
China’s Demand for Automotive Bearing, 2013-2018E
Major Automotive Bearing Manufacturers Worldwide
Railway Mileage and Investment of China, 2011-2015
China’s Demand for Railway Bearing, 2013-2018E
China's Installed Wind Capacity, 2008-2018E
China’s Demand for Wind Power Bearing, 2009-2018E
Major Wind Power Bearing Manufacturers in China
Construction Machinery Sales Volume and Demand for Corresponding Bearing, 2006-2015
China’s Demand for Metallurgical and Mining Equipment Bearing, 2014
Number of Employees of SKF, 2009-2014
Net Sales and Net Income of SKF, 2009-2015
Revenue Structure of SKF by Business, 2012-2015
Revenue Structure of SKF by Region, 2013-2014
Applications and Share of SKF’s Bearings, 2013-2014
SKF’s Revenue from Bearing Business, 2003&2008&2014
Bearing Business Development of SKF in China, 2001-2014
Number of Employees of NSK, FY2009-FY2014
Net Sales and Net Income of NSK, FY2008-FY2014E
Revenue Structure of NSK by Business, FY2011-FY2014
Revenue Structure of NSK by Region, FY2008-FY2014
NSK’s Revenue from Bearing Business, FY2010-FY2014
Bearing Sales Structure of NSK by Business, FY2010-FY2014
Industrial Machinery Bearing Sales Structure of NSK, FY2014
Global Marketing Network of NSK, 2014
Bearing Production Bases of NSK in China
Revenue of NSK in China and Growth Rate, FY2006-FY2015
Revenue Structure of NSK in China by Business, FY2014
Number of Employees of NTN, FY2009-FY2015
Net Sales and Net Income of NTN, FY2009-FY2015
Revenue Structure of NTN by Business, FY2012-FY2015
Revenue Structure of NTN by Region, FY2009-FY2015
NTN’s Bearings and Their Applications
NTN’s Revenue from Bearing Business, FY2008-FY2015
Development History of NTN in China
NTN’s Main Production Bases and Sales Outlets in China, 2015
Number of Employees of Minebea, FY2009-FY2015
Net Sales and Net Income of Minebea, FY2009-FY2015
Revenue Structure of Minebea by Business, FY2013-FY2015
Revenue Structure of Minebea by Region, FY2012-FY2015
Main Bearings and Global Market Share of Minebea, 2014
Minebea’s Revenue from Bearing Business, FY2011-FY2016
Minebea’s Production Bases in China, 2015
Minebea’s Revenue in China and Growth Rate, FY2011-FY2015
Number of Employees of TIMKEN, 2009-2014
Net Sales and Net Income of TIMKEN, 2009-2015
Revenue Structure of TIMKEN by Business, 2012-2015
Revenue Structure of TIMKEN by Region, 2009-2014
Main Bearings of TIMKEN
TIMKEN’s Revenue from Bearing Business, 2003&2008&2014
TIMKEN’s Layout in China
TIMKEN’s Factories in China and Core Products
Development of TIMKEN in China, 2009-2015
Number of Employees of Schaeffler, 2009-2015
Net Sales and Net Income of Schaeffler, 2009-2015
Revenue Structure of Schaeffler by Business, 2011-2015
Revenue Structure of Schaeffler by Region, 2009-2015
Main Bearings of Schaeffler
Schaeffler’s Revenue from Bearing Business, 2003&2008&2014
Development History of Schaeffler in China
Number of Employees of Nachi, FY2009-FY2014
Overseas Production Bases of NACHI
Net Sales and Net Income of NACHI, FY2006-FY2015
Revenue Structure of NACHI by Product, FY2013-FY2015
Revenue Structure of NACHI by Region, FY2009-FY2015
NACHI’s Revenue from Bearing Business and Growth Rate, FY2006-FY2015
Development History of NACHI in China
Number of Employees of Jtekt, FY2009-FY2014
Net Sales and Net Income of Jtekt, FY2009-FY2014
Revenue Structure of Jtekt by Product, FY2013-FY2014
Revenue Structure of Jtekt by Region, FY2009-FY2014
Jtekt’s Revenue from Bearing Business, FY2010-FY2014
Jtekt’s Bearing Production Bases in China
Operating Revenue and Total Profit of Wafangdian Bearing Group, 2004-2015
Bearing Revenue Structure of Wafangdian Bearing Group by Product, 2013-2015
Global Marketing Network of Wafangdian Bearing Group
Revenue and Net Income of Wafangdian Bearing, 2009-2015
Revenue from and Gross Margin of Bearing Business of Wafangdian Bearing, 2010-2015
Bearing Output and Sales Volume of Wafangdian Bearing, 2012-2014
Operating Revenue and Total Profit of Luoyang LYC Bearing, 2005-2015
Competitive Product Group of Luoyang LYC Bearing
Operating Revenue and Total Profit of Harbin Bearing Manufacturing, 2004-2015
Equity Structure of Tianma Bearing Group, 2015
Number of Employees of Tianma Bearing Group, 2009-2014
Revenue and Net Income of Tianma Bearing Group, 2007-2015
Revenue Structure of Tianma Bearing Group by Product, 2012-2015
Revenue Structure of Tianma Bearing Group by Region, 2012-2014
Gross Margin of Tianma Bearing Group by Product, 2010-2015
Bearing Revenue and Growth Rate of Tianma Bearing Group, 2007-2015
Revenue of Tianma Bearing Group’s Major Bearing Subsidiaries, 2014
Equity Structure of Xiangyang Automobile Bearing, 2015
Number of Employees of Xiangyang Automobile Bearing, 2008-2014
Xiangyang Automobile Bearing’s Revenue from Major Customers and % of Total Amount, 2013-2014
Xiangyang Automobile Bearing’s Procurement from Major Suppliers and % of Total Amount, 2013-2014
Revenue and Net Income of Xiangyang Automobile Bearing, 2007-2015
Output and Sales Volume of Xiangyang Automobile Bearing’s Major Products, 2011-2014
Revenue Structure of Xiangyang Automobile Bearing by Product, 2012-2015
Revenue Structure of Xiangyang Automobile Bearing by Region, 2012-2015
Gross Margin of Xiangyang Automobile Bearing by Product, 2008-2015
Xiangyang Automobile Bearing’s Revenue from Bearing Business and Growth Rate, 2008-2015
Global Marketing Network of Xiangyang Automobile Bearing
Equity Structure of Fujian Longxi Bearing (Group), 2015
Number of Employees of Fujian Longxi Bearing (Group), 2009-2014
Revenue and Net Income of Fujian Longxi Bearing (Group), 2006-2015
Revenue Structure of Fujian Longxi Bearing (Group) by Product, 2012-2015
Revenue Structure of Fujian Longxi Bearing (Group) by Region, 2009-2015
Gross Margin of Fujian Longxi Bearing (Group) by Product, 2009-2015
Fujian Longxi Bearing (Group)’s Revenue from Bearing Business and Growth Rate, 2009-2015
Revenue of Fujian Longxi Bearing (Group)’s Major Bearing Subsidiaries, 2014
Investment in Projects under Construction of Fujian Longxi Bearing (Group), 2015
Equity Structure of Luoyang Bearing Science & Technology, 2015
Number of Employees of Luoyang Bearing Science & Technology, 2009-2014
Revenue and Net Income of Luoyang Bearing Science & Technology, 2007-2015
Revenue Structure of Luoyang Bearing Science & Technology by Product, 2012-2015
Revenue Structure of Luoyang Bearing Science & Technology by Region, 2009-2015
Gross Margin of Luoyang Bearing Science & Technology by Product, 2009-2015
Luoyang Bearing Science & Technology’s Revenue from Bearing Business and Growth Rate, 2007-2015
Bearing Output and Sales Volume of Luoyang Bearing Science & Technology, 2012-2014
Revenue of Luoyang Bearing Science & Technology’s Major Bearing Subsidiaries, 2014
Investment in Projects under Construction of Luoyang Bearing Science & Technology, 2015
Equity Structure of Baota Industry, 2015
Number of Employees of Baota Industry, 2009-2014
Baota Industry’s Revenue from Major Customers and % of Total Amount, 2013-2014
Baota Industry’s Procurement from Major Suppliers and % of Total Amount, 2013-2014
Revenue and Net Income of Baota Industry, 2007-2014
Revenue Structure of Baota Industry by Product, 2012-2015
Revenue Structure of Baota Industry by Region, 2009-2015
Gross Margin of Baota Industry by Product, 2009-2015
Baota Industry’s Revenue from Bearing Business, 2009-2015
Main R&D Projects of Baota Industry, 2014
Revenue and Growth Rate of C&U Group, 2009-2015
Bearing Production Bases of C&U Group
C&U Group’s Revenue from Bearing Business and Growth Rate, 2009-2015
Equity Structure of Wanxiang Qianchao, 2015
Number of Employees of Wanxiang Qianchao, 2008-2014
Wanxiang Qianchao’s Revenue from Major Customers and % of Total Amount, 2013-2014
Wanxiang Qianchao’s Procurement from Major Suppliers and % of Total Amount, 2013-2014
Revenue and Net Income of Wanxiang Qianchao, 2007-2015
Revenue Structure of Wanxiang Qianchao by Product, 2013-2015
Revenue Structure of Wanxiang Qianchao by Region, 2012-2015
Gross Margin of Wanxiang Qianchao by Product, 2008-2015
Bearing Output and Sales Volume of Wanxiang Qianchao, 2011-2014
Revenue of Wanxiang Qianchao’s Major Bearing Subsidiaries, 2014
Growth Rate of Global and China Bearing Industry, 2009-2018E
China’s Bearing Import & Export, 2011-2015
Competitive Landscape of Global Bearing Industry, 2014
Competitive Landscape of Bearing Industry in China, 2014
如果这份报告不能满足您的要求,我们还可以为您定制报告,请 留言说明您的详细需求。
|