|
|
|
报告导航:研究报告—
制造业—工业机械
|
|
2015-2018年全球及中国传感器行业研究报告 |
 |
字数:3.5万 |
页数:126 |
图表数:113 |
|
中文电子版:8500元 |
中文纸版:4250元 |
中文(电子+纸)版:9000元 |
|
英文电子版:2300美元 |
英文纸版:2500美元 |
英文(电子+纸)版:2600美元 |
|
编号:CYH039
|
发布日期:2015-09 |
附件:下载 |
 |
|
|
2014年,全球传感器市场规模达1260亿美元,同比增长19.4%。美国、日本、德国及中国合计占据全球传感器市场份额的72.4%,其中中国占比约10.8%。
受益于物联网等行业的快速发展,2009-2014年,中国传感器市场以年均23.6%的速度增长,至2014年其市场规模达865亿元,预计至2018年有望达2470亿元。
消费电子、汽车是目前传感器两大应用领域,2014年,其传感器需求量分别占中国总需求量的41.0%和14.8%。而未来智能汽车、可穿戴设备、工业机器人等智能化行业将是推动传感器行业发展的重要领域。
企业方面,中国70%左右传感器市场份额被意法半导体、飞思卡尔等外资企业占据;中国本土企业市场份额较小,具有代表性的企业有汉威电子、大立科技、华工科技等。
意法半导体:全球最大消费性电子和行动装置MEMS供应商,2015上半年实现收入34.47亿美元。2015年9月,公司与中国本土手机厂商即一加科技在一加2手机内集成了意法半导体的先进运动传感器和接近检测传感器。
飞思卡尔:全球主要半导体公司,主要有压力、加速等多种传感器产品。截至2015年6月底,公司传感器的累计发货量达到20亿件以上。
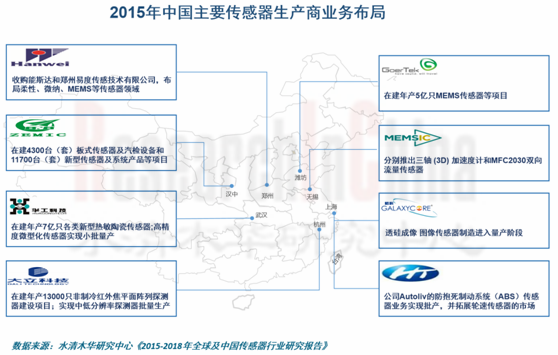
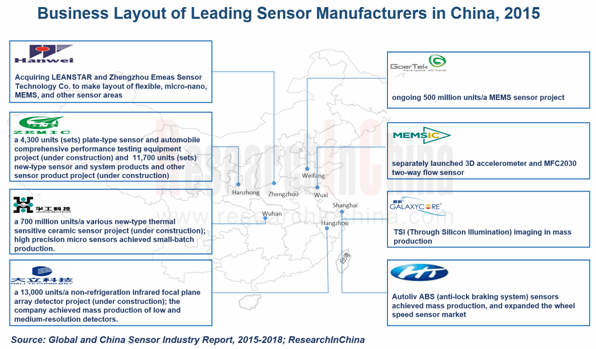
华工科技:截至2014年底,具备5亿只/年热敏传感器产能。2015年正在建设新型热敏陶瓷传感器项目,达产后公司产能扩至7亿只/年;另外,公司高精度微型化传感器已实现小批量产。
汉威电子:主营气体传感器,2014年产量达915万只。近两年,公司通过收购苏州能斯达电子科技有限公司和郑州易度传感技术有限公司,实现布局柔性、微纳、MEMS等传感器领域。
中航电测:应变式传感器是仅次于汽车检测设备的第二大业务,2015上半年贡献收入1.15亿元,占公司总收入的24.3%;公司在建年产4300台(套)板式传感器及汽检设备和11700台(套)新型传感器及系统产品等项目预计2015年底完工,届时进一步提高中国传感器市场份额。
水清木华研究中心《2015-2018年全球及中国传感器行业研究报告》着重研究了以下内容:
 全球传感器市场规模、地区结构及竞争格局等; 全球传感器市场规模、地区结构及竞争格局等;
中国传感器行业市场规模、地区结构、产品结构、竞争格局等;
智能手机、汽车工业、工业机器人、可穿戴设备等主要传感器下游应用发展情况及需求规模;
全球4家、中国11家传感器企业经营情况、传感器业务及发展战略等。
In 2014, the global sensor market valued at USD126 billion, representing a year-on-year increase of 19.4%. The United States, Japan, Germany and China occupied 72.4% share of the global sensor market together, in which China accounted for about 10.8%.
Benefiting from the rapid development of Internet of Things and other industries, the Chinese sensor market grew at an average annual growth rate of 23.6% in 2009-2014, and reached RMB86.5 billion in 2014; it is expected to value at RMB247 billion by 2018.
Consumer electronics and automobiles are two major fields of sensor application, and made up 41.0% and 14.8% of China's total demand for sensor in 2014 respectively. In future, smart cars, wearable devices, industrial robots and other intelligent industries will promote the development of the sensor industry as main engines.
As for enterprises, about 70% of the Chinese sensor market is mastered by STMicroelectronics, Freescale and other foreign companies, while Chinese companies represented by Hanwei Electronics, Dali Technology and HGTECH seize small market share.
STMicroelectronics: The world's largest MEMS supplier of consumer electronics and mobile devices gained the revenue of USD3.447 billion in the first half of 2015. In September 2015, the company integrated advanced motion sensors and proximity sensors in the mobile phone model --- OnePlus 2 made by China's local mobile phone vendor OnePlus.
Freescale: As a major semiconductor company in the world, Freescale mainly produces pressure sensors, acceleration sensors and other types of sensors. As of the end of June 2015, the total sensor shipment of the company had hit over 2 billion.
HGTECH: By the end of 2014, the company had been able to produce 500 million heat sensitive sensors each year. In 2015, it is constructing a new-type thermal ceramic sensor project, which will raise the company’s capacity to 700 million/a after reaching production target. In addition, the company has achieved small batch production of high precision micro sensors.
Hanwei Electronics: The company focuses on gas sensors. The output amounted to 9.15 million in 2014. In the past two years, the company has made layout in flexible, micro-nano, MEMS and other sensor fields through the acquisition of Suzhou LEANSTAR and Zhengzhou Yidu.
Zemic: Following automotive testing equipment, the second business --- strain sensors contributed RMB115 million or 24.3% to the total revenue in the first half of 2015. The company’s ongoing project involved with 4,300 sets of plate sensors and automotive testing equipment as well as 11,700 sets of new-type sensors and system products annually is expected be completed by the end of 2015, which will further improve its share in the Chinese sensor market.
The report focuses on the following aspects:
 Size, regional structure, competition pattern and the like of the global sensor market; Size, regional structure, competition pattern and the like of the global sensor market;
Market size, regional structure, product structure, competition pattern, etc. of China sensor industry;
Development and demand scale of major sensor applications such as smart phones, automobiles, industrial robots and wearable devices;
Operation, sensor business and development strategies of 4 global and 11 Chinese sensor companies.
第一章 传感器简介
1.1定义
1.2 分类
1.3 产业链
第二章 全球传感器市场
2.1 市场规模
2.2 地区结构
2.3 竞争格局
2.4 企业并购
第三章 中国传感器市场
3.1 发展概况
3.2 市场规模
3.3 产品结构
3.4 地区结构
3.5 竞争格局
3.6 应用结构
第四章 中国传感器主要应用领域分析
4.1 消费电子
4.1.1 发展概况
4.1.2 传感器需求
4.2 汽车工业
4.2.1 发展概况
4.2.2 传感器需求
4.2.3 主要车用传感器生产企业
4.3 可穿戴智能设备
4.3.1 发展概况
4.3.2 市场规模
4.3.3 传感器需求
4.4 工业机器人
4.4.1 发展概况
4.4.2 传感器需求
4.5 其他
4.5.1 智能仪表
4.5.2 智能家电
第五章 全球主要传感器生产商
5.1 博世
5.1.1 企业简介
5.1.2 经营情况
5.1.3 营收构成
5.1.4 传感器业务
5.1.5 在华发展
5.2 意法半导体
5.2.1 企业简介
5.2.2 经营情况
5.2.3 营收构成
5.2.4 传感器业务
5.2.5 在华发展
5.3 飞思卡尔
5.3.1 企业简介
5.3.2 经营情况
5.3.3 营收构成
5.3.4 传感器业务
5.3.5 在华发展
5.4 霍尼韦尔
5.4.1 企业简介
5.4.2 经营情况
5.4.3 营收构成
5.4.4 研发
5.4.5 传感器业务
5.4.6 在华发展
5.4.7 发展规划
第六章 中国主要传感器生产企业
6.1 高德红外(002414)
6.1.1 企业简介
6.1.2 经营情况
6.1.3 营收构成
6.1.4 研发
6.1.5 传感器业务
6.2 瑞声科技(2018.hk)
6.2.1 企业简介
6.2.2 经营情况
6.2.3 营收构成
6.2.4 客户和供应商
6.2.5 研发与在建项目
6.2.6 传感器业务
6.2.7 发展前景
6.3 华工科技(000988)
6.3.1 企业简介
6.3.2 经营情况
6.3.3 营收构成
6.3.4 毛利率
6.3.5 客户和供应商
6.3.6 研发
6.3.7 传感器业务
6.3.8 发展前景
6.4 中航电测(300114)
6.4.1 企业简介
6.4.2 经营情况
6.4.3 营收构成
6.4.4 毛利率
6.4.5 研发与在建项目
6.4.6 传感器业务
6.4.7 发展前景
6.5 大立科技(002214)
6.5.1 企业简介
6.5.2 经营情况
6.5.3 营收构成
6.5.4 毛利率
6.5.5 客户与供应商
6.5.6 研发与在建工程
6.5.7 传感器业务
6.5.8 发展前景
6.6 歌尔声学(002241)
6.6.1 企业简介
6.6.2 经营情况
6.6.3 营收构成
6.6.4 毛利率
6.6.5 客户与供应商
6.6.6 研发与在建工程
6.6.7 传感器业务
6.6.8 发展前景
6.7 汉威电子(300007)
6.7.1 企业简介
6.7.2 经营情况
6.7.3 营收构成
6.7.4 毛利率
6.7.5 研发与在建工程
6.7.6 传感器业务
6.7.7 发展前景
6.8 航天机电(600151)
6.8.1 企业简介
6.8.2 经营情况
6.8.3 营收构成
6.8.4 传感器业务
6.9 美新半导体
6.9.1 企业简介
6.9.2 经营情况
6.10 格科微电子
6.10.1 企业简介
6.10.2 经营情况
6.11 无锡维森
第七章 结论与预测
7.1 结论
7.2 预测
1 Introduction to Sensor
1.1 Definition
1.2 Classification
1.3 Industry Chain
2 Global Sensor Market
2.1 Market Size
2.2 Regional Structure
2.3 Competition Pattern
2.4 M&A
3 Chinese Sensor Market
3.1 Development Overview
3.2 Market Size
3.3 Product Structure
3.4 Regional Structure
3.5 Competition Pattern
3.6 Application Structure
4 Main Sensor Application Fields in China
4.1 Consumer Electronics
4.1.1 Development Overview
4.1.2 Sensor Demand
4.2 Automobile Industry
4.2.1 Development Overview
4.2.2 Sensor Demand
4.2.3 Major Automotive Sensor Vendors
4.3 Intelligent Wearable Devices
4.3.1 Development Overview
4.3.2 Market Size
4.3.3 Sensor Demand
4.4 Industrial Robots
4.4.1 Development Overview
4.4.2 Sensor Demand
4.5 Others
4.5.1 Smart Meter
4.5.2 Intelligent Home Appliances
5 Major Global Sensor Vendors
5.1 Bosch
5.1.1 Profile
5.1.2 Operation
5.1.3 Revenue Structure
5.1.4 Sensor Business
5.1.5 Development in China
5.2 STMicroelectronics
5.2.1 Profile
5.2.2 Operation
5.2.3 Revenue Structure
5.2.4 Sensor Business
5.2.5 Development in China
5.3 Freescale
5.3.1 Profile
5.3.2 Operation
5.3.3 Revenue Structure
5.3.4 Sensor Business
5.3.5 Development in China
5.4 Honeywell
5.4.1 Profile
5.4.2 Operation
5.4.3 Revenue Structure
5.4.4 R&D
5.4.5 Sensor Business
5.4.6 Development in China
5.4.7 Development Plan
6 Major Chinese Sensor Vendors
6.1 Guide Infrared (002414)
6.1.1 Profile
6.1.2 Operation
6.1.3 Revenue Structure
6.1.4 R&D
6.1.5 Sensor Business
6.2 AAC Technologies (2018.hk)
6.2.1 Profile
6.2.2 Operation
6.2.3 Revenue Structure
6.2.4 Customers and Suppliers
6.2.5 R&D and Projects under Construction
6.2.6 Sensor Business
6.2.7 Development Prospect
6.3 HGTECH (000988)
6.3.1 Profile
6.3.2 Operation
6.3.3 Revenue Structure
6.3.4 Gross Margin
6.3.5 Customers and Suppliers
6.3.6 R&D
6.3.7 Sensor Business
6.3.8 Development Prospect
6.4 Zemic (300114)
6.4.1 Profile
6.4.2 Operation
6.4.3 Revenue Structure
6.4.4 Gross Margin
6.4.5 R&D and Projects under Construction
6.4.6 Sensor Business
6.4.7 Development Prospect
6.5 Dali Technology (002214)
6.5.1 Profile
6.5.2 Operation
6.5.3 Revenue Structure
6.5.4 Gross Margin
6.5.5 Customers and Suppliers
6.5.6 R&D and Projects under Construction
6.5.7 Sensor Business
6.5.8 Development Prospect
6.6 GoerTek (002241)
6.6.1 Profile
6.6.2 Operation
6.6.3 Revenue Structure
6.6.4 Gross Margin
6.6.5 Customers and Suppliers
6.6.6 R&D and Projects under Construction
6.6.7 Sensor Business
6.6.8 Development Prospect
6.7 Hanwei Electronics (300007)
6.7.1 Profile
6.7.2 Operation
6.7.3 Revenue Structure
6.7.4 Gross Margin
6.7.5 R&D and Projects under Construction
6.7.6 Sensor Business
6.7.7 Development Prospect
6.8 Shanghai Aerospace Automobile Electromechanical (600151)
6.8.1 Profile
6.8.2 Operation
6.8.3 Revenue Structure
6.8.4 Sensor Business
6.9 MEMSIC
6.9.1 Profile
6.9.2 Operation
6.10 Galaxycore
6.10.1 Profile
6.10.2 Operation
6.11 Wissen
7 Summary and Forecast
7.1 Summary
7.2 Forecast
图:传感器定义示意图
图:传感器的组成
表:传感器分类
图:传感器产业链
图:2009-2015年全球传感器市场规模
图:2014年全球传感器市场(分地区)市场规模占比
表:全球主要传感器生产企业
表:2014-2015年全球传感器企业主要并购事件
表:中国传感器发展历程
图:2009-2014年中国传感器市场规模及同比增长
图:2011-2015年中国传感器产量及同比增长
图:2014年中国传感器(分产品)市场份额
表:2015年中国传感器地区分布
图:2014年中国传感器(分用途)市场份额
图:2011-2018年全球智能手机出货量及同比增长
图:2011-2018年中国智能手机出货量及同比增长
表:2013-2018年全球及中国智能手机传感器需求规模
图:汽车分车型传感器安装数目
图:2011-2014年全球汽车传感器市场规模
图:2011-2018年中国汽车用传感器市场规模及同比增长
表:2014-2015年全球汽车传感器厂家收入排名
图:2011-2018年中国可穿戴设备市场规模及同比增长率
图:2012-2015年中国可穿戴智能设备出货量及同比增长
图:汽车传感器分布
表:可穿戴设备用传感器类型
表:2013-2018年中国可穿戴智能设备用传感器需求量
图:2008-2015年全球工业机器人销量及同比增长
图:2015年智能仪表(分产品)市场规模
图:2010-2014年博世营业收入与净利润
图:2013-2014年博世(分业务)销售额构成
图:2009-2014年博世(分国家)销售额构成
图:2005-2015年博世消费类电子传感器发展历程
图:2009-2014年博世在华销售额及同比增长
图:意法半导体产品结构
图:2010-2015年意法半导体营业收入与净利润
表:2012-2015年意法半导体(分产品)销售额及构成
表:2012-2014年意法半导体(分地区)销售额及构成
图:意法半导体主要传感器产品
图:2015年意法半导体在华发展
图:2012-2015年飞思卡尔销售额及净利润
表:2013-2015年飞思卡尔(分产品)销售额及构成
表:2012-2014年飞思卡尔(分国家/地区)销售额及构成
图:2010-2015年Honeywell净销售额及净利润
表:2012-2015年Honeywell(分业务)净销售额及构成
图:2009-2014年Honeywell(分地区)净销售额
图:2009-2014年Honeywell研发投入及占比
表:1994-2015年Honeywell公司在中国分业务发展历程
图:2015-2020年Honeywell业务规划
图:2010-2015年高德红外营业收入与净利润
表:2013-2014年高德红外红外热成像仪产销量、库存量及产销率
图:2010-2015年高德红外红外热成像仪营业收入及同比增长
图:2010-2014年高德红外(分地区)主营业务收入
图:2013-2015年高德红外研发投入与占比
图:瑞声科技研发中心及生产基地分布
图:2010-2015年瑞声科技营业收入与净利润
图:2013-2015年瑞声科技(分产品)主营业务收入构成
图:2010-2014年瑞声科技(分地区)营业收入构成
表:2010-2014年瑞声科技前五名客户和第一名客户营业收入贡献占比
表:2011-2014年瑞声科技前五名供应商和第一名供应商采购金额占比
图:2010-2015年瑞声科技研发投入及占比
图:2010-2015年瑞声科技MEMS器件业务营业收入及同比增长
表:2014-2018年瑞声科技营业收入与净利润
图:2010-2015年华工科技营业收入与净利润
图:2012-2015年华工科技(分产品)主营业务收入构成
图:2010-2015年华工科技(分地区)主营业务收入
图:2010-2015年华工科技(分产品)毛利率
表:2009-2014年华工科技第一名和前五名客户营业收入贡献及占比
表:2007-2014年华工科技前五名供应商合计采购金额及占比
图:2011-2015年华工科技研发投入及占比
表:2011-2014年华工科技(分产品)传感器产能与产量
图:2010-2015年华工科技传感器业务营业收入及同比增长
表:2011-2014年华工科技传感器(分产品)产销量与产销率
表:2014-2018年华工科技营业收入与净利润
图:2010-2015年中航电测营业收入与净利润
图:2010-2015年中航电测(分产品)主营业务构成
图:2010-2014年中航电测(分地区)主营业务收入
图:2010-2015年中航电测(分产品)毛利率
图:2011-2015年中航电测研发投入与占比
表:2015年中航电测主要研发项目及进展
表:2015年中航电测主要在建项目
图:2010-2015年中航电测传感器营业收入及同比增长
表:2010&2014年中航电测传感器(分产品)营业收入及占比
表:2013-2014年中航电测传感器产销量
表:2014-2018年中航电测营业收入与净利润
图:2010-2015年大立科技营业收入与净利润
图:2010-2015年大立科技(分产品)主营业务收入构成
图:2010-2015年大立科技(分地区)主营业务收入
图:2010-2015年大立科技(分产品)毛利率
表:2010-2014年大立科技第一名和前五名客户营业收入贡献及占比
表:2010-2014年大立科技前五名供应商采购金额及占比
表:2013-2014年大立科技主要原材料用量及占比
图:2013-2015年大立科技研发投入及占比
表:截至2015年8月底大立科技主要在建项目
表:2013-2014年大立科技红外热像仪产销量与库存量
表:大立科技焦平面探测器发展历程
表:2014-2018年大立科技营业收入与净利润
图:2010-2015年歌尔声学营业收入与净利润
表:2013-2014年歌尔声学电子元器件产销量
图:2010-2015年歌尔声学(分产品)主营业务收入
图:2014年歌尔声学(分产品)主营业务收入构成
图:2010-2015年歌尔声学(分地区)主营业务收入
图:2010-2015年歌尔声学(分产品)毛利率
表:2009-2014年歌尔声学第一名和前五名客户合计营业收入贡献及占比
表:歌尔声学(分客户)产品分布
表:2009-2014年歌尔声学前五名供应商合计采购金额占比
图:2012-2015年歌尔声学研发投入及占比
表:截至2015年8月底歌尔声学在建项目及新增产品产能
表:2014-2018年歌尔声学营业收入与净利润
图:2010-2015年汉威电子营业收入与净利润
图:2010-2015年汉威电子(分产品)主营业务构成
图:2010-2014年汉威电子(分地区)主营业务收入
图:2010-2015年汉威电子(分产品)毛利率
图:2009-2015年汉威电子研发投入及占比
表:2014-2015年汉威电子主要业务布局大事件
图:2010-2015年汉威电子气体传感器营业收入、毛利率及同比增长率
图:2010-2014年汉威电子传感器产销量
表:2014-2018年汉威电子营业收入与净利润
图:2010-2015年航天机电营业收入与净利润
图:2010-2015年航天机电(分业务)主营业务收入
表:2014-2015年美新半导体新推出传感器产品
图:2010&2014年格科微电子传感器芯片出货量
表:格科微电子传感器产品
表:2012-2015年维森传感器业务发展大事件
表:2014-2015年中国传感器主要企业收入、产销量
图:2014-2018年全球传感器市场规模
图:2014-2018年中国传感器市场规模及同比增长
Definition of Sensor
Composition of Sensor
Classification of Sensor
Sensor Industry Chain
Global Sensor Market Size, 2009-2015
Global Sensor Market Size and Structure (by Region), 2014
Major Global Sensor Vendors
Main M&A Cases of Global Sensor Enterprises, 2014-2015
China's Sensor Development Course
China's Sensor Market Size and YoY Growth, 2009-2014
China's Sensor Output and YoY Growth, 2011-2015
China's Sensor Market Share (by Product), 2014
China's Sensor Regional Distribution, 2015
China's Sensor Market Share (by Application), 2014
Global Smartphone Shipment and YoY Growth, 2011-2018E
China's Smartphone Shipment and YoY Growth, 2011-2018E
Global and China's Smartphone Sensor Demand Scale, 2013-2018E
Sensor Installation by Car Model
Global Automotive Sensor Market Size, 2011-2014
China's Automotive Sensor Market Size and YoY Growth, 2011-2018E
Revenue Ranking of Global Automotive Sensor Vendors, 2014-2015
China's Wearable Device Market Size and YoY Growth Rate, 2011-2018E
China's Wearable Smart Device Shipment and YoY Growth, 2012-2015
Automotive Sensor Distribution
Types of Wearable Device Sensor
China's Demand for Wearable Smart Device Sensor, 2013-2018E
Global Industrial Robot Sales Volume and YoY Growth, 2008-2015
Smart Meter Market Size (by Product), 2015
Bosch's Revenue and Net Income, 2010-2014
Bosch's Sales Structure (by Business), 2013-2014
Bosch's Sales Structure (by Country), 2009-2014
Bosch's Consumer Electronic Sensor Development Course, 2005-2015
Bosch's Sales and YoY Growth in China, 2009-2014
Product Structure of STMicroelectronics
Revenue and Net Income of STMicroelectronics, 2010-2015
Sales and Structure of STMicroelectronics (by Product), 2012-2015
Sales and Structure of STMicroelectronics (by Region), 2012-2014
Main Sensor Products of STMicroelectronics
Development of STMicroelectronics in China, 2015
Freescale's Sales and Net Income, 2012-2015
Freescale's Sales and Structure (by Product), 2013-2015
Freescale's Sales and Structure (by Country / Region), 2012-2014
Honeywell's Net Sales and Net Income, 2010-2015
Honeywell's Net Sales and Structure (by Business), 2012-2015
Honeywell's Net Sales (by Region), 2009-2014
Honeywell's R&D Costs and % of Total Revenue, 2009-2014
Honeywell's Development Course in China by Business, 1994-2015
Honeywell's Business Planning, 2015-2020
Revenue and Net Income of Guide Infrared, 2010-2015
Infrared Thermal Imager Output and Sales Volume, Inventory and Sales-Output Ratio of Guide Infrared, 2013-2014
Infrared Thermal Imager Revenue and YoY Growth of Guide Infrared, 2010-2015
Operating Revenue of Guide Infrared (by Region), 2010-2014
R&D Costs and % of Total Revenue of Guide Infrared, 2013-2015
R&D Centers and Production Bases of AAC Technologies
Revenue and Net Income of AAC Technologies, 2010-2015
Operating Revenue Structure of AAC Technologies (by Product), 2013-2015
Revenue Structure of AAC Technologies (by Region), 2010-2014
Revenue from Top 5 Clients and % of Total Revenue of AAC Technologies, 2010-2014
Procurement from Top 5 Suppliers and % of Total Procurement of AAC Technologies, 2011-2014
R&D Costs and % of Total Revenue of AAC Technologies, 2010-2015
MEMS Component Revenue and YoY Growth of AAC Technologies, 2010-2015
Revenue and Net Income of AAC Technologies, 2014-2018E
HGTECH's Revenue and Net Income, 2010-2015
HGTECH's Operating Revenue Structure (by Product), 2012-2015
HGTECH's Operating Revenue (by Region), 2010-2015
HGTECH's Gross Margin (by Product), 2010-2015
HGTECH's Revenue from Top 5 Clients and % of Total Revenue, 2009-2014
HGTECH's Procurement from Top 5 Suppliers and % of Total Procurement, 2007-2014
HGTECH's R&D Costs and % of Total Revenue, 2011-2015
HGTECH's Sensor Capacity and Output (by Product), 2011-2014
HGTECH's Sensor Business Revenue and YoY Growth, 2010-2015
HGTECH's Sensor Output, Sales Volume and Sales-Output Ratio (by Product), 2011-2014
HGTECH's Revenue and Net Income, 2014-2018E
Zemic's Revenue and Net Income, 2010-2015
Zemic's Main Business Structure (by Product), 2010-2015
Zemic's Operating Revenue (by Region), 2010-2014
Zemic's Gross Margin (by Product), 2010-2015
Zemic's R&D Costs and % of Total Revenue, 2011-2015
Zemic's Main R&D Projects and Progress, 2015
Zemic's Main Projects under Construction, 2015
Zemic's Sensor Revenue and YoY Growth, 2010-2015
Zemic's Sensor Revenue and Structure (by Product), 2010 & 2014
Zemic's Sensor Output and Sales Volume, 2013-2014
Zemic's Revenue and Net Income, 2014-2018E
Revenue and Net Income of Dali Technology, 2010-2015
Operating Revenue Structure of Dali Technology (by Product), 2010-2015
Operating Revenue of Dali Technology (by Region), 2010-2015
Gross Margin of Dali Technology (by Product), 2010-2015
Revenue from Top 5 Clients and % of Total Revenue of Dali Technology, 2010-2014
Procurement from Top 5 Suppliers and % of Total Procurement of Dali Technology, 2010-2014
Main Raw Material Consumption and Structure of Dali Technology, 2013-2014
R&D Costs and % of Total Revenue of Dali Technology, 2013-2015
Main Projects under Construction of Dali Technology, as of the end of August 2015
Infrared Thermal Imager Output, Sales Volume and Inventory of Dali Technology, 2013-2014
Development Course of Focal Plane Array Detectors of Dali Technology
Revenue and Net Income of Dali Technology, 2014-2018E
GoerTek's Revenue and Net Income, 2010-2015
GoerTek's Electronic Component Output and Sales Volume, 2013-2014
GoerTek's Operating Revenue (by Product), 2010-2015
GoerTek's Operating Revenue Structure (by Product), 2014
GoerTek's Operating Revenue (by Region), 2010-2015
GoerTek's Gross Margin (by Product), 2010-2015
GoerTek's Revenue from Top 5 Clients and % of Total Revenue, 2009-2014
GoerTek's Product Distribution (by Client)
GoerTek's Procurement from Top 5 Suppliers and % of Total Procurement, 2009-2014
GoerTek's R&D Costs and % of Total Revenue, 2012-2015
GoerTek's Projects under Construction and New Product Capacity, as of the end of August 2015
GoerTek's Revenue and Net Income, 2014-2018E
Revenue and Net Income of Hanwei Electronics, 2010-2015
Main Business Structure of Hanwei Electronics (by Product), 2010-2015
Operating Revenue of Hanwei Electronics (by Region), 2010-2014
Gross Margin of Hanwei Electronics (by Product), 2010-2015
R&D Costs and % of Total Revenue of Hanwei Electronics, 2009-2015
Main Business Layout of Hanwei Electronics, 2014-2015
Gas Sensor Revenue, Gross Margin and YoY Growth Rate of Hanwei Electronics, 2010-2015
Sensor Output and Sales Volume of Hanwei Electronics, 2010-2014
Revenue and Net Income of Hanwei Electronics, 2014-2018E
Revenue and Net Income of Shanghai Aerospace Automobile Electromechanical, 2010-2015
Operating Revenue of Shanghai Aerospace Automobile Electromechanical (by Business), 2010-2015
MEMSIC's New Sensor Products, 2014-2015
Galaxycore's Sensor Chip shipment, 2010 & 2014
Galaxycore's Sensor Products
Wissen's Main Sensor Business Events, 2012-2015
Revenue, Output and Sales Volume of Major Sensor Enterprises in China, 2014-2015
Global Sensor Market Size, 2014-2018E
China's Sensor Market Size and YoY Growth, 2014-2018E
如果这份报告不能满足您的要求,我们还可以为您定制报告,请 留言说明您的详细需求。
|