|
|
|
报告导航:研究报告—
生命科学—制药医疗
|
|
2014-2018年中国医疗机器人行业研究报告 |
 |
字数:1.9万 |
页数:69 |
图表数:69 |
|
中文电子版:6500元 |
中文纸版:3250元 |
中文(电子+纸)版:7000元 |
|
英文电子版:1700美元 |
英文纸版:1850美元 |
英文(电子+纸)版:2000美元 |
|
编号:ZYM069
|
发布日期:2015-09 |
附件:下载 |
 |
|
|
医疗机器人可应用于伤病员的手术、救援、转运、护理和康复等。其中,手术和康复机器人是目前备注市场关注的两大细分产品。
康复机器人由于技术壁垒相对较低,涉足企业较多如美国的Ekso Bionics、以色列的ReWalk 新西兰的Robotics、Rex Bionics以及日本的Cyberdyne等。但是手术机器人全球市场主要被美国的Intuitive Surgical 公司占据,其达芬奇手术机器人已销售3266台(截至2014年底)。由于手术机器人技术壁垒较高、价格高昂以及后期配套耗材和医生培训等因素影响,具有先发优势的达芬奇手术机器人未来较长一段时间仍将占据绝对优势。
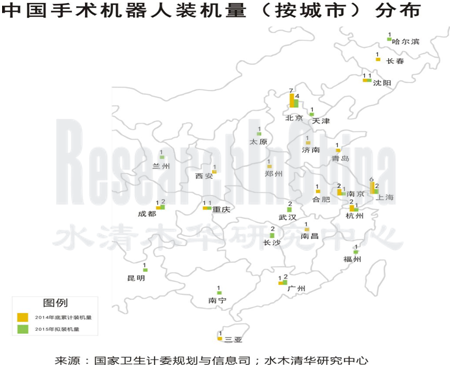
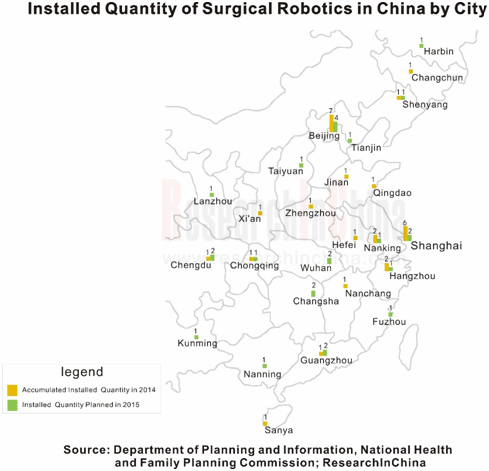
虽然中国医疗机器人研究起步不晚,但发展要相对落后,目前手术机器人也是依赖进口。截至2014年底,中国有24家医院进口了29台手术机器人。2014年,这些手术机器人手术完成量为5116例,累计完成11651例。根据目前卫生计审批情况,2015年底,中国进口手术机器人累计装机量至少可达54台左右,累计手术完成量将达2万例。
不过,目前中国本土手术机器人研究也取得了一定进展。如天津大学(与妙手集团合作)的微创外科手术机器人系统“妙手S”已进入临床;哈工大机器人研究所(关联企业有博实股份及参股的哈尔滨思哲睿)的微创腹腔外科手术机器人系统预计2015年底可以申请产品形式检验,并在2017年底申请产品注册。因此,2018年前后中国市场有望出现商业化的本土手术机器人。
虽然中国本土手术机器人产业化发展较慢,但已有多家企业实现了康复机器人样机或者产业化推广,如上海璟和、深圳迈康信、安阳神方等。并且,沈阳新松机器人、广东金明精机、湖北楚天科技、广东美的集团等上市公司也开始布局该产业。
考虑到中国老龄化趋势日益加剧及肢体残疾的庞大基数,预计中国康复机器人市场潜力可达百亿。而具备价格及地域优势的中国本土康复机器人,未来有望占据较高市场份额。
《2014-2018年中国医疗机器人行业研究报告》主要包括以下几个方面:
 中国医疗机器人运营环境分析,包括国际市场环境、国内政策等; 中国医疗机器人运营环境分析,包括国际市场环境、国内政策等;
中国医疗机器人行业发展现状、竞争格局以及细分市场(康复机器人和手术机器人)分析等;
海外5家、中国10家医疗机器人企业经营状况、医疗机器人业务及发展前景等。
Medical robots can be applied to surgeries, rescue, transport, nursing and rehabilitation of the sick and wounded. Wherein, surgery and rehabilitation robots are two striking market segments.
Due to the relatively low technical barriers, numerous companies such as Ekso Bionics (the United States), ReWalk (Israel), Robotics (New Zealand), Rex Bionics (New Zealand) and Cyberdyne (Japan) have got into the field of rehabilitation robots. However, the global surgical robot market is mainly occupied by the US-based Intuitive Surgical, who had sold out 3,266 Da Vinci surgical robots by the end of 2014. Thanks to high technical barriers, high costs, supporting supplies, training of doctors and other factors, Da Vinci surgical robots featured with preemptive advantages will still master the absolute leadership in the long run.
Although China did not start research on medical robots late, it is backward in terms of the development, and is currently dependent on imported surgical robots. By the end of 2014, 24 Chinese hospitals had imported 29 surgeries robots which accomplished 11,651 surgeries cumulatively (5,116 in 2014). In accordance with examination and approval of National Health and Family Planning Commission of China, China will import a total of at least 54 surgical robots which are expected to complete 20,000 surgeries by the end of 2015.
However, China has also made some progress in local surgical robots. For example, the minimally invasive surgical robot system “Smart S” developed by Tianjin University and Smart Robot Technology Group jointly has entered clinical stages; HIT Robot Institute (affiliated companies: Boshi Automation and Harbin Sizherui) expects to apply for testing of its minimally invasive celiac surgical robot system in the form of product testing at the end of 2015, and apply for registration at the end of 2017. Therefore, commercial local surgical robots may emerge in the Chinese market in 2018.
Although China's local surgical robot industrialization develops slowly, many companies, such as Jimho Robot (Shanghai), Shenzhen Mai Kangxin Medical and Anyang SF Robot, have realized prototypes of rehabilitation robots or industrialization promotion. In addition, listed companies including Shenyang SIASUN, Jinming Machinery (Guangdong), Truking Technology and Midea Group have embarked on the layout of the industry.
Given China's intensified aging trend and huge base of physical disability, Chinese rehabilitation robot market may value RMB10 billion potentially. Chinese local rehabilitation robots with price and regional advantages will seize higher market shares in the future.
The report includes the following aspects:
 Operating environments of Chinese medical robots, including international market environments and domestic policies; Operating environments of Chinese medical robots, including international market environments and domestic policies;
Status quo, competition pattern and market segments (rehabilitation robots and surgical robots) of China medical robot industry;
Operation, medical robot business and development prospect of 5 overseas and 10 Chinese medical robot companies.
第一章 医疗机器人相关概念
1.1定义
1.1.1 机器人
1.1.2 医疗机器人
1.2 产业链
第二章 中国医疗机器人运行环境分析
2.1 全球市场概况
2.1.1 市场现状
2.1.2 竞争格局
2.2 相关政策
第三章 中国医疗机器人发展概况
3.1 总体概况
3.2 康复医疗机器人
3.2.1 老龄化趋势日益加剧
3.3.2 残疾人口基数大
3.3 手术机器人
第四章 全球主要医疗机器人企业
4.1 Intuitive Surgical, Inc.
4.1.1公司简介
4.1.2经营情况
4.1.3营收构成
4.1.4毛利率
4.1.5研发
4.2 Stryker Corporation
4.2.1公司简介
4.2.2经营情况
4.2.3营收构成
4.2.4毛利率
4.2.5研发
4.2.6医疗机器人业务
4.3Ekso Bionics Holdings, Inc.
4.3.1公司简介
4.3.2经营情况
4.3.3营收构成
4.3.4毛利率
4.3.5研发
4.4ReWalk Robotics Ltd.
4.4.1公司简介
4.4.2经营情况
4.4.3营收构成
4.4.4毛利率
4.4.5研发
4.5Rex Bionics Plc
第五章 中国主要医疗机器人企业
5.1沈阳新松机器人自动化股份有限公司
5.1.1公司简介
5.1.2经营情况
5.1.3营收构成
5.1.4毛利率
5.1.5医疗机器人业务
5.1.6发展前景与预测
5.2广东金明精机股份有限公司
5.2.1公司简介
5.2.2经营情况
5.2.3医疗机器人业务
5.3美的集团股份有限公司
5.3.1公司简介
5.3.2经营情况
5.3.3医疗机器人业务
5.4楚天科技股份有限公司
5.4.1公司简介
5.4.2经营情况
5.4.3医疗机器人业务
5.5哈尔滨博实自动化股份有限公司
5.5.1公司简介
5.5.2经营情况
5.5.3医疗机器人业务
5.6重庆市迪马实业股份有限公司
5.6.1公司简介
5.6.2经营情况
5.6.3医疗机器人业务
5.7 其他企业
5.7.1 妙手机器人科技集团公司
5.7.2上海璟和技创机器人有限公司
5.7.3深圳市迈康信医用机器人有限公司
5.7.4安阳神方康复机器人有限公司
1.Overview of Medical Robotics
1.1 Definition
1.1.1 Robotics
1.1.2 Medical Robotics
1.2 Industry Chain
2. Analysis on Operation Environment of Medical Robotics in China
2.1 Global Market Overview
2.1.1 State Quo
2.1.2 Competition Pattern
2.2 Policies
3. Medical Robotics in China
3.1 Overview
3.2 Rehabilitation Medical Robotics
3.2.1 Increasingly-intensified Aging Trend
3.3.2 Huge Disabled Population
3.3 Surgical Robotics
4. Major Medical Robotics Companies Worldwide
4.1 Intuitive Surgical, Inc.
4.1.1 Profile
4.1.2 Operation
4.1.3 Revenue Structure
4.1.4 Gross Margin
4.1.5 R&D
4.2 Stryker Corporation
4.2.1 Profile
4.2.2 Operation
4.2.3 Revenue Structure
4.2.4 Gross Margin
4.2.5 R&D
4.2.6 Medical Robotics Business
4.3 Ekso Bionics Holdings, Inc.
4.3.1 Profile
4.3.2 Operation
4.3.3 Revenue Structure
4.3.4 Gross Margin
4.3.5 R&D
4.4 ReWalk Roboticsics Ltd.
4.4.1 Profile
4.4.2 Operation
4.4.3 Revenue Structure
4.4.4 Gross Margin
4.4.5 R&D
4.5 Rex Bionics Plc
5. Major Medical Robotics Enterprises in China
5.1 Shenyang SIASUN Robot & Automation Co., Ltd.
5.1.1 Profile
5.1.2 Operation
5.1.3 Revenue Structure
5.1.4 Gross Margin
5.1.5 Medical Robotics Business
5.1.6 Development Prospect & Forecast
5.2 Jinming Machinery (Guangdong) Co., Ltd.
5.2.1 Profile
5.2.2 Operation
5.2.3 Medical Robotics Business
5.3 Midea Group Co., Ltd.
5.3.1 Profile
5.3.2 Operation
5.3.3 Medical Robotics Business
5.4 Truking Technology Limited
5.4.1 Profile
5.4.2 Operation
5.4.3 Medical Robotics Business
5.5 Harbin Boshi Automation Co., Ltd.
5.5.1 Profile
5.5.2 Operation
5.5.3 Medical Robotics Business
5.6 Chongqing Dima Industry Co., Ltd.
5.6.1 Profile
5.6.2 Operation
5.6.3 Medical Robotics Business
5.7 Other
5.7.1 Smart Robot Technology Group Co., Ltd.
5.7.2 Jimho Robot (Shanghai) Co., Ltd.
5.7.3 Shenzhen Mai Kangxin Medical Co., Ltd.
5.7.4 Anyang SF Robot Co., Ltd.
表:医疗机器人分类及主要公司
图:机器人成本结构
表:主要国家机器人产业发展规划
图: 2009-2014年全球专用服务机器人销量及同比增长
图:全球专用服务机器人分类占比(按销量)
图: 2009-2014年全球医疗机器人销量及同比增长
图:2014/2020E年全球手术机器人市场规模
图:2014/2020E年全球康复机器人市场规模
表:全球主要手术机器人企业及其产品
表:2010-2015年中国机器人产业部分相关规划
表:2014-2015年中国机器人产业园及规划目标
表:中国主要医疗机器人研究机构或企业及其产品
图:2009-2014年中国65岁及以上人口数量及占总人口数比重
图:2009-2014年中国15-64岁人口占比
图:2009-2014E中国平均家庭户规模
图:2010年中国各类残疾人口占比
图:2007-2013年中国城镇和农村残疾人可支配收入
图:2007-2013年中国城镇和农村残疾人恩格尔系数
图:2007-2013年中国城镇残疾人医疗保健支出及占消费支出比重
图:2007-2013年中国农村残疾人医疗保健支出及占消费支出比重
表:截至2014年底中国大陆医院手术机器人配置情况
表:2015-2016年中国大陆拟装手术机器人数量
图:2010-2015年Intuitive Surgical营业收入与净利润
图:2013 – 2014年达芬奇手术系统(分地区)装机量
图:2014年达芬奇手术系统(按结构类型)装机占比
图:截止2014年底全球达芬奇(分地区)装机量
图:2009-2015年达芬奇系统(分类型)手术量
图:2012-2014年Intuitive Surgical(分产品)营业收入
图:2010-2015年Intuitive Surgical毛利率
图:2012-2015年Intuitive Surgical研发投入及占营业收入比重
图:2009-2015年Stryker营业收入及净利润
图:2009-2015年Stryker营业收入(分产品)
表:2011-2015年Stryker修复产品营业收入及构成(按用途)
表:2011-2015年Stryker医疗系统营业收入及构成(按用途)
表:2011-2015年Stryker神经技术和脊椎营业收入及构成(按用途)
图:2009-2014年Stryker毛利率
图:Makoplasty 膝关节和髋关节系统
图:2011-2015年Ekso Bionics营业收入
图:2011-2015年Ekso Bionics净利润
图:2012-2015年Ekso Bionics(分产品)营业收入
图:2012-2015年Ekso Bionics研发投入及占营业收入的比重
图:2012-2015年Rewalk Robotics营业收入
图:2012-2015年Rewalk Robotics净利润
图:2012-2015年Rewalk Robotics(分地区)营业收入
图:2012-2015年Rewalk Robotics研发投入及占营业收入比重
表:2014年新松机器人主要控股/参股公司运营情况(百万元)
图:2008-2015年新松机器人营业收入及净利润
表:2010-2015年新松机器人(分产品)营业收入
表:2010-2014年新松机器人(分地区)主营业务收入
表:2010-2014年新松机器人(分产品)毛利率
图:2009-2014年新松机器人工业机器人业务收入及毛利润
图:2010-2015年金明精机营业收入与净利润
表:2010-2015年金明精机毛利率
表:2010-2015年金明精机(分产品)营业收入
表:金明精机与清华大学联合研究中心的研究方向
图:2012-2015年美的集团营业收入与净利润
图:2012-2015年美的集团毛利率
图:2012-2015年美的集团(分产品)营业收入
表:美的涉足机器人业务的参股公司
图:2010-2015年楚天科技营业收入及净利润
图:2010-2015年楚天科技毛利率
表:2010-2015年楚天科技(分产品)营业收入
图:2010-2015年博实股份营业收入与净利润
图:2010-2015年博实股份毛利率
图:2010-2015年博实股份(分产品)营业收入
图:2010-2015年迪马股份营业收入与净利润
图:2010-2015年迪马股份毛利率
表:2010-2015年迪马股份(分产品)营业收入
Classification of Medical Robotics and Major Companies
Cost Structure of Medical Robotics
Medical Robotics Industry Development Plans of Major Countries
Sales Volume of Professional Service Robotics and YoY Growth Worldwide, 2009-2014
Proportion of Global Professional Service Robotics (by Sales Volume)
Sales Volume of Medical Robotics and YoY Growth Worldwide, 2009-2014
Global Surgical Robotics Market Size, 2014/2020E
Global Rehabilitation Robotics Market Size, 2014/2020E
China’s Plans on Robotics Industry, 2010-2015
Robotics Industry Parks in China and Planning Goal, 2014-2015
Major Medical Robotics Research Institutions/Companies in China and Their Products
64-year-old (or above) Population in China and % in Total, 2009-2014
15 to 64-year-old Population’s Proportion in Total of China, 2009-2014
Average Family Size in China, 2009-2014E
Disabled Population’ Proportion in China’s Total by Type, 2010
Disposable Income of Urban and Rural Disabled Persons in China, 2007-2013
Engel Coefficient of Urban and Rural Disabled Persons in China, 2007-2013
Urban Disabled Persons’ Medical Healthcare Expenditures in China and % in Consumer Spending, 2007-2013
Rural Disabled Persons’ Medical Healthcare Expenditures in China and % in Consumer Spending, 2007-2013
Medical Robotics Configuration in Hospitals of Chinese Mainland, 2014
Quantity of Planned Medical Robotics in Hospitals of Chinese Mainland, 2015-2016E
Revenue and Net Income of Intuitive Surgical, 2010-2015
System Placements of da Vinci Surgical System, 2013-2014
Systems Placement Mix of da Vinci Surgical System, 2014
System Placements of da Vinci Surgical System by Region, 2014
Surgical Operation Quantity of da Vinci Surgical System by Type, 2009-2015
Revenue of Intuitive Surgical by Product, 2012-2014
Gross Margin of Intuitive Surgical, 2010-2015
R&D Costs and % of Total Revenue of Intuitive Surgical, 2012-2015
Revenue and Net Income of Stryker, 2009-2015
Revenue of Stryker by Product, 2009-2015
Repair Products’ Revenue Breakdown of Stryker by Application, 2011-2015
Medical System’s Revenue Breakdown of Stryker by Application, 2011-2015
Neural Technology & Spine Business’s Revenue Breakdown of Stryker by Application, 2011-2015
Gross Margin of Stryker, 2009-2014
Knee-joint and Hip-joint Systems of Makoplasty
Revenue of Ekso Bionics, 2011-2015
Net Income of Ekso Bionics, 2011-2015
Revenue of Ekso Bionics by Product, 2012-2015
R&D Costs and % of Total Revenue of Ekso Bionics, 2012-2015
Revenue of Rewalk Robotics, 2012-2015
Net Income of Rewalk Robotics, 2012-2015
Revenue of Rewalk Robotics by Region, 2012-2015
R&D Costs and % of Total Revenue of Rewalk Robotics, 2012-2015
Operation of SIASUN’s Major Subsidiaries, 2014
Revenue and Net Income of SIASUN, 2008-2015
Revenue of SIASUN by Product, 2010-2015
Operating Revenue of SIASUN by Region, 2010-2014
Gross Margin of SIASUN by Product, 2010-2014
Revenue and Gross Profit of SIASUN’s Industrial Robot Business, 2009-2014
Revenue and Net Income of Jinming Machinery, 2010-2015
Gross Margin of Jinming Machinery, 2010-2015
Revenue of Jinming Machinery by Product, 2010-2015
Research Direction of Jinming Machinery and Tsinghua University’s Joint Research Center
Revenue and Net Income of Midea Group, 2012-2015
Gross Margin of Midea Group, 2012-2015
Revenue of Midea Group by Product, 2012-2015
Midea’s Subsidiaries Involving Robotics Business
Revenue and Net Income of Truking Technology, 2010-2015
Gross Margin of Truking Technology, 2010-2015
Revenue of Truking Technology by Product, 2010-2015
Revenue and Net Income of Boshi Automation, 2010-2015
Gross Margin of Boshi Automation, 2010-2015
Revenue of Boshi Automation by Product, 2010-2015
Revenue and Net Income of Dima Industry, 2010-2015
Gross Margin of Dima Industry, 2010-2015
Revenue of Dima Industry by Product, 2010-2015
如果这份报告不能满足您的要求,我们还可以为您定制报告,请 留言说明您的详细需求。
|