|
|
|
报告导航:研究报告—
农业与食品—农业
|
|
2015-2018年中国水产养殖行业研究报告 |
 |
字数:3.6万 |
页数:145 |
图表数:183 |
|
中文电子版:8500元 |
中文纸版:4250元 |
中文(电子+纸)版:9000元 |
|
英文电子版:2550美元 |
英文纸版:2700美元 |
英文(电子+纸)版:2850美元 |
|
编号:ZLC-025
|
发布日期:2015-10 |
附件:下载 |
 |
|
|
 随着养殖技术的提高以及人均水产品消费量的稳步增长,中国渔业产值和水产品产量呈逐年增长趋势。2014年,中国渔业经济总产值达20859亿元,增加值9718亿元;全国水产品总产量达6461.5万吨,同比增长4.7%,其中水产养殖产量达4748.4万吨,同比增长4.6%。 随着养殖技术的提高以及人均水产品消费量的稳步增长,中国渔业产值和水产品产量呈逐年增长趋势。2014年,中国渔业经济总产值达20859亿元,增加值9718亿元;全国水产品总产量达6461.5万吨,同比增长4.7%,其中水产养殖产量达4748.4万吨,同比增长4.6%。
中国水产养殖以淡水养殖为主,其产量占比超过60%。2014年,中国淡水养殖产量达29357.6千吨,产量占比为61.8%;海水养殖产量为18126.5千吨,产量占比为38.2%。淡水养殖以鱼类为主,占淡水养殖总产量比重约88%;而海水养殖以贝类产量最高,占海水养殖总产量的70%以上。
广东、山东、福建、江苏、湖北等地区是中国的主要水产养殖省份,其产量合计占中国水产养殖产量的50%以上。广东是中国水产养殖第一大省,其海水养殖和淡水养殖产量相当;福建、山东以海水养殖为主;江苏和湖北则以淡水养殖为主。
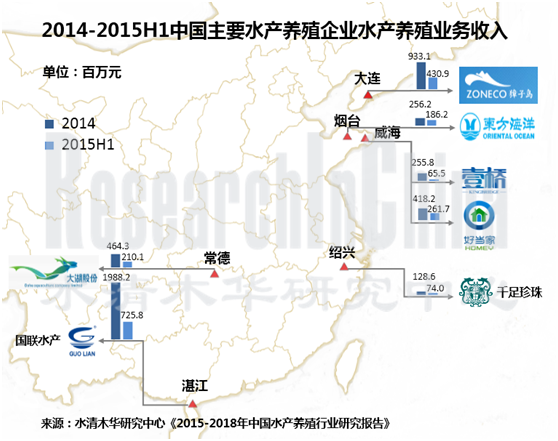
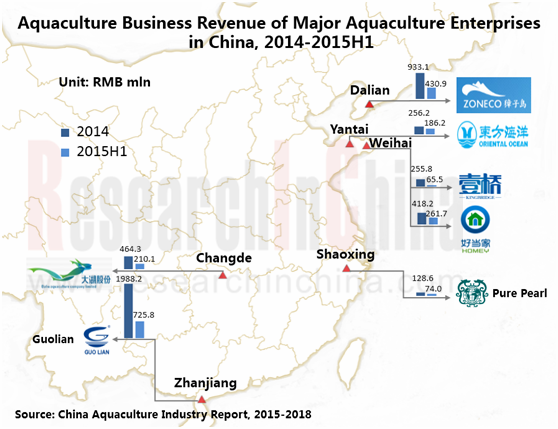
中国水产养殖行业由个体养殖户、合作社和企业构成,其中水产养殖企业在竞争中处于优势地位,但对市场的影响能力有限。中国水产养殖企业主要包括獐子岛、国联水产、壹桥海参、东方海洋、好当家、千足珍珠和大湖股份等。2014年,獐子岛、国联水产和壹桥海参的水产养殖产量合计仅为82.65千吨,占比仅为0.174%。
国联水产是中国国家级南美白对虾遗传育种中心。2014年,公司水产养殖业务收入达19.88亿元,占中国水产养殖市场0.23%的份额。目前,公司正致力于向全球水产销售平台和水产食品制造商转型,并加强国内市场建设和品牌推广。
獐子岛以海洋水产业为主营,拥有中国最大的清洁海域。2014年,公司水产养殖产量达53.43千吨,占同期国内总产量的0.113%。2015年8月,公司发布非公开发行股票预案,拟募集14.5亿元用于种业平台建设项目、O2O新业态建设项目等,以加速推进公司向食品企业转型升级。
大湖股份是全国最大的淡水鱼基地,目前拥有水域面积约180万亩左右,占中国已养殖湖泊和水库面积的4.9%。近两年,公司通过收购增资等方式着力于营销网络体系建设和全面产业链打造。
《2015-2018年中国水产养殖行业研究报告》主要包括以下内容:
中国水产养殖行业发展环境,包括行业政策、居民消费、上下游发展情况等;
中国水产养殖行业发展概况,包括发展现状、海水养殖、淡水养殖、水产苗种、进出口、竞争格局、预测与展望等;
中国主要水产养殖区域(广东、山东、福建、江苏、湖北等)发展概况、中高端水产养殖品(鲍鱼、海参、对虾、罗非鱼等)发展情况等;
中国15家主要水产养殖相关企业的经营情况、发展动态等。
With the improvement of cultivation technology and the steady growth in per-capita consumption of aquatic products, both the output value of Chinese fishery industry and the output of aquatic products keep growing year after year. In 2014, the gross output value of China’s fishing industry amounted to RMB2.0859 trillion, and the added value was up to RMB971.8 billion; the national output of aquatic products totaled 64.615 million tons, a rise of 4.7% from a year earlier, of which the output of aquaculture reported 47.484 million tons, up 4.6% year on year.
Freshwater culture is the main part of aquaculture in China, with its output holding more than 60%. In 2014, the freshwater cultured output reached 29,357.6 kt, accounting for 61.8%; and mariculture output hit 18,126.5 kt, occupying 38.2%. In freshwater aquiculture, fishes are the primary varieties, making up about 88% of total output of freshwater culture; while in mariculture, the shellfishes see the highest output, an above-70% share of total output of seaculture.
The regions like Guangdong, Shandong, Fujian, Jiangsu and Hubei are the key aquaculture provinces in China, with their total output sweeping over 50% of national output. Elaborately, Guangdong is the largest province in terms of aquaculture, with equal output of freshwater culture to that of mariculture; Fujian and Shandong give priority to seaculture; while Jiangsu and Hubei are mainly involved in freshwater breeding.
Chinese aquaculture industry is composed of individual farmers, cooperatives and enterprises, among which aquaculture enterprises are in the advantageous position in competition, but with inadequate power of exerting influence on the market. Chinese aquaculture companies consist mainly of ZONECO Group, Zhanjiang Guolian Aquatic Products Co., Ltd, Dalian Yi Qiao Sea Cucumber Co., Ltd, Shandong Oriental Ocean Sci-Tech Co., Ltd., Shandong Homey Aquatic Development Co., Ltd., Pure Pearl Group Co., Ltd and Dahu Aquaculture Company Limited. In 2014, the total aquaculture output of ZONECO Group, Zhanjiang Guolian Aquatic Products Co., Ltd and Dalian Yi Qiao Sea Cucumber Co., Ltd was merely 82.65 kt, just making up 0.174%.
Zhanjiang Guolian Aquatic Products Co., Ltd is China’s state-level penaeusvannamei genetics & breeding center, with the revenue from aquaculture business in 2014 reaching RMB1.988 billion with a share of 0.23% in Chinese aquaculture market. The company is now endeavoring to transfer to be a global aquatic marketing platform and aquatic food maker; also, it strengthens the domestic market construction and brand promotion.
ZONECO Group is primarily focused on seaculture business, boasting the largest clear seawaters in China. In 2014, the aquaculture output of the company was up to 53.43 kt, sharing 0.113% of national total output in the same period. In August 2015, the company publicized the preplan of non-public offering of shares and planned to raise RMB1.45 billion for fingerling platform construction project, O2O new business model construction project and otherwise, in a bid to accelerate its transition towards a food enterprise.
Dahu Aquaculture Company Limitedis the largest freshwater fish base and in possession of about 1.8 million mu (1mu=1/15 hec.) of water area in China, making up 4.9% of the area of reservoirs and lakes with aquaculture across the country. It has been focusing on the construction of its marketing network and comprehensive industrial chain by means of acquisitions and capital increase over the recent two years.
China Aquaculture Industry Report, 2015-2018 highlights the following:
 Development environment of China aquaculture industry report, involving industrial policy, residents’ consumption, the development of upstream and downstream sectors, etc.; Development environment of China aquaculture industry report, involving industrial policy, residents’ consumption, the development of upstream and downstream sectors, etc.;
Development overview of China aquaculture industry, including status quo, mariculture, freshwater aquaculture, aquatic fingerlings, import & export, competitive landscape, prediction and outlook, etc.;
Development overview of key aquaculture regions (like Guangdong, Shandong, Fujian, Jiangsu and Hubei) in China, and the development of medium- and high-end aquatic products (such as abalone, sea cucumber, prawn, tilapia);
Operation, developments and so forth of 15 Chinese aquaculture companies.
第一章 水产养殖行业概述
1.1 基本概念
1.2 产品类型
1.2.1 常规水产品
1.2.2 名优珍品
1.2.3 出口优势产品
1.3 产业链
第二章 中国水产养殖行业发展环境
2.1 行业政策
2.2 居民消费
2.3 上下游
2.3.1 上游
2.3.2 下游
第三章 中国水产养殖行业发展情况
3.1 发展现状
3.2 海水养殖
3.2.1 概况
3.2.2 地区结构
3.2.3 产品结构
3.2.4 养殖方式
3.3 淡水养殖
3.3.1 概况
3.3.2 地区结构
3.3.3 产品结构
3.3.4 养殖方式
3.4 水产苗种
3.5 进出口
3.6 竞争格局
3.7 预测与展望
3.7.1 水产养殖
3.7.2 水产品消费
第四章 中国主要水产养殖区域发展情况
4.1 福建
4.1.1 概况
4.1.2 水产养殖
4.2 江苏
4.2.1 概况
4.2.2 水产养殖
4.3 山东
4.3.1 概况
4.3.2 水产养殖
4.4 辽宁
4.4.1 概况
4.4.2 水产养殖
4.5 广东
4.5.1 概况
4.5.2 水产养殖
4.6 浙江
4.6.1 概况
4.6.2 水产养殖
4.7 湖北
4.7.1 概况
4.7.2 水产养殖
4.8 湖南
4.8.1 概况
4.8.2 水产养殖
第五章 中国中高端水产养殖品发展情况
5.1 鲍鱼
5.2 海参
5.3 扇贝
5.4 海胆
5.5 海螺
5.6 南美白对虾
5.7 罗非鱼
5.8 珍珠
第六章 主要企业
6.1 大连壹桥海参股份有限公司
6.1.1 公司简介
6.1.2 经营情况
6.1.3 营收构成
6.1.4 毛利率
6.1.5 供销情况
6.1.6 研发与投资
6.1.7 预测与展望
6.2 湛江国联水产开发股份有限公司
6.2.1 公司简介
6.2.2 经营情况
6.2.3 营收构成
6.2.4 毛利率
6.2.5 研发与投资
6.2.6 产销情况
6.2.7 预测与展望
6.3 獐子岛集团股份有限公司
6.3.1 公司简介
6.3.2 经营情况
6.3.3 营收构成
6.3.4 毛利率
6.3.5 研发与投资
6.3.6 产销情况
6.3.7 预测与展望
6.4 山东东方海洋科技股份有限公司
6.4.1 公司简介
6.4.2 经营情况
6.4.3 营收构成
6.4.4 毛利率
6.4.5 研发与投资
6.4.6 预测与展望
6.5 山东好当家海洋发展股份有限公司
6.5.1 公司简介
6.5.2 经营情况
6.5.3 营收构成
6.5.4 毛利率
6.5.5 研发与投资
6.5.6 预测与展望
6.6 千足珍珠集团股份有限公司
6.6.1 公司简介
6.6.2 经营情况
6.6.3 营收构成
6.6.4 毛利率
6.6.5 投资
6.6.6 预测与展望
6.7 大湖水殖股份有限公司
6.7.1 公司简介
6.7.2 经营情况
6.7.3 营收构成
6.7.4 毛利率
6.7.5 投资
6.7.6 预测与展望
6.8 湖北武昌鱼股份有限公司
6.8.1 公司简介
6.8.2 经营情况
6.8.3 水产养殖业务
6.9 广东海大集团股份有限公司
6.9.1 公司简介
6.9.2 经营情况
6.9.3 营收构成
6.9.4 毛利率
6.9.5 研发与投资
6.9.6 产销情况
6.9.7 预测与展望
6.10 百洋水产集团股份有限公司
6.10.1 公司简介
6.10.2 经营情况
6.10.3 营收构成
6.10.4 投资
6.10.5 预测与发展
6.11 宁波天邦股份有限公司
6.11.1 公司简介
6.11.2 经营情况
6.11.3 营收构成
6.11.4 水产饲料业务
6.11.5 预测与发展
6.12 通威股份有限公司
6.12.1 公司简介
6.12.2 经营情况
6.12.3 营收构成
6.12.4 水产饲料业务
6.12.5 预测与展望
6.13 广州陆仕水产企业有限公司
6.13.1 公司简介
6.13.2 经营情况
6.13.3 发展战略
6.14 寻山集团有限公司
6.14.1 公司简介
6.14.2 经营情况
6.14.3 发展战略
6.14.4 科研
6.15 大连新玉麟海洋珍品有限公司
6.15.1 公司简介
6.15.2 经营情况
6.15.3 发展战略
1. Overview of Aquaculture Industry
1.1 Basic Concepts
1.2 Product Types
1.2.1 Regular Aquatic Products
1.2.2 Famous Products
1.2.3 Superior Products for Export
2 Development Environments of China Aquaculture Industry
2.1 Policies
2.2 Consumption of Residents
2.3 Upstream and Downstream
2.3.1 Upstream
2.3.2 Downstream
3 Development of China Aquaculture Industry
3.1 Status Quo
3.2 Mariculture
3.2.1 Overview
3.2.2 Regional Structure
3.2.3 Product Structure
3.2.4 Breeding Mode
3.3 Freshwater Aquaculture
3.3.1 Overview
3.3.2 Regional Structure
3.3.3 Product Structure
3.3.4 Breeding Mode
3.4 Aquatic Fingerlings
3.5 Import and Export
3.6 Competition Pattern
3.7 Anticipation and Prospect
3.7.1 Aquaculture
3.7.2 Consumption of Aquatic Products
4 Main Aquaculture Regions in China
4.1 Fujian
4.1.1 Overview
4.1.2 Aquaculture
4.2 Jiangsu
4.2.1 Overview
4.2.2 Aquaculture
4.3 Shandong
4.3.1 Overview
4.3.2 Aquaculture
4.4 Liaoning
4.4.1 Overview
4.4.2 Aquaculture
4.5 Guangdong
4.5.1 Overview
4.5.2 Aquaculture
4.6 Zhejiang
4.6.1 Overview
4.6.2 Aquaculture
4.7 Hubei
4.7.1 Overview
4.7.2 Aquaculture
4.8 Hunan
4.8.1 Overview
4.8.2 Aquaculture
5 Development of Medium and High-end Aquatic Products In China
5.1 Abalone
5.2 Sea Cucumber
5.3 Scallop
5.4 Urchin
5.5 Conch
5.6 Penaeus Vannamei
5.7 Tilapia
5.8 Pearl
6 Key Enterprises
6.1 Dalian Yi Qiao Sea Cucumber Co., Ltd.
6.1.1 Profile
6.1.2 Operation
6.1.3 Revenue Structure
6.1.4 Gross Margin
6.1.5 Supply and Marketing
6.1.6 R & D and Investment
6.1.7 Anticipation and Prospect
6.2 Zhanjiang Guolian Aquatic Products Co., Ltd.
6.2.1 Profile
6.2.2 Operation
6.2.3 Revenue Structure
6.2.4 Gross Margin
6.2.5 R & D and Investment
6.2.6 Production and Marketing
6.2.7 Anticipation and Prospect
6.3 ZONECO Group
6.3.1 Profile
6.3.2 Operation
6.3.3 Revenue Structure
6.3.4 Gross Margin
6.3.5 R & D and Investment
6.3.6 Production and Marketing
6.3.7 Anticipation and Prospect
6.4 Shandong Oriental Ocean Sci-Tech Co., Ltd.
6.4.1 Profile
6.4.2 Operation
6.4.3 Revenue Structure
6.4.4 Gross Margin
6.4.5 R & D and Investment
6.4.6 Anticipation and Prospect
6.5 Shandong Homey Aquatic Development Co., Ltd.
6.5.1 Profile
6.5.2 Operation
6.5.3 Revenue Structure
6.5.4 Gross Margin
6.5.5 R & D and Investment
6.5.6 Anticipation and Prospect
6.6 Pure Pearl Group Co., Ltd.
6.6.1 Profile
6.6.2 Operation
6.6.3 Revenue Structure
6.6.4 Gross Margin
6.6.5 Investment
6.6.6 Anticipation and Prospect
6.7 Dahu Aquaculture Company Limited
6.7.1 Profile
6.7.2 Operation
6.7.3 Revenue Structure
6.7.4 Gross Margin
6.7.5 Investment
6.7.6 Anticipation and Prospect
6.8 Hubei Wuchangyu Co., Ltd.
6.8.1 Profile
6.8.2 Operation
6.8.3 Aquaculture Business
6.9 Guangdong Haid Group Co., Ltd.
6.9.1 Profile
6.9.2 Operation
6.9.3 Revenue Structure
6.9.4 Gross Margin
6.9.5 R & D and Investment
6.9.6 Production and Marketing
6.9.7 Anticipation and Prospect
6.10 Baiyang Aquatic Group, Inc.
6.10.1 Profile
6.10.2 Operation
6.10.3 Revenue Structure
6.10.4 Investment
6.10.5 Anticipation and Development
6.11 Ningbo Tech-Bank Co., Ltd.
6.11.1 Profile
6.11.2 Operation
6.11.3 Revenue Structure
6.11.4 Aquafeed Business
6.11.5 Anticipation and Development
6.12 Tongwei Group Co., Ltd.
6.12.1 Profile
6.12.2 Operation
6.12.3 Revenue Structure
6.12.4 Aquafeed Business
6.12.5 Anticipation and Prospect
6.13 Guangzhou LUXE Seafood ENT.Ltd.
6.13.1 Profile
6.13.2 Operation
6.13.3 Development Strategy
6.14 Xunshan Group
6.14.1 Profile
6.14.2 Operation
6.14.3 Development Strategy
6.14.4 R & D
6.15 Dalian RainLion Group
6.15.1 Profile
6.15.2 Operation
6.15.3 Development Strategy
图:水产养殖产业链
表:中国水产养殖行业相关政策
图:2006-2014年中国人均水产品占有量
图:2006-2014年中国城镇与农村全年人均水产品购买量
图:2006-2014年中国水产饲料产量
图:2006-2014年中国水产饲料行业产值及增加值
图:2006-2014年中国渔用药物产业产值及增加值
图:2006-2014年中国水产流通业产值及增加值
图:2006-2014年中国水产仓储运输业产值及增加值
图:2006-2014年中国水产加工业产值及增加值
图:2006-2014年中国水产加工量及产能利用率
图:2012-2014年中国渔业经济总产值及增加值
图:2012-2014年中国水产养殖产量及养殖面积
图:2006-2014年中国海水养殖产值及增加值
图:2012-2014年中国海水养殖产量及养殖面积
图:2014年中国海水养殖产量占比(分地区)
图:2007-2014年中国海水养殖产量(分产品)
图:2007-2014年中国海水养殖产量占比(分产品)
图:2012-2014年中国海水养殖面积(分产品)
图:2012-2014年中国海水养殖面积占比(分产品)
图:2007-2014年中国海水养殖产量(按养殖水域)
图:2008-2014年中国海水养殖产量(按养殖方式)
图:2006-2014年中国淡水养殖产值及增加值
图:2012-2014年中国淡水养殖产量及养殖面积
图:2014年中国淡水养殖产量占比(分地区)
图:2007-2014年中国淡水养殖产量(分产品)
图:2007-2014年中国淡水养殖产量占比(分产品)
图:2012-2014年中国淡水养殖面积(按养殖水域)
图:2012-2014年中国淡水养殖面积占比(按养殖水域)
图:2007-2014年中国淡水养殖产量(按养殖水域)
图:2007-2014年中国淡水养殖产量(按养殖方式)
图:2006-2014年中国水产苗种产值及增加值
表:2008-2014年中国海水鱼苗产量(分产品)
表:2008-2014年中国淡水鱼苗产量(分产品)
图:2006-2015年中国水产品进出口量
图:2006-2015年中国水产品进出口额
图:2006-2014年中国水产品进出口均价
表:2014年中国主要水产品出口量及出口金额
表:2014年中国水产品主要出口目的国家地区出口量及出口金额
表:2014年中国水产品主要出口来源省份出口量及出口金额
表:2013-2014年中国主要水产养殖企业水产品产量及产量占比
表:2014年中国水产养殖行业主要企业水产养殖业务收入及市场份额
图:2012-2018E中国海水养殖产量及养殖面积
图:2012-2018E中国淡水养殖产量及养殖面积
图:2014-2018E中国水产品人均占有量及消费量
图:2008-2014年福建省水产养殖产量(按养殖方式)
图:2014年福建省海水养殖产量占比(按养殖方式)
图:2014年福建省淡水养殖产量占比(按养殖方式)
图:2008-2014年江苏省水产养殖产量(按养殖方式)
图:2014年江苏省海水养殖产量占比(按养殖方式)
图:2014年江苏省淡水养殖产量占比(按养殖方式)
图:2008-2014年山东省水产养殖产量(按养殖方式)
图:2014年山东省海水养殖产量占比(按养殖方式)
图:2014年山东省淡水养殖产量占比(按养殖方式)
图:2008-2014年辽宁省水产养殖产量(按养殖方式)
图:2014年辽宁省海水养殖产量占比(按养殖方式)
图:2014年辽宁省淡水养殖产量占比(按养殖方式)
图:2008-2014年广东省水产养殖产量(按养殖方式)
图:2014年广东省海水养殖产量占比(按养殖方式)
图:2014年广东省淡水养殖产量占比(按养殖方式)
图:2008-2014年浙江省水产养殖产量(按养殖方式)
图:2014年浙江省海水养殖产量占比(按养殖方式)
图:2014年浙江省淡水养殖产量占比(按养殖方式)
图:2008-2014年湖北省水产养殖产量
图:2014年湖北省淡水养殖产量占比(按养殖方式)
图:2008-2014年湖南省水产养殖产量
图:2014年湖南省淡水养殖产量占比(按养殖方式)
图:2006-2014年中国养殖鲍鱼产量
图:2014-2015年威海市水产品批发市场鲍鱼价格走势
图:2006-2014年中国养殖海参产量
图:2014-2015年威海市水产品批发市场海参价格走势
图:2006-2014年中国养殖扇贝产量
图:2014-2015年北京丰台区新发地农产品批发市场扇贝价格走势
图:2006-2014年中国养殖海胆产量
图:2006-2014年中国养殖海螺产量
图:2006-2014年中国养殖南美白对虾产量
图:2006-2014年中国养殖南美白对虾产量占比(按养殖方式)
图:2006-2014年中国养殖罗非鱼产量
图:2014-2015年北京丰台区新发地农产品批发市场罗非鱼价格走势
图:2006-2014年中国养殖珍珠产量
图:2006-2014年中国淡水养殖珍珠产量
图:2010-2015年壹桥海参营业收入及净利润
图:2010-2014年壹桥海参营业收入(分业务)
图:2010-2014年壹桥海参营业收入构成(分业务)
图:2010-2014年壹桥海参营业收入(分地区)
图:2010-2014年壹桥海参营业收入构成(分地区)
图:2010-2015年壹桥海参毛利率
图:2010-2015年壹桥海参毛利率(分产品)
图:2010-2015年壹桥海参毛利率(分地区)
图:2012-2014年壹桥海参前五名供应商采购金额及占采购总额比重
图:2012-2014年壹桥海参前五名客户销售额及占销售总额比重
表:2013-2014年壹桥海参产销量及库存量
图:2012-2014年壹桥海参研发支出及占总营收比重
图:2014-2018E壹桥海参营业收入及净利润
图:2010-2015年国联水产营业收入及净利润
图:2010-2015年国联水产营业收入(分产品)
图:2010-2015年国联水产营业收入构成(分产品)
图:2010-2014年国联水产营业收入(分地区)
图:2010-2014年国联水产营业收入构成(分地区)
图:2010-2015年国联水产毛利率
图:2010-2015年国联水产毛利率(分产品)
图:2013-2014年国联水产毛利率(分地区)
图:2012-2014年国联水产研发支出及占总营收比重
表:2013-2014年国联水产产销量及库存量
图:2014-2018E国联水产营业收入及净利润
图:2010-2015年獐子岛营业收入及净利润
图:2010-2015年獐子岛营业收入(分产品)
图:2010-2015年獐子岛营业收入构成(分产品)
图:2010-2015年獐子岛营业收入(分地区)
图:2010-2015年獐子岛营业收入构成(分地区)
图:2010-2015獐子岛毛利率
图:2011-2014年獐子岛研发支出及占总营收比重
表:2015年獐子岛非公开发行股票预案募投项目
表:2013-2014年獐子岛产销量及库存量
图:2014-2018E獐子岛营业收入及净利润
图:2010-2015年东方海洋营业收入及净利润
图:2011-2015年东方海洋营业收入(分业务)
图:2011-2015年东方海洋营业收入构成(分业务)
图:2010-2015年东方海洋营业收入(分地区)
图:2010-2015年东方海洋营业收入构成(分地区)
图:2010-2015年东方海洋毛利率
图:2011-2015年东方海洋毛利率(分业务)
图:2010-2015年东方海洋毛利率(分地区)
图:2014-2018E东方海洋营业收入及净利润
图:2011-2015年好当家营业收入及净利润
图:2012-2015年好当家营业收入(分业务)
图:2012-2015年好当家营业收入构成(分业务)
图:2012-2015年好当家营业收入(分地区)
图:2012-2015年好当家营业收入构成(分地区)
图:2011-2015年好当家毛利率
图:2012-2015年好当家毛利率(分业务)
图:2012-2014年好当家研发支出及占总营收比重
图:2014-2018年好当家营业收入及净利润
图:2011-2015年千足珍珠营业收入及净利润
图:2011-2015年千足珍珠营业收入(分产品)
图:2011-2015年千足珍珠营业收入构成(分产品)
图:2011-2015千足珍珠营业收入(分地区)
图:2011-2015年千足珍珠营业收入构成(分地区)
图:2011-2015年千足珍珠毛利率
图:2011-2015年千足珍珠毛利率(分产品)
图:2012-2015年千足珍珠毛利率(分地址)
图:2014-2018年千足珍珠营业收入及净利润
图:2011-2015年大湖股份营业收入及净利润
图:2012-2015年大湖股份营业收入(分产品)
图:2012-2015年大湖股份营业收入构成(分产品)
图:2012-2015年大湖股份营业收入(分地区)
图:2012-2015年大湖股份营业收入构成(分地区)
图:2011-2015年大湖股份毛利率
图:2012-2015年大湖股份毛利率(分产品)
图:2014-2018E大湖股份营业收入及净利润
图:2011-2015年武昌鱼营业收入及净利润
表:2009-2015年武昌鱼营业收入(分产业)
图:2009-2015年海大集团营业收入及净利润
图:2009-2015年海大集团营业收入(分产品)
图:2009-2015年海大集团营业收入构成(分产品)
图:2009-2015年海大集团营业收入(分地区)
图:2009-2015年海大集团营业收入构成(分地区)
图:2012-2015年海大集团毛利率(分产品)
图:2012-2015年海大集团毛利率(分地区)
图:2012-2014年海大集团研发支出及占总营收比重
表:2013-2014年海大集团产销量及库存量
图:2014-2018E海大集团营业收入及净利润
图:2009-2015年百洋股份营业收入及净利润
图:2014年百洋股份营业收入构成(分产品)
图:2009-2015年百洋股份营业收入(分地区)
图:2009-2015年百洋股份营业收入构成(分地区)
图:2014-2018E百洋股份营业收入及净利润
图:2009-2015年天邦股份营业收入及净利润
图:2009-2015年天邦股份营业收入(分地区)
图:2009-2015年天邦股份营业收入构成(分地区)
图:2009-2015年天邦股份营业收入(分产品)
图:2009-2015年天邦股份营业收入构成(分产品)
表:天邦股份水产养殖业相关专利
图:2012-2015年天邦股份饲料产品销量及同比增长率
图:2014-2018E天邦股份营业收入及净利润
图:2009-2015年通威股份营业收入及净利润
图:2009-2015年通威股份营业收入(分产品)
图:2009-2015年通威股份营业收入构成(分产品)
图:2009-2015年通威股份营业收入(分地区)
图:2009-2015年通威股份营业收入构成(分地区)
图:2010-2014年通威股份饲料及水产饲料销量
图:2014-2018E通威股份营业收入及净利润
表:大连新玉麟五大生产基地
Aquaculture Industry Chain
Policies about Aquaculture Industry in China
Per-capita Ownership of Aquatic Products in China, 2006-2014
Per-capita Full-year Purchased Volume of Aquatic Products by Urban and Rural Chinese, 2006-2014
China’s Aquafeed Output, 2006-2014
Output Value and Added Value of China Aquafeed Industry, 2006-2014
Output Value and Added Value of China Fishery Drug Industry, 2006-2014
Output Value and Added Value of China Aquatic Product Circulation Industry, 2006-2014
Output Value and Added Value of China Aquatic Product Warehouse and Transportation Industry, 2006-2014
Output Value and Added Value of China Aquatic Product Processing Industry, 2006-2014
China’s Processing Quantity of Aquatic Products and Capacity Utilization, 2006-2014
China's Fishery Output Value and Added Value, 2012- 2014
China's Aquaculture Output and Breeding Area, 2012- 2014
China's Mariculture Output Value and Added Value, 2006- 2014
China's Mariculture Output and Breeding Area, 2012- 2014
China's Mariculture Output Share (by Region), 2014
China's Mariculture Output (by Product), 2007- 2014
Output Share of China's Mariculture (by Product), 2007- 2014
China's Mariculture Area (by Product), 2012- 2014
China's Mariculture Area Structure (by Product), 2012- 2014
China's Mariculture Output (by Breeding Waters), 2007- 2014
China's Mariculture Output (by Breeding Mode), 2008- 2014
China's Freshwater Aquaculture Output Value and Added Value, 2006- 2014
China's Freshwater Aquaculture Output and Breeding Area, 2012- 2014
Output Share of China's Freshwater Aquaculture (by Region), 2014
China's Freshwater Aquaculture Output (by Product), 2007- 2014
Output Share of China's Freshwater Aquaculture (by Product), 2007- 2014
China's Freshwater Breeding Area (by Breeding Waters), 2012- 2014
China's Freshwater Breeding Area Structure (by Breeding Waters), 2012- 2014
China's Freshwater Aquaculture Output (by Breeding Waters), 2007- 2014
China's Freshwater Aquaculture Output (by Breeding Mode), 2007- 2014
Output Value and Added Value of Chinese Aquatic Fingerlings, 2006- 2014
Output of Chinese Seawater Fingerlings (by Product), 2008- 2014
Output of Chinese Freshwater Fingerlings (by Product), 2008- 2014
Import and Export Volume of Aquatic Products in China, 2006- 2015
Import and Export Value of Aquatic Products in China, 2006-2015
Average Import and Export Price of Aquatic Products in China, 2006-2014
Export Volume and Value of Main Aquatic Products in China, 2014
Major Export Destinations of Main Aquatic Products in China by Export Volume and Value, 2014
Major Exporting Provinces of Main Aquatic Products in China by Export Volume and Value, 2014
Aquatic Product Output and Share of Major Aquaculture Enterprises in China, 2013- 2014
Aquaculture Revenue and Market Share of Major Aquaculture Enterprises in China, 2014
China's Mariculture Output and Breeding Area, 2012-2018E
China's Freshwater Aquaculture Output and Breeding Area, 2012-2018E
Per Capita Ownership and Consumption of Aquatic Products in China, 2014-2018E
Fujian's Aquaculture Output (by Breeding Mode), 2008- 2014
Output Share of Fujian's Mariculture (by Breeding Mode), 2014
Output Share of Fujian's Freshwater Aquaculture (by Breeding Mode), 2014
Jiangsu's Aquaculture Output (by Breeding Mode), 2008- 2014
Output Share of Jiangsu's Mariculture (by Breeding Mode), 2014
Output Share of Jiangsu's Freshwater Aquaculture (by Breeding Mode), 2014
Shandong's Aquaculture Output (by Breeding Mode), 2008- 2014
Output Share of Shandong's Mariculture (by Breeding Mode), 2014
Output Share of Shandong's Freshwater Aquaculture (by Breeding Mode), 2014
Liaoning's Aquaculture Output (by Breeding Mode), 2008- 2014
Output Share of Liaoning's Mariculture (by Breeding Mode), 2014
Output Share of Liaoning's Freshwater Aquaculture (by Breeding Mode), 2014
Guangdong's Aquaculture Output (by Breeding Mode), 2008- 2014
Output Share of Guangdong's Mariculture (by Breeding Mode), 2014
Output Share of Guangdong's Freshwater Aquaculture (by Breeding Mode), 2014
Zhejiang's Aquaculture Output (by Breeding Mode), 2008- 2014
Output Share of Zhejiang's Mariculture (by Breeding Mode), 2014
Output Share of Zhejiang's Freshwater Aquaculture (by Breeding Mode), 2014
Hubei's Aquaculture Output, 2008- 2014
Output Share of Hubei's Freshwater Aquaculture (by Breeding Mode), 2014
Hunan's Aquaculture Output, 2008- 2014
Output Share of Hunan's Freshwater Aquaculture (by Breeding Mode), 2014
China's Cultured Abalone Output, 2006-2014
Abalone Price in Weihai Aquatic Product Wholesale Market, 2014-2015
China's Cultured Sea Cucumber Output, 2006-2014
Sea Cucumber Price in Weihai Aquatic Product Wholesale Market, 2014-2015
China's Cultured Scallop Output, 2006-2014
Scallop Price in Beijing Fengtai District Xinfadi Agricultural Product Wholesale Market, 2014-2015
China's Cultured Sea Urchin Output, 2006-2014
China's Cultured Conch Output, 2006-2014
China's Cultured Penaeus Vannamei Output, 2006-2014
Output Share of China's Cultured Penaeus Vannamei (by Breeding Mode), 2006-2014
China's cultured tilapia Output, 2006-2014
Tilapia Price in Beijing Fengtai District Xinfadi Agricultural Product Wholesale Market, 2014-2015
China's Cultured Pearl Output, 2006-2014
China's Freshwater Cultured Pearl Output, 2006-2014
Revenue and Net Income of Yi Qiao Sea Cucumber, 2010-2015
Revenue of Yi Qiao Sea Cucumber (by Business), 2010-2014
Revenue Structure of Yi Qiao Sea Cucumber (by Business), 2010-2014
Revenue of Yi Qiao Sea Cucumber (by Region), 2010-2014
Revenue Structure of Yi Qiao Sea Cucumber (by Region), 2010-2014
Gross Margin of Yi Qiao Sea Cucumber, 2010-2015
Gross Margin of Yi Qiao Sea Cucumber (by Product), 2010-2015
Gross Margin of Yi Qiao Sea Cucumber (by Region), 2010-2015
Procurement from Top 5 Suppliers and% of Total Procurement of Yi Qiao Sea Cucumber, 2012-2014
Revenue from Top 5 Clients and % of Total Revenue of Yi Qiao Sea Cucumber, 2012-2014
Output, Sales Volume and Inventory of Yi Qiao Sea Cucumber, 2013-2014
R & D Costs and % of Total Revenue of Yi Qiao Sea Cucumber, 2012-2014
Revenue and Net Income of Yi Qiao Sea Cucumber, 2014-2018E
Revenue and Net Income of Guolian Aquatic Products, 2010-2015
Revenue of Guolian Aquatic Products (by Product), 2010-2015
Revenue Structure of Guolian Aquatic Products (by Product), 2010-2015
Revenue of Guolian Aquatic Products (by Region), 2010-2014
Revenue Structure of Guolian Aquatic Products (by Region), 2010-2014
Gross Margin of Guolian Aquatic Products, 2010-2015
Gross Margin of Guolian Aquatic Products (by Product), 2010-2015
Gross Margin of Guolian Aquatic Products (by Region), 2013-2014
R & D Costs and % of Total Revenue Inventory of Guolian Aquatic Products, 2012-2014
Output, Sales Volume and Inventory of Guolian Aquatic Products, 2013- 2014
Revenue and Net Income Inventory of Guolian Aquatic Products, 2014-2018E
Revenue and Net Income of ZONECO Group, 2010-2015
Revenue of ZONECO Group (by Product), 2010-2015
Revenue Structure of ZONECO Group (by Product), 2010-2015
Revenue of ZONECO Group (by Region), 2010-2015
Revenue Structure of ZONECO Group (by Region), 2010-2015
Gross Margin of ZONECO Group, 2010-2015
R & D Costs and % of Total Revenue of ZONECO Group, 2011-2014
Investment Projects Funded by Non-public Offering Plan of ZONECO Group, 2015
Output, Sales Volume and Inventory of ZONECO Group, 2013-2014
Revenue and Net Income of ZONECO Group, 2014-2018E
Revenue and Net Income of Oriental Ocean Sci-Tech, 2010-2015
Revenue of Oriental Ocean Sci-Tech (by Business), 2011-2015
Revenue Structure of Oriental Ocean Sci-Tech (by Business), 2011-2015
Revenue of Oriental Ocean Sci-Tech (by Region), 2010-2015
Revenue Structure of Oriental Ocean Sci-Tech (by Region), 2010-2015
Gross Margin of Oriental Ocean Sci-Tech, 2010-2015
Gross Margin of Oriental Ocean Sci-Tech (by Business), 2011-2015
Gross Margin of Oriental Ocean Sci-Tech (by Region), 2010-2015
Revenue and Net Income of Oriental Ocean Sci-Tech, 2014-2018E
Revenue and Net Income of Homey Aquatic Development, 2011-2015
Revenue of Homey Aquatic Development (by Business), 2012-2015
Revenue Structure of Homey Aquatic Development (by Business), 2012-2015
Revenue of Homey Aquatic Development (by Region), 2012-2015
Revenue Structure of Homey Aquatic Development (by Region), 2012- 2015
Gross Margin of Homey Aquatic Development, 2011- 2015
Gross Margin of Homey Aquatic Development (by Business), 2012-2015
R & D Costs and % of Total Revenue of Homey Aquatic Development, 2012-2014
Revenue and Net Income of Homey Aquatic Development, 2014-2018E
Revenue and Net Income of Pure Pearl, 2011- 2015
Revenue of Pure Pearl (by Product), 2011-2015
Revenue Structure of Pure Pearl (by Product), 2011-2015
Revenue of Pure Pearl (by Region), 2011-2015
Revenue Structure of Pure Pearl (by Region), 2011-2015
Gross Margin of Pure Pearl, 2011-2015
Gross Margin of Pure Pearl (by Product), 2011-2015
Gross Margin of Pure Pearl (by Region), 2012- 2015
Revenue and Net Income of Pure Pearl, 2014-2018E
Revenue and Net Income of Dahu Aquaculture, 2011-2015
Revenue of Dahu Aquaculture (by Product), 2012-2015
Revenue Structure of Dahu Aquaculture (by Product), 2012-2015
Revenue of Dahu Aquaculture (by Region), 2012- 2015
Revenue Structure of Dahu Aquaculture (by Region), 2012-2015
Gross Margin of Dahu Aquaculture, 2011- 2015
Gross Margin of Dahu Aquaculture (by Product), 2012- 2015
Revenue and Net Income of Dahu Aquaculture, 2014-2018E
Wuchangyu's Revenue and Net Income, 2011- 2015
Wuchangyu's Revenue (by Industry), 2009- 2015
Haid's Revenue and Net Income, 2009- 2015
Haid's Revenue (by Product), 2009- 2015
Haid's Revenue Structure (by Product), 2009- 2015
Haid's Revenue (by Region), 2009- 2015
Haid's Revenue Structure (by Region), 2009- 2015
Haid's Gross Margin (by Product), 2012- 2015
Haid's Gross Margin (by Region), 2012- 2015
Haid's R & D Costs and % of Total Revenue, 2012- 2014
Haid's Output, Sales Volume and Inventory, 2013- 2014
Haid's Revenue and Net Income, 2014-2018E
Baiyang's Revenue and Net Income, 2009- 2015
Baiyang's Revenue Structure (by Product), 2014
Baiyang's Revenue (by Region), 2009- 2015
Baiyang's Revenue Structure (by Region), 2009- 2015
Baiyang Revenue and Net Income, 2014-2018E
Tech-Bank's Revenue and Net Income, 2009- 2015
Tech-Bank's Revenue (by Region), 2009- 2015
Tech-Bank's Revenue Structure (by Region), 2009- 2015
Tech-Bank's Revenue (by Product), 2009- 2015
Tech-Bank's Revenue Structure (by Product), 2009- 2015
Tech-Bank's Aquaculture-related Patents
Tech-Bank's Feedstuff Sales Volume and YoY Growth Rate, 2012- 2015
Tech-Bank's Revenue and Net Income, 2014-2018E
Tongwei's Revenue and Net Income, 2009- 2015
Tongwei's Revenue (by Product), 2009- 2015
Tongwei's Revenue Structure (by Product), 2009- 2015
Tongwei's Revenue (by Region), 2009- 2015
Tongwei's Revenue Structure (by Region), 2009- 2015
Tongwei's Sales Volume of Feedstuff and Aquafeeds, 2010- 2014
Tongwei's Revenue and Net Income, 2014-2018E
Five Production Bases of Dalian RainLion
如果这份报告不能满足您的要求,我们还可以为您定制报告,请 留言说明您的详细需求。
|