|
|
|
报告导航:研究报告—
TMT产业—电子半导体
|
|
2014-2015年全球及中国汽车PCB产业研究报告 |
 |
字数:1.9万 |
页数:118 |
图表数:150 |
|
中文电子版:8500元 |
中文纸版:4250元 |
中文(电子+纸)版:9000元 |
|
英文电子版:2400美元 |
英文纸版:2600美元 |
英文(电子+纸)版:2700美元 |
|
编号:ZYW219
|
发布日期:2015-10 |
附件:下载 |
 |
|
|
《2014-2015年全球及中国汽车PCB产业研究报告》包含以下内容:
1、全球与中国汽车市场与产业分析
2、汽车PCB下游市场
3、汽车PCB产业与市场
4、19家汽车PCB厂家研究
2014年汽车PCB市场规模大约49.6亿美元,预计2015年成长6.5%,达到52.8亿美元,而2014年PCB整体市场规模大约596亿美元,预计2015年成长0.8%,汽车PCB是PCB行业增长最迅速的领域。这种势头最少可以保持到2019年。
汽车PCB领域 ,Powertrain所占比例最高,目前大约为32%,主要包括Engine Control Unit、Starter、Alternator、Transmission Control、Fuel Injection、Power Steering。对于xEV来说,其Inverter、Converter复杂且高压高电流高温,对PCB要求极高,Powertrain所占整体比例会超过50%。其次是Body部分,主要是Lighting、HVAC、Power Door&Seat、Keyless、TPMS,大约占25%,目前LED照明比例高,而Led照明对PCB要求高,一般都是MCPCB(Metal Core PCB)。再次是Safety系统,主要包括ADAS、ABS、Airbag,大约占22%。最后是Cockpit系统,主要包括Instrument Display、Infotainment。
汽车PCB对可靠性要求极高,这是其最大的门槛,其次是汽车行业有召回制度,厂家需要承担产品出错的风险,规模小的厂家无力承担,因此被排除在外。汽车PCB的挑战包括高可靠性、高温、高频、高电流。
汽车引擎与变速箱部位的PCB需要承受150度以上高温,通常必须采用陶瓷基板,陶瓷多层板基材主要成分是氧化铝(Al2 O3)和氮化铝(AlN)。高温共烧陶瓷印制板(HTCC)烧结时温度一般在1600℃以上,所用导体也是高熔点的钨或钼,它们可同时烧合。日本Murata则提出LTCC,目前应用尚不多。陶瓷基板大多由日本KYOCERA和美国Rogers提供。欧美汽车厂家的PCB大多由德国Schweizer、Duwel、Wurth和美国TTM提供。日本主要由CMK、Meiko提供。
汽车Safety系统则多采用MCPCB(Metal Core PCB)。尤其是ABS。汽车ADAS需要使用大量的雷达,2014年雷达的出货量仅1900万套,预计2020年可达9600万套,这就需要高频PCB。这种PCB通常需要PTFE填充陶瓷,对RF领域非常有经验的厂家才能完成,主要是欧美和日本厂家。xEV目前发展迅速,尤其大众检测作弊事件爆发后。
Cockpit用PCB主要由台湾厂家包揽,未来Infotainment其复杂性大大提高,且屏幕尺寸也越来越大,可能需要使用HDI,并且汽车显示屏数量大增,宝马7系列每辆车内部使用多达7块显示屏。这都使得市场发展强劲。
Global and China Automotive PCB Industry Report, 2014-2015 highlights the followings:
1. Global and China’s automobile market and industry
2. Downstream market of automotive PCB
3. Automotive PCB Industry and Market
4. 19 Automotive PCB companies
Global automotive PCB market size was around USD4.96 billion in 2014, and is expected to grow by 6.5% to USD5.28 billion in 2015, compared with an overall global PCB market scale of roughly USD59.6 billion in 2014 and an estimated growth of 0.8% in 2015. Automotive PCB is the fastest-growing field in PCB industry, and will sustain the momentum until at least 2019.
In automotive PCB field, powertrain holds the largest proportion, about 32% for the time being, including mainly Engine Control Unit, Starter, Alternator, Transmission Control, Fuel Injection, and Power Steering. For xEV, complexity, high voltage, high current and high temperature of Inverter and Converter pose extremely high requirements on PCB. Powertrain seizes over 50%, followed by Body with about 25% (primarily Lighting, HVAC, Power Door & Seat, Keyless, and TPMS). LED lighting, which enjoys a high share, is highly demanding on PCB, usually adopting MCPCB (Metal Core PCB). Thirdly, Safety systems, consisting mainly of ADAS, ABS, and Airbag, make up about 22%. The last is Cockpit systems, mainly covering Instrument Display and Infotainment.
Automotive PCB has exceedingly high requirement on reliability, creating the biggest threshold. Recall system in automobile industry requires makers to take risks of faulty products. As small makers cannot afford this, they are usually ruled out. Challenges for automotive PCB include reliability, high temperature, high frequency, and high current.
PCBs in automotive engine and gearbox need to withstand high temperature above 150℃, so ceramic substrates must be used, for ceramic multi-layer substrate contains mainly alumina (Al2O3) and aluminum nitride (AlN). High temperature co-fired ceramic (HTCC) PCB is usually sintered at temperature of over 1600℃, and the conductor is high-melting point tungsten or molybdenum, which can be sintered together at the same time. Japanese Murata puts forward low temperature co-fired ceramic (LTCC), which finds few applications. Ceramic substrates are mostly supplied by Japanese KYOCERA and U.S. Rogers. PCBs used by European and U.S. carmakers are largely provided by German Schweizer, Duwel, and Wurth, and U.S. TTM. Japanese carmakers are mainly served by CMK and Meiko.
Automotive safety systems, especially ABS, generally adopt MCPCB (Metal Core PCB). Automotive ADAS needs to use a large quantity of radar which finds shipment of 19 million sets in 2014 and is expected to reach 96 million sets in 2020. In this case, high-frequency PCB will be employed. The PCB usually needs PTFE ceramic and can only be done by the companies (mainly from U.S. Europe and Japan) that are very experienced in RF. xEV is developing rapidly, especially after the outbreak of scandal over VW cheating pollution emissions tests.
Supply of cockpit PCBs are almost taken on by Taiwanese companies. HDI may be needed, as Infotainment becomes more complicated and the size of screen larger. Moreover, the number of automotive displays used also increases, like BMW 7 series using up to 7 displays for each vehicle. All these factors fuel a robust market.
第一章、全球与中国汽车市场
1.1、全球汽车市场
1.2、中国汽车市场概况
1.3、中国汽车市场近况
第二章、汽车PCB下游市场
2.1、ECU市场
2.2、汽车显示市场
2.3、汽车Infotainmnet市场规模
2.4、Automotive ADAS
2.5、Automotive Radar Market
第三章、汽车PCB产业与市场
3.1、PCB产业概况
3.2、中国PCB产业概况
3.3、汽车PCB市场规模
3.4、引擎与Powertrain PCB
3.5、金属基板PCB
3.6、高频PCB
3.7、Heavy Copper PCB
3.8、xEV里的电子系统
3.9、汽车PCB厂家排名
第四章、汽车PCB厂家研究
4.1、CMK
4.2、TTM
4.3、惠亚
4.4、敬鹏
4.5、Schweizer
4.6、NOK
4.6.1、珠海紫翔电子科技有限公司
4.6.2、苏州紫翔电子科技有限公司
4.7、建滔化工
4.7.1、依利安达
4.7.2、科惠线路板
4.7.3、扬宣电子
4.8、良达科技
4.9、Kyoden
4.10、Shirai
4.11、耀华
4.12、依顿电子
4.13、沪士电子
4.14、KCE
4.15、ELNA
4.16、健鼎
4.17、3CEMS
4.18、AT&S
4.19、Meiko
1 Global and Chinese Automobile Market
1.1 Global Automotive Market
1.2 Overview of Chinese Automotive Market
1.3 Recent Developments of Chinese Automotive Market
2 Downstream Market of Automotive PCB
2.1 ECU
2.2 Automotive Display
2.3 Automotive Infotainment
2.4 Automotive ADAS
2.5 Automotive Radar
3 Automotive PCB Industry and Market
3.1 Overview of PCB Industry
3.2 Overview of China’s PCB Industry
3.3 Automotive PCB Market Size
3.4 Engine and Powertrain PCB
3.5 Metal Core PCB (MCPCB)
3.6 High Frequency PCB
3.7 Heavy Copper PCB
3.8 Electronic Systems in xEV
3.9 Ranking of Automotive PCB Companies
4 Automotive PCB Companies
4.1 CMK
4.2 TTM
4.3 Viasystems
4.4 Chin Poon Industrial
4.5 Schweizer
4.6 NOK
4.6.1 MEKTEC (Zhuhai)
4.6.2 MEKTEC (Suzhou)
4.7 Kingboard Chemical
4.7.1 Elec & Eltek
4.7.2 Techwise Circuits
4.7.3 Express Electronics
4.8 Liang Dar Technology
4.9 Kyoden
4.10 Shirai
4.11 Unitech Printed Circuit Board
4.12 Guangdong Ellington Electronics Technology
4.13 WUS Printed Circuit
4.14 KCE
4.15 ELNA
4.16 Tripod Technology
4.17 3CEMS
4.18 AT&S
4.19 Meiko
2010-2015年全球汽车销量
2003-2015年全球LightVehicles 产量地域分布
2005-2015年中国汽车销量
2005-2014年中国各类型汽车年产量同比增幅
2013-2018年汽车ECU市场规模
2014-2019年汽车ECU出货量
2015年Automotive ECU Supplier Market Share
2013-2019年全球汽车显示市场规模(出货量)
2013-2019年全球汽车显示市场规模(金额)
2015-2019年 Automotive Display Shipments Breakdown by Application
2011-2018年全球汽车Infotainment(广义)市场规模
2013-2020年全球Infotainment出货量
ADAS 结构示意图
ADAS发展时间表
2001-2016 全球PCB产业产值
2013、2014、2019年 GEOGRAPHIC MIGRATION OF PCB PRODUCTION
2012-2015年全球PCB产业收入地域分布(按企业总部所在地)
2013-2014年中国前26PCB厂商
Chinese PCB Companies Production Value by Layer,2013-2014
Chinese PCB Companies Production Volume by Layer,2013-2014
2011-2019年全球汽车PCB市场规模
2015、2020 Automotive PCB Market by Position
Delphi Ceramic Substrate ECU
2015 Metal PCB by Technology
Four Layer MCPCB Construction
高频PCB与普通PCB对比
24GHz Radar PCB
77GHz Radar PCB
Schweizer Heavy Copper PCB
Heavy Copper PCB Trend
xEV里的Power Electronics构成
Honda Accord Hybrid Main Board
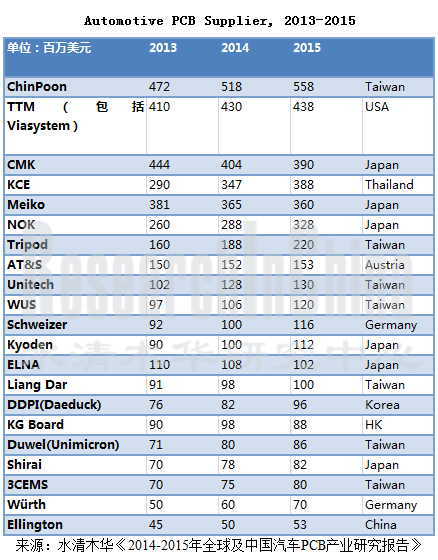
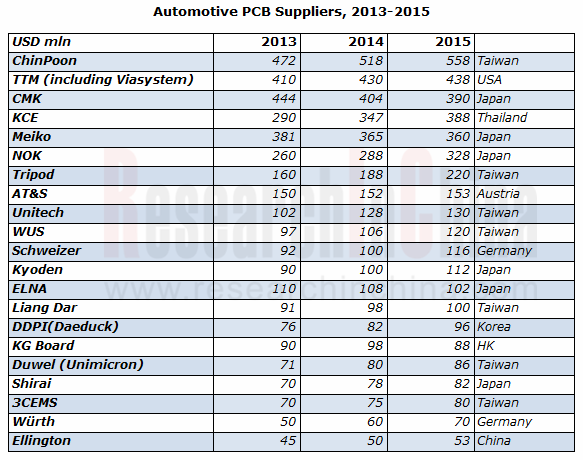
2013-2015年汽车PCB供应商收入排名
2005-2016财年CMK收入与运营利润率
2007-2015财年CMK收入下游应用分布
2007-2015财年 CMK收入by layer
2007-2014财年 CMK收入地域分布
2005-2014年TTM收入与运营利润率
TTM +Viasystems 收入下游分布
2013年1季度-2015年2季度TTM季度收入地域分布
2013年1季度-2015年2季度TTM季度收入与毛利率
2014年TTM客户分布
2014年TTM Revenues by technology
2008-2014年TTM收入下游应用分布
TTM全球工厂分布
2006-2014年惠亚收入与运营利润率
2008-2014年惠亚收入业务分布
惠亚全球分布
2008-2014惠亚集团收入下游应用分布
2008-2014惠亚主要客户
惠亚主要客户
2012-2014年惠亚集团Net sales by country of destination
2012-2014年惠亚集团Net sales by country of manufacture
DDI收入地域和终端市场分布
DDI工厂分布
DDI主要客户
2005-2015年敬鹏收入与毛利率
2005-2015年敬鹏收入与营业利润率
2013年8月-2015年8月敬鹏每月收入与增幅
2012-2014年敬鹏销售地域分布
Schweizer Shareholder Structure
2010-2015年Schweizer Turnover and EBIT Margin
2010-2014年Schweizer净利润
2013-2014年Schweizer现金流及流动资金
2013-2014 Schweizer Balance Structure
Q1/2014-Q1/2015 Schweizer Order take
2011-2015 Schweizer sales by application
2011-2015 Schweizer sales by region
Mektron组织结构
FY2006-FY2016 NOK Revenue and Operation Margin
2013-2015年NOK按行业收入
2013-2015 NOK Capital by region
2013-2015 NOK Depreciation by region
2013-2014 NOK FPC(Electric Devices) Segment Profit Bridge
2014-2015 NOK FPC(Electric Devices) Segment Profit Bridge
2006-2015财年NOK收入产品分布
2013-2015财年NOK营业利润产品分布
2010-2014财年NOK收入地域分布
2010-2014财年MEKTRON FPC事业部收入地域分布
Mektron全球分布
2004-2014年珠海紫翔电子科技有限公司收入与运营利润
建滔集团组织结构
2002-2015年建滔集团收入与股东应占利润率
2008-2015年建滔集团收入业务分布
依利安达组织结构
2005-2015年依利安达收入与运营利润率
2010-2014年依利安达资产负债表
2006-2014年依利安达收入地域分布
2014 依利安达收入by Application
2006-2013年依利安达收入技术分布by layer
依利安达各厂产能
依利安达技术能力
2009-2013年Express Electronics东莞厂收入
2009-2013年Express Electronics苏州厂收入
Liang Dar Organization
FY2011-FY2016 Kyoden 销售额与营业利润
FY2011-FY2015 Kyoden总资产
FY2011-FY2015 Kyoden Capital and R&D
FY2012-2016 Kyoden收入地域分布
FY2011-FY2016 Shirai收入与营业利润
FY2011-FY2015Shirai收入by Technology
FY2011-FY2015Shirai收入by Application
2006-2014年耀华收入与毛利率
2009-2015年耀华收入与营业利润率
2013年8月-2015年8月耀华每月收入与增幅
硬板技术路线图
软硬板技术路线图
上海展华电子2010、2013 财务数据
依顿电子股权结构
2007-2015年依顿电子收入与毛利率
2009-2014年 依顿电子收入Layer分布
2009-2013 依顿电子收入(按应用)
2009-2013依顿电子收入(按地区)
2007-2012年 依顿电子收入客户结构
2007-2014年沪士电子收入与运营利润
2010-2013年沪士电子收入by layer
2007-2015年沪士电子收入下游分布
2012-2015年沪士电子毛利率(按应用)
2013年沪士电子主要客户
KCE股东结构
2013-2017年KCE 财务数据
2011-2014年 KCE Production by Layer
2011-2014 年KCE收入(按地区)
1Q12-2Q15 KCE Quarterly Sales and GP Margin
Q2/2015 KCE 收入(按应用)
2014-2017 KCE产能扩张
2008-2015 ELNA收入与营业利润
2012-2015 ELNA收入业务分布
2013-2014 ELNA收入地域分布
2006-2015年健鼎收入与毛利率
2009-2015年健鼎收入与营业利润率
2013年8月-2015年8月健鼎月度收入
2013年健鼎收入(按应用)
2013年健鼎收入by layer
2006-2011年健鼎产能
2013年健鼎大陆子公司财务数据
2014年健鼎大陆子公司财务数据
FY2005-FY2016 AT&S与EBITDA率
AT&S重庆substrate厂ramp
FY2014 AT&S收入业务与地域分布
FY2015 AT&S收入业务与地域分布
Q1/FY2016 AT&S收入业务与地域分布
Q2/14-Q2/15 AT&S Mobile Devices & Substrates业务季度收入
AT&S Mobile Devices & Substrates业务主要客户
Q2/14-Q2/15 AT&S Industrial & Automotive 业务季度收入
AT&S Industrial & Automotive 业务主要客户
2010-2015 AT&S员工数量
2011-2015AT&S CAPEX
2006-2016财年名幸电子收入与运营利润率
FY 2014名幸电子营业利润分析
2009-2014财年名幸电子大陆子公司收入与运营利润率
2015财年名幸电子大陆子公司收入与运营利润率
2013财年-2015财年名幸电子收入下游应用分布
2010财年-2015财年名幸电子收入技术分布by layer
Global Automobile Sales Volume, 2010-2015
Global Light Vehicle Output by Region, 2003-2015
China’s Automobile Sales Volume, 2005-2015
YoY Growth in Annual Automobile Output in China, 2005-2014
Automotive ECU Market Size, 2013-2018E
Automotive ECU Shipments, 2014-2019E
Market Share of Automotive ECU Suppliers, 2015
Global Automotive Display Market Size by Shipments, 2013-2019E
Global Automotive Display Market Size by Value, 2013-2019E
Automotive Display Shipments Breakdown by Application, 2015-2019E
Global Automotive Infotainment (in Broad Sense) Market Size, 2011-2018E
Global Infotainment Shipments, 2013-2020E
Structure Diagram of ADAS
Development History of ADAS
Output Value of Global PCB Industry, 2001-2016E
Geographic Migration of PCB Production, 2013&2014&2019E
Global PCB Industry Income by Headquarters of Companies, 2012-2015
Chinese Top 26 PCB Companies, 2013-2014
Production Value of Chinese PCB Companies by Layer, 2013-2014
Production Volume of Chinese PCB Companies by Layer, 2013-2014
Global Automotive PCB Market Size, 2011-2019E
Automotive PCB Market by Position, 2015&2020E
Delphi Ceramic Substrate ECU
Metal PCB by Technology, 2015
Four Layer MCPCB Construction
Comparison of High-frequency PCB and Ordinary PCB
24GHz Radar PCB
77GHz Radar PCB
Schweizer Heavy Copper PCB
Heavy Copper PCB Trend
Composition of Power Electronics in xEV
Main Board of Honda Accord Hybrid
Ranking of Automotive PCB Suppliers, 2013-2015
Revenue and Operating Margin of CMK, FY2005-FY2016
Revenue of CMK by Application, FY2007-FY2015
Revenue of CMK by Layer, FY2007-FY2015
Revenue of CMK by Region, FY2007-FY2014
Revenue and Operating Margin of TTM, 2005-2014
Revenue of TTM +Viasystems by Application
Quarterly Revenue of TTM by Region, 2013Q1-2015Q2
Quarterly Revenue and Gross Margin of TTM, 2013Q1-2015Q2
Customers of TTM, 2014
Revenue of TTM by Technology, 2014
Revenue of TTM by Application, 2008-2014
Global Factories of TTM
Revenue and Operating Margin of Viasystems, 2006-2014
Revenue of Viasystems by Business, 2008-2014
Global Footprint of Viasystems
Revenue of Viasystems by Application, 2008-2014
Main Customers of Viasystems, 2008-2014
Main Customers of Viasystems
Net Sales of Viasystems by Country of Destination, 2012-2014
Net Sales of Viasystems by Country of Manufacture, 2012-2014
Revenue of DDI by Region and End Market
Factories of DDI
Main Customers of DDI
Revenue and Gross Margin of Chin Poon Industrial, 2005-2015
Revenue and Operating Margin of Chin Poon Industrial, 2005-2015
Monthly Revenue and Growth Rate of Chin Poon Industrial, Aug 2013-Aug 2015
Sales of Chin Poon Industrial by Region, 2012-2014
Shareholder Structure of Schweizer
Turnover and EBIT Margin of Schweizer, 2010-2015
Net Profit of Schweizer, 2010-2014
Cashflow and Working Capital of Schweizer, 2013-2014
Balance Structure of Schweizer, 2013-2014
Order Intake of Schweizer, 2014Q1-2015Q1
Sales of Schweizer by Application, 2011-2015
Sales of Schweizer by Region, 2011-2015
Organizational Structure of Mektron
Revenue and Operating Margin of NOK, FY2006-FY2016
Net Sales of NOK by Industry, 2013-2015
Capital of NOK by Region, 2013-2015
Depreciation of NOK by Region, 2013-2015
Profit Bridge of NOK FPC (Electric Devices) Segment, 2013-2014
Profit Bridge of NOK FPC (Electric Devices) Segment, 2014-2015
Revenue of NOK by Product, FY2006-FY2016
Operating Profit of NOK by Product, FY2013-FY2016
Revenue of NOK by Region, FY2010-FY2016
Revenue of MEKTRON’s FPC Division by Region, FY2010-FY2016
Global Footprint of Mektron
Revenue and Operating Profit of MEKTEC (Zhuhai), 2004-2014
Organizational Structure of Kingboard Chemical
Revenue and Margin of Profit Attributable to Equity Shareholders of Kingboard Chemical, 2002-2015
Revenue of Kingboard Chemical by Business, 2008-2015
Organizational Structure of Elec & Eltek
Revenue and Operating Margin of Elec & Eltek, 2005-2015
Balance Sheet of Elec & Eltek, 2010-2014
Revenue of Elec & Eltek by Region, 2006-2014
Revenue of Elec & Eltek by Application, 2014
Revenue of Elec & Eltek by Layer, 2006-2013
Capacity of Elec & Eltek’s Factories
Technical Capacity of Elec & Eltek
Revenue of Express Electronics’ Dongguan Factory, 2009-2013
Revenue of Express Electronics’Suzhou Factory, 2009-2013
Organizational Structure of Liang Dar
Revenue and Operating Profit of Kyoden, FY2011-FY2016
Total Assets of Kyoden, FY2011-FY2015
Capital and R&D of Kyoden, FY2011-FY2015
Revenue of Kyoden by Region, FY2012-FY2016
Revenue and Operating Profit of Shirai, FY2011-FY2016
Revenue of Shirai by Technology, FY2011-FY2015
Revenue of Shirai by Application, FY2011-FY2015
Revenue and Gross Margin of Unitech Printed Circuit Board, 2006-2014
Revenue and Operating Margin of Unitech Printed Circuit Board, 2009-2015
Monthly Revenue and Growth Rate of Unitech Printed Circuit Board, Aug 2013-Aug 2015
Technology Roadmap for Rigid PCB
Technology Roadmap for Flexible PCB
Financial Data of Shanghai Unitech Electronics, 2010&2013
Equity Structure of Guangdong Ellington Electronics Technology
Revenue and Gross Margin of Guangdong Ellington Electronics Technology, 2007-2015
Revenue of Guangdong Ellington Electronics Technology by Layer, 2009-2014
Revenue of Guangdong Ellington Electronics Technology by Application, 2009-2013
Revenue of Guangdong Ellington Electronics Technology by Region, 2009-2013
Revenue Structure of WUS Printed Circuit by Customer, 2007-2012
Revenue and Operating Profit of WUS Printed Circuit, 2007-2015
Revenue of WUS Printed Circuit by Layer, 2010-2013
Revenue of WUS Printed Circuit by Application, 2007-2015
Gross Margin of WUS Printed Circuit by Application, 2012-2015
Main Customers of WUS Printed Circuit, 2010-2013
Shareholder Structure of KCE
Financial Summary of KCE, 2013-2017E
Production of KCE by Layer, 2011-2014
Sales of KCE by Region, 2011-2014
Quarterly Sales and GP Margin of KCE, 2012Q1-2015Q2Q
Sales of KCE by Application, 2015Q2
Capacity Expansion of KCE, 2014-2017E
Revenue and Operating Profit of ELNA, 2008-2015
Revenue of ELNA by Business, 2012-2015
Revenue of ELNA by Region, 2013-2014
Revenue and Gross Margin of Tripod Technology, 2006-2015
Revenue and Operating Margin of Tripod Technology, 2009-2015
Monthly Revenue of Tripod Technology, Aug 2013-Aug 2015
Revenue of Tripod Technology by Application, 2013
Revenue of Tripod Technology by Layer, 2013
Capacity of Tripod Technology, 2006-2011
Financial Data of Tripod Technology’s Subsidiaries in Mainland China, 2013
Financial Data of Tripod Technology’s Subsidiaries in Mainland China, 2014
Revenue and EBITDA Margin of AT&S, FY2005-FY2016
Global Presence of AT&S
Chongqing Substrate Plant Ramp of AT&S
Revenue of AT&S by Business/Region, FY2014
Revenue of AT&S by Business/Region, FY2015
Revenue of AT&S by Business/Region, FY2016Q1
Quarterly Revenue of AT&S’ Mobile Devices & Substrates Business, 2014Q2-2015Q2
Main Customers of AT&S’ Mobile Devices & Substrates Business
Quarterly Revenue of AT&S’ Industrial & Automotive Business, 2014Q2-2015Q2
Main Customers of AT&S’ Industrial & Automotive Business
AT&S’ Employees, 2010-2015
CAPEX of AT&S, 2011-2015
Revenue and Operating Margin of Meiko Electronics, FY2006-FY2016
Operating Profit of Meiko Electronics, FY2014
Revenue and Operating Margin of Meiko Electronics’ Subsidiaries in Mainland China, FY2009-FY2014
Revenue and Operating Margin of Meiko Electronics’ Subsidiaries in Mainland China, FY2015
Revenue of Meiko Electronics by Application, FY2013-FY2015
Revenue of Meiko Electronics by Layer, FY2010-FY2015
如果这份报告不能满足您的要求,我们还可以为您定制报告,请 留言说明您的详细需求。
|