|
|
|
报告导航:研究报告—
制造业—化工
|
|
2015-2018年中国农药行业研究报告 |
 |
字数:5.3万 |
页数:147 |
图表数:190 |
|
中文电子版:9000元 |
中文纸版:4500元 |
中文(电子+纸)版:9500元 |
|
英文电子版:2500美元 |
英文纸版:2700美元 |
英文(电子+纸)版:2800美元 |
|
编号:HK063
|
发布日期:2015-10 |
附件:下载 |
 |
|
|
农药是当前世界农业发展最重要的增产方法之一,农药生产主要包括农药中间体、原药合成和制剂加工三大环节。
2006-2014年,中国农药原药(折有效成分100%)产量的年均复合增长率达14.2%,预计2015年将达到366万吨左右。中国农药原药的生产主要集中在江苏省、山东省、河南省、浙江省等地,2014年这四个地区所占比例接近70%。
农药制剂主要包括除草剂、杀虫剂和杀菌剂三类。2006-2014年,中国除草剂在农药制剂中的比例快速上升,而杀虫剂则持续下降,杀菌剂相对来说变化不大。2015年,预计中国除草剂、杀虫剂和杀菌剂的产量将分别达到175万吨、53万吨和18万吨。
中国不仅是农药生产与消费大国,也是农药出口大国。2010-2014年,中国农药出口量的年均复合增长率达17.3%,预计2015年将达到130万吨左右。但是中国农药出口单价远低于进口单价,主要原因是进口产品多为创新药,而出口产品多为原药、仿制药等。
全球农药公司可分为研发型和过期专利型两类,前者主要为先正达、陶氏、巴斯夫、拜耳、孟山都等大型跨国企业。中国农药生产企业由于规模小、技术差,多为过期专利型企业,主要做原料药和仿制药。
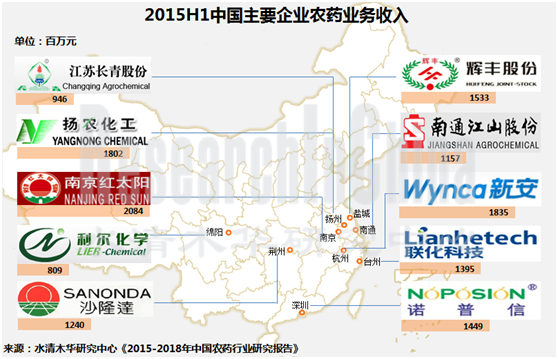
目前,中国农药生产企业达2000余家,市场集中度极低,主要上市公司有红太阳、新安股份、扬农化工、辉丰股份、诺普信等。2015年,中国有多家农药企业进军资本市场,如国光股份、利民股份和广信股份。此外,还有多家农药企业筹划上市,如江苏中旗作物保护股份有限公司、江苏苏利精细化工股份有限公司等。
近年来,在互联网提升传统产业竞争力的大趋势下,中国部分农药生产企业也开始逐步探索“互联网+”模式。如诺普信建立了田田圈、农集网、农金圈,打造完整的互联网农业服务生态链;辉丰股份联合中国农药发展与应用协会等单位共同发起设立农一网,专门从事农资电子商务。
水清木华研究中心《2015-2018年中国农药行业研究报告》主要包括以下几个内容:
 中国农药行业供需分析、进出口分析、行业运营情况、竞争格局等; 中国农药行业供需分析、进出口分析、行业运营情况、竞争格局等;
中国农药行业发展环境、发展趋势及预测等;
中国16家农药生产企业的运营状况、农药业务分析及发展预测等。
Pesticide is one of the most important methods to intensify production in current global agricultural development. Pesticide production mainly consists of three sectors, namely pesticide intermediates, API synthesis and preparation processing.
In 2006-2014, China's output of pesticide API (converting into active ingredient 100%) grew at a CAGR of 14.2%. The output is expected to reach 3.66 million tons in 2015. China’s pesticide API production is mainly concentrated in Jiangsu, Shandong, Henan and Zhejiang, which contributed nearly 70% to the total output in 2014.
Pesticide preparations include herbicides, insecticides and fungicides. In 2006-2014, the proportion of herbicides in Chinese pesticide preparations ascended dramatically, while the share of insecticides kept declining, and the proportion of fungicides remained unchanged. In 2015, China will produce 1.75 million tons of herbicides, 530 kilotons of insecticides and 180 kilotons of fungicides.
China is not only a big pesticide producer and consumer, but also a key exporter. In 2010-2014, China's pesticide export volume grew at a CAGR of 17.3%; the volume is estimated to hit 1.3 million tons in 2015. However, China's pesticide export price is far lower than the import price, mainly because the country imports innovative medicines while exports API and generic drugs in most cases.
Global pesticide players could be divided into two types, namely, R&D oriented and overdue patent oriented. The former mainly covers Syngenta, DOW, BASF, Bayer and Monsanto. Chinese pesticide companies, featured with small scale and weak technology, are mostly overdue patent oriented and engaged in API and generic drugs.
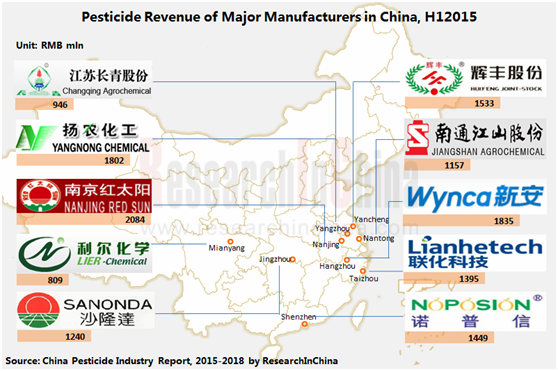
Now, there are over 2,000 pesticide manufacturers in China, indicating extremely low market concentration. The main listed companies embrace Red Sun, Zhejiang Xinan Chemical Industrial Group, Jiangsu Yangnong Chemical, Jiangsu Huifeng Agrochemical, Noposion Agrochemicals and so on. In 2015, numerous Chinese pesticide companies enter the capital market, such as Sichuan Guoguang Agrochemical, Limin Chemical and Guangxin Agrochemical. In addition, a number of pesticide companies represented by Jiangsu Flag Chemical Industry, Suli Chemical and the like intend to go public.
In recent years, some Chinese pesticide manufacturers have begun to explore the "Internet +" mode as the Internet exalts the competitiveness of traditional industries. For example, Noposion Agrochemicals has established Tiantianquan, www.njw88.com and Nongjinquan to create a complete ecological chain of Internet agricultural services; Jiangsu Huifeng Agrochemical cooperates with China Pesticide Development & Application Association to erect www.16899.com jointly in order to specialize in agricultural e-business.
The report dwells on following aspects:
 Supply, demand, import, export, operation, competitive landscape, etc. of China pesticide industry; Supply, demand, import, export, operation, competitive landscape, etc. of China pesticide industry;
Development environment, trends and prospects, etc. of China pesticide industry;
Operation, pesticide business and development prospects of 16 Chinese pesticide producers.
第一章 农药行业概述
1.1 定义
1.2 分类
1.3 产业链
第二章 中国农药行业发展现状
2.1 生产情况
2.1.1 农药原药产量
2.1.2 农药制剂产量
2.1.3 分省市产量
2.2 销售情况
2.3 进出口情况
2.3.1 进口情况
2.3.2 出口情况
2.3.3 进出口价格
2.4 经营情况
2.4.1 企业数量
2.4.2 营业收入
2.4.3 利润水平
2.5 竞争格局
2.5.1 国际市场
2.5.2 中国市场
2.6 进入壁垒
2.6.1 严格的行政许可
2.6.2 较高的资本壁垒
2.6.3 环保方面的障碍
2.6.4 先进技术引进的障碍
2.6.5 市场进入障碍
第三章 中国农药行业发展环境
3.1 政策环境
3.1.1 监管政策
3.1.2 行业政策
3.2 上下游行业
3.2.1 上游行业
3.2.2 下游行业
第四章 中国农药行业发展预测
4.1 农药原药产能向中国转移
4.1.1 中国企业主要做“仿制药”
4.1.2 低成本优势承接产业转移
4.2 农药景气度
4.3 中国农药市场供需分析
4.3.1 行业整合加剧 供给能力增强
4.3.2 农药产品结构将逐步优化、合理
4.3.3 农药市场内外需求将保持稳定增长
4.4 中国农药行业政策变化趋势
4.4.1 未来政策面将继续保持紧缩
4.4.2 环保管理逐步走向正规化与国际化
第五章 中国主要农药企业
5.1 红太阳
5.1.1 企业简介
5.1.2 经营情况
5.1.3 营收构成
5.1.4 毛利率
5.1.5 研发
5.1.6 农药业务
5.1.7 预测与展望
5.2 江山股份
5.2.1 企业简介
5.2.2 经营情况
5.2.3 营收构成
5.2.4 毛利率
5.2.5 研发
5.2.6 农药业务
5.2.7 预测与展望
5.3 利尔化学
5.3.1 企业简介
5.3.2 经营情况
5.3.3 营收构成
5.3.4 毛利率
5.3.5 研发
5.3.6 农药业务
5.3.7 预测与展望
5.4 扬农化工
5.4.1 企业简介
5.4.2 经营情况
5.4.3 营收构成
5.4.4 毛利率
5.4.5 研发
5.4.6 农药业务
5.4.7 预测与展望
5.5 长青股份
5.5.1 企业简介
5.5.2 经营情况
5.5.3 营收构成
5.5.4 毛利率
5.5.5 研发
5.5.6 农药业务
5.5.7 预测与展望
5.6 新安股份
5.6.1 企业简介
5.6.2 经营情况
5.6.3 营收构成
5.6.4 毛利率
5.6.5 研发
5.6.6 农药业务
5.6.7 预测与展望
5.7 升华拜克
5.7.1 企业简介
5.7.2 经营情况
5.7.3 营收构成
5.7.4 毛利率
5.7.5 研发
5.7.6 农药业务
5.7.7 预测与展望
5.8 沙隆达
5.8.1 企业简介
5.8.2 经营情况
5.8.3 营收构成
5.8.4 毛利率
5.8.5 研发
5.8.6 农药业务
5.8.7 预测与展望
5.9 辉丰股份
5.9.1 企业简介
5.9.2 经营情况
5.9.3 营收构成
5.9.4 毛利率
5.9.5 研发
5.9.6 农药业务
5.9.7 预测与展望
5.10 湖南海利
5.10.1 企业简介
5.10.2 经营情况
5.10.3 营收构成
5.10.4 毛利率
5.10.5 研发
5.10.6 农药业务
5.10.7 预测与展望
5.11 利民股份
5.11.1 企业简介
5.11.2 经营情况
5.11.3 营收构成
5.11.4 毛利率
5.11.5 研发
5.11.6 农药业务
5.11.7 预测与展望
5.12 联化科技
5.12.1 企业简介
5.12.2 经营情况
5.12.3 营收构成
5.12.4 毛利率
5.12.5 研发
5.12.6 农药业务
5.12.7 预测与展望
5.13 蓝丰生化
5.13.1 企业简介
5.13.2 经营情况
5.13.3 营收构成
5.13.4 毛利率
5.13.5 研发
5.13.6 农药业务
5.13.7 预测与展望
5.14 诺普信
5.14.1 企业简介
5.14.2 经营情况
5.14.3 营收构成
5.14.4 毛利率
5.14.5 研发
5.14.6 农药业务
5.14.7 预测与展望
5.15 新奥股份
5.15.1 企业简介
5.15.2 经营情况
5.15.3 营收构成
5.15.4 毛利率
5.15.5 研发
5.15.6 农药业务
5.15.7 预测与展望
5.16 国光股份
5.16.1 企业简介
5.16.2 经营情况
5.16.3 营收构成
5.16.4 毛利率
5.16.5 研发
5.16.6 农药业务
5.16.7 预测与展望
第六章 总结与预测
6.1 总结
6.1.1 技术
6.1.2 进出口
6.1.3 产销量
6.1.4 企业
6.2 预测
1. Overview of Pesticide Industry
1.1 Definition
1.2 Classification
1.3 Industry Chain
2. Status Quo of China Pesticide Industry
2.1 Production
2.1.1 Pesticide API
2.1.2 Pesticide Preparation
2.1.3 Output by Province/City
2.2 Sales
2.3 Import and Export
2.3.1 Import
2.3.2 Export
2.3.3 Import and Export Prices
2.4 Operation
2.4.1 Number of Enterprises
2.4.2 Revenue
2.4.3 Profit
2.5 Competition Pattern
2.5.1 International Market
2.5.2 Chinese Market
2.6 Entry Barriers
2.6.1 Strict Administrative Licensing
2.6.2 Higher Capital Barrier
2.6.3 Environmental Barriers
2.6.4 Obstacles in Introducing Advanced Technologies
2.6.5 Market Entry Barriers
3. Development Environment of China Pesticide Industry
3.1 Policy Environment
3.1.1 Regulatory Policy
3.1.2 Industry Policy
3.2 Upstream and Downstream Sectors
3.2.1 Upstream
3.2.2 Downstream
4. Development Outlook of China Pesticide Industry
4.1 Pesticide API Capacity Transferring to China
4.1.1 Chinese Players Specializing in “Generic Drugs”
4.1.2 Low-cost Edge Backing Industry Transferring
4.2 Boom of Pesticide Industry
4.3 Supply and Demand in China Pesticide Market
4.3.1 Accelerated Industrial Integration, Improved Supply Capabilities
4.3.2 Improved Optimization of Pesticide Product Structure
4.3.3 Steady Growth in Domestic and Overseas Demand from Pesticide Market
4.4 Policy Tendency in China Pesticide Industry
4.4.1 Further Policies to Be Tightened
4.4.2 Environmental Protection Management is Becoming Normalized and Internationalized
5. Major Chinese Pesticide Players
5.1 NANJING RED SUN
5.1.1 Profile
5.1.2 Operation
5.1.3 Revenue Structure
5.1.4 Gross Margin
5.1.5 R&D
5.1.6 Pesticide Business
5.1.7 Forecast and Outlook
5.2 Nantong Jiangshan Agrochemical & Chemicals
5.2.1 Profile
5.2.2 Operation
5.2.3 Revenue Structure
5.2.4 Gross Margin
5.2.5 R&D
5.2.6 Pesticide Business
5.2.7 Forecast and Outlook
5.3 Lier Chemical
5.3.1 Profile
5.3.2 Operation
5.3.3 Revenue Structure
5.3.4 Gross Margin
5.3.5 R&D
5.3.6 Pesticide Business
5.3.7 Forecast and Outlook
5.4 Jiangsu Yangnong Chemical
5.4.1 Profile
5.4.2 Operation
5.4.3 Revenue Structure
5.4.4 Gross Margin
5.4.5 R&D
5.4.6 Pesticide Business
5.4.7 Forecast and Outlook
5.5 Jiangsu Changqing Agrichemical
5.5.1 Profile
5.5.2 Operation
5.5.3 Revenue Structure
5.5.4 Gross Margin
5.5.5 R&D
5.5.6 Pesticide Business
5.5.7 Forecast and Outlook
5.6 Zhejiang Xin’an Chemical Industrial Group
5.6.1 Profile
5.6.2 Operation
5.6.3 Revenue Structure
5.6.4 Gross Margin
5.6.5 R&D
5.6.6 Pesticide Business
5.6.7 Forecast and Outlook
5.7 Zhejiang Shenghua Biok Biology
5.7.1 Profile
5.7.2 Operation
5.7.3 Revenue Structure
5.7.4 Gross Margin
5.7.5 R&D
5.7.6 Pesticide Business
5.7.7 Forecast and Outlook
5.8 HUBEI SANONDA
5.8.1 Profile
5.8.2 Operation
5.8.3 Revenue Structure
5.8.4 Gross Margin
5.8.5 R&D
5.8.6 Pesticide Business
5.8.7 Forecast and Outlook
5.9 Jiangsu Huifeng Agrochemical
5.9.1 Profile
5.9.2 Operation
5.9.3 Revenue Structure
5.9.4 Gross Margin
5.9.5 R&D
5.9.6 Pesticide Business
5.9.7 Forecast and Outlook
5.10 Hunan Haili Chemical
5.10.1 Profile
5.10.2 Operation
5.10.3 Revenue Structure
5.10.4 Gross Margin
5.10.5 R&D
5.10.6 Pesticide Business
5.10.7 Forecast and Outlook
5.11 Limin Chemical
5.11.1 Profile
5.11.2 Operation
5.11.3 Revenue Structure
5.11.4 Gross Margin
5.11.5 R&D
5.11.6 Pesticide Business
5.11.7 Forecast and Outlook
5.12 Lianhe Chemical Technology
5.12.1 Profile
5.12.2 Operation
5.12.3 Revenue Structure
5.12.4 Gross Margin
5.12.5 R&D
5.12.6 Pesticide Business
5.12.7 Forecast and Outlook
5.13 Lanfeng Biochemical
5.13.1 Profile
5.13.2 Operation
5.13.3 Revenue Structure
5.13.4 Gross Margin
5.13.5 R&D
5.13.6 Pesticide Business
5.13.7 Forecast and Outlook
5.14 Noposion Agrochemicals
5.14.1 Profile
5.14.2 Operation
5.14.3 Revenue Structure
5.14.4 Gross Margin
5.14.5 R&D
5.14.6 Pesticide Business
5.14.7 Forecast and Outlook
5.15 ENN Group
5.15.1 Profile
5.15.2 Operation
5.15.3 Revenue Structure
5.15.4 Gross Margin
5.15.5 R&D
5.15.6 Pesticide Business
5.15.7 Forecast and Outlook
5.16 Sichuan Guoguang Agrochemical
5.16.1 Profile
5.16.2 Operation
5.16.3 Revenue Structure
5.16.4 Gross Margin
5.16.5 R&D
5.16.6 Pesticide Business
5.16.7 Forecast and Outlook
6. Summary and Forecast
6.1 Summary
6.1.1 Technology
6.1.2 Import and Export
6.1.3 Production and Sales
6.1.4 Enterprise
6.2 Forecast
表:农药分类和主要品种
图:农药产业链
图:2006-2015年中国化学农药原药(折有效成分100%)产量
图:2006-2015年中国农药制剂主要产品产量
图:2014年中国化学农药原药(折有效成分100%)产量结构(按省市)
图:2014年中国杀虫剂产量结构(按省市)
图:2014年中国除草剂产量结构(按省市)
图:2014年中国杀菌剂产量结构(按省市)
图:2006-2015年中国化学农药原药(折有效成分100%)销量及产销率
图:2010-2015年中国农药进口量及增长率
图:2010-2015年中国农药进口金额及增长率
图:2010-2015年中国农药出口量及增长率
图:2010-2015年中国农药出口金额及增长率
图:2010-2015年中国农药进出口平均价格
图:2006-2015年中国农药行业企业数量
图:2006-2015年中国农药行业亏损企业占比
图:2006-2015年中国农药行业主营业务收入
图:2006-2015年中国农药行业利润总额
图:2006-2015年中国农药行业毛利率
表:2013-2015年中国主要企业农药业务毛利率
表:2013-2015年中国农药行业主要企业农药业务收入
表:2013-2015年中国农药行业主要企业市场份额
表:2015年中国上市/拟上市农药企业及募投项目情况
表:中国农药行业监管政策及主要内容
表:2005-2015年中国农药行业主要政策
表:2013-2017年中国到期的农药专利产品
表:2008-2015年中国农药行业重要兼并重组事件
表:新版《农药管理条例》(征求意见稿)与旧版比较
表:中国农药行业“十二五”规划
表:全球农药行业相关的国际条约
表:中国农药相关环保政策
图:2011-2015年红太阳营业收入和净利润
表:2013-2015年红太阳(分产品)营业收入
图:2013-2015年红太阳(分产品)营业收入占比
表:2013-2015年红太阳(分地区)营业收入
图:2013-2015年红太阳(分地区)营业收入占比
图:2013-2015年红太阳(分产品)毛利率
图:2013-2015年红太阳研发支出及占营业收入的比例
表:2015H1红太阳主要子公司营业收入及净利润
表:2014-2018年红太阳营业收入和净利润预测
图:2011-2015年江山股份营业收入及净利润
表:2013-2015年江山股份(分产品)营业收入
表:2013-2015年江山股份(分产品)营业收入占比
表:2013-2015年江山股份(分地区)营业收入
图:2013-2015年江山股份(分地区)营业收入占比
图:2013-2015年江山股份(分产品)毛利率
图:2013-2015年江山股份研发支出及占营业收入的比例
图:2013-2014年江山股份农药产销量
表:2014-2018年江山股份营业收入和净利润预测
图:2011-2015年利尔化学营业收入及净利润
表:2013-2015年利尔化学(分产品)营业收入
图:2013-2015年利尔化学(分产品)营业收入占比
表:2013-2015年利尔化学(分地区)营业收入
图:2013-2015年利尔化学(分地区)营业收入占比
图:2013-2015年利尔化学(分产品)毛利率
图:2013-2015年利尔化学研发支出及占营业收入的比例
图:2012-2014年利尔化学农药产销量
图:2013-2015年江苏快达营业收入和净利润
表:2014-2018年利尔化学营业收入和净利润预测
图:2011-2015年扬农化工营业收入及净利润
表:2013-2015年扬农化工(分产品)营业收入
图:2013-2015年扬农化工(分产品)营业收入占比
表:2013-2015年扬农化工(分地区)营业收入
图:2013-2015年扬农化工(分地区)营业收入占比
图:2013-2015年扬农化工(分产品)毛利率
图:2013-2015年扬农化工研发支出及占营业收入的比例
表:2012-2014年扬农化工农药产品产销量
表:截止2015年6月30日扬农化工主要农药产品产能
表:2015H1扬农化工主要子公司营业收入和净利润
表:2014-2018年扬农化工营业收入和净利润预测
图:2011-2015年长青股份营业收入及净利润
表:2013-2015年长青股份(分产品)营业收入
图:2013-2015年长青股份(分产品)营业收入占比
表:2013-2015年长青股份(分地区)营业收入
表:2013-2015年长青股份(分地区)营业收入占比
图:2013-2015年长青股份(分产品)毛利率
图:2013-2015年长青股份研发支出及占营业收入的比例
表:截止2015年6月30日长青股份主要农药产品及产能
表:2012-2014年长青股份农药产品产销量
表:2015H1长青股份主要子公司营业收入和净利润
表:2014-2018年长青股份营业收入和净利润预测
图:2011-2015年新安股份营业收入及净利润
表:2013-2015年新安股份(分产品)营业收入
图:2013-2015年新安股份(分产品)营业收入占比
表:2013-2015年新安股份(分地区)营业收入
图:2013-2015年新安股份(分地区)营业收入占比
图:2013-2015年新安股份(分产品)毛利率
图:2013-2015年新安股份研发支出及占营业收入的比例
图:2012-2014年新安股份农药产销量
表:2014-2018年新安股份营业收入和净利润预测
图:2011-2015年升华拜克营业收入及净利润
表:2013-2015年升华拜克(分产品)营业收入
图:2013-2015年升华拜克(分产品)营业收入占比
表:2013-2015年升华拜克(分地区)营业收入
图:2013-2015年升华拜克(分地区)营业收入占比
图:2013-2015年升华拜克(分产品)毛利率
图:2013-2015年升华拜克研发支出及占营业收入的比例
表:2014-2018年升华拜克营业收入和净利润预测
表:沙隆达主要产品体系
图:2011-2015年沙隆达营业收入及净利润
表:2013-2015年沙隆达(分产品)营业收入
表:2013-2015年沙隆达(分产品)营业收入占比
表:2013-2015年沙隆达(分地区)营业收入
表:2013-2015年沙隆达(分地区)营业收入占比
表:2013-2015年沙隆达(分产品)毛利率
图:2013-2015年沙隆达研发支出及占营业收入的比例
表:2014年沙隆达主要产品产能
表:2014-2018年沙隆达营业收入和净利润预测
图:2011-2015年辉丰股份营业收入及净利润
表:2013-2015年辉丰股份(分产品)营业收入
图:2013-2015年辉丰股份(分产品)营业收入占比
表:2013-2015年辉丰股份(分地区)营业收入
图:2013-2015年辉丰股份(分地区)营业收入占比
图:2013-2015年辉丰股份(分产品)毛利率
图:2013-2015年辉丰股份研发支出及占营业收入的比例
表:2014年辉丰股份主要农药产品及产能
表:2014-2018年辉丰股份营业收入和净利润预测
图:2011-2015年湖南海利营业收入及净利润
表:2013-2015年湖南海利(分产品)营业收入
图:2013-2015年湖南海利(分产品)营业收入占比
表:2013-2015年湖南海利(分地区)营业收入
图:2013-2015年湖南海利(分地区)营业收入占比
图:2013-2015年湖南海利(分产品)毛利率
图:2013-2015年湖南海利研发支出及占营业收入的比例
图:2013-2014年湖南海利农药产销量
表:2014-2018年湖南海利营业收入和净利润预测
图:2011-2015年利民股份营业收入及净利润
表:2014-2015年利民股份(分产品)营业收入
图:2014-2015年利民股份(分产品)营业收入占比
表:2013-2015年利民股份(分地区)营业收入
图:2013-2015年利民股份(分地区)营业收入占比
表:2014-2015年利民股份(分产品)毛利率
图:2013-2015年利民股份研发支出及占营业收入的比例
表:2012-2014年利民股份主要产品产销量
表:2014-2018年利民股份营业收入和净利润预测
图:2011-2015年联化科技营业收入及净利润
表:2013-2015年联化科技(分产品)营业收入
图:2013-2015年联化科技(分产品)营业收入占比
表:2013-2015年联化科技(分地区)营业收入
表:2013-2015年联化科技(分地区)营业收入占比
图:2013-2015年联化科技(分产品)毛利率
图:2013-2015年联化科技研发支出及占营业收入的比例
图:2012-2014年联化科技农药中间体产销量
表:2015H1联化科技主要子公司营业收入和净利润
表:2014-2018年联化科技营业收入和净利润预测
图:2011-2015年蓝丰生化营业收入及净利润
表:2013-2015年蓝丰生化(分产品)营业收入
图:2013-2015年蓝丰生化(分产品)营业收入占比
表:2013-2015年蓝丰生化(分地区)营业收入
图:2013-2015年蓝丰生化(分地区)营业收入占比
图:2013-2015年蓝丰生化(分产品)毛利率
图:2013-2015年蓝丰生化研发支出及占营业收入的比例
表:2012-2014年蓝丰生化主要产品产销量
表:2014-2018年蓝丰生化营业收入和净利润预测
图:2011-2015年诺普信营业收入及净利润
表:2013-2015年诺普信(分产品)营业收入
图:2013-2015年诺普信(分产品)营业收入占比
表:2013-2015年诺普信(分地区)营业收入
图:2013-2015年诺普信(分地区)营业收入占比
图:2013-2015年诺普信(分产品)毛利率
图:2013-2015年诺普信研发支出及占营业收入的比例
图:2012-2014年诺普信农药制剂产销量
表:2014-2018年诺普信营业收入和净利润预测
图:2011-2015年新奥股份营业收入及净利润
表:2013-2015年新奥股份(分产品)营业收入
图:2013-2015年新奥股份(分产品)营业收入占比
表:2013-2015年新奥股份(分地区)营业收入
图:2013-2015年新奥股份(分地区)营业收入占比
图:2013-2015年新奥股份(分产品)毛利率
图:2013-2015年新奥股份研发支出及占营业收入的比例
图:2012-2014年新奥股份农药产销量
表:2015H1新奥股份农药相关子公司经营情况
表:2014-2018年新奥股份营业收入和净利润预测
表:国光农化主要产品
图:2011-2015年国光股份营业收入及净利润
表:2013-2015年国光股份(分产品)营业收入
表:2013-2015年国光股份(分产品)营业收入占
表:2013-2015年国光股份(分地区)营业收入
图:2013-2015年国光股份(分地区)营业收入占比
表:2013-2015年国光股份(分产品)毛利率
图:2013-2015年国光股份研发支出及占营业收入的比例
表:截止2015年6月30日国光股份募集项目进展情况
表:2014年国光股份主要原药及制剂产品产能
表:2012-2014年国光农化主要原药及制剂产品产量
表:2012-2014年国光股份主要农药产品产销量
表:2014-2018年国光股份营业收入和净利润预测
图:2010-2015中国农药进出口量
图:2006-2015年中国农药原药(折有效成分100%)产销量
表:2015H1中国主要企业农药业务收入及市场占有率
图:2014-2018年中国农药原药(折有效成分100%)产量预测
Classification and Main Varieties of Pesticides
Pesticide Industry Chain
Output of Chemical Pesticide APIs (equivalent to 100% Active Ingredient) in China, 2006-2015
Output of Major Pesticide Products in China, 2006-2015
Output Structure of Chemical Pesticide APIs (equivalent to 100% Active Ingredient) in China (by Province/Municipality), 2014
China’s Insecticide Output Structure (by Province/City), 2014
China’s Herbicide Output Structure (by Province/City), 2014
Sales Volume and Sales-Output Ratio of Chemical Pesticide APIs (equivalent to 100% Active Ingredient) in China, 2006-2015
Pesticide Import Volume and Growth Rate in China, 2010-2015
Pesticide Import Value and Growth Rate in China, 2010-2015
Pesticide Export Volume and Growth Rate in China, 2010-2015
Pesticide Export Value and Growth Rate in China, 2010-2015
Average Import and Export Prices of Pesticides in China, 2010-2015
Number of Enterprises in China Pesticide Industry, 2006-2015
Proportion of Loss-generating Enterprises in China Pesticide Industry, 2006-2015
Operating Revenue of China Pesticide Industry, 2006-2015
Total Profit of China Pesticide Industry, 2006-2015
Gross Margin of China Pesticide Industry, 2006-2015
Gross Margin of Pesticide Business of Major Companies in China Pesticide Industry, 2013-2015
Pesticide Revenue of Major Companies in China Pesticide Industry, 2013-2015
Market Share of Major Companies in China Pesticide Industry, 2013-2015
Pesticide Enterprises Listed and to Be Listed and Their Fund-Raising Projects, 2015
Regulatory Policies and Main Content in China Pesticide Industry
Major Policies on China Pesticide Industry, 2005-2015
Pesticide Patented Products Expired in China, 2013-2017
Key Merger and Reorganization Events in China Pesticide Industry, 2008-2015
Comparison between New Version Pesticide Management Regulations (Draft) and Old Version
"Twelfth Five-Year Plan" of Pesticide Industry
International Treaties in Global Pesticide Industry
Chinese Pesticide-related Environmental Policies
Revenue and Net Income of NANJING RED SUN, 2011-2015
Revenue of NANJING RED SUN by Product, 2013-2015
Revenue Structure of NANJING RED SUN by Product, 2013-2015
Revenue of NANJING RED SUN by Region, 2013-2015
Revenue Structure of NANJING RED SUN by Region, 2013-2015
Gross Margin of NANJING RED SUN by Product, 2013-2015
R&D Costs and % of Total Revenue of NANJING RED SUN, 2013-2015
Revenue and Net Income of Major Subsidiaries of NANJING RED SUN, 2015H1
Revenue and Net Income of NANJING RED SUN, 2014-2018E
Revenue and Net Income of Nantong Jiangshan Agrochemical & Chemicals, 2011-2015
Revenue of Nantong Jiangshan Agrochemical & Chemicals by Product, 2013-2015
Revenue Structure of Nantong Jiangshan Agrochemical & Chemicals by Product, 2013-2015
Revenue of Nantong Jiangshan Agrochemical & Chemicals by Region, 2013-2015
Revenue Structure of Nantong Jiangshan Agrochemical & Chemicals by Region, 2013-2015
Gross Margin of Nantong Jiangshan Agrochemical & Chemicals by Product, 2013-2015
R&D Costs and % of Total Revenue of Nantong Jiangshan Agrochemical & Chemicals, 2013-2015
Pesticide Output and Sales Volume of Nantong Jiangshan Agrochemical & Chemicals, 2013-2014
Revenue and Net Income of Nantong Jiangshan Agrochemical & Chemicals, 2014-2018E
Revenue and Net Income of Lier Chemical, 2011-2015
Revenue of Lier Chemical by Product, 2013-2015
Revenue Structure of Lier Chemical by Product, 2013-2015
Revenue of Lier Chemical by Region, 2013-2015
Revenue Structure of Lier Chemical by Region, 2013-2015
Gross Margin of Lier Chemical by Product, 2013-2015
R&D Costs and % of Total Revenue of Lier Chemical, 2013-2015
Pesticide Output and Sales Volume of Lier Chemical, 2012-2014
Revenue and Net Income of Jiangsu Kuaida Agrochemical, 2013-2015
Revenue and Net Income of Lier Chemical, 2014-2018E
Revenue and Net Income of Jiangsu Yangnong Chemical, 2011-2015
Revenue of Jiangsu Yangnong Chemical by Product, 2013-2015
Revenue Structure of Jiangsu Yangnong Chemical by Product, 2013-2015
Revenue of Jiangsu Yangnong Chemical by Region, 2013-2015
Revenue Structure of Jiangsu Yangnong Chemical by Region, 2013-2015
Gross Margin of Jiangsu Yangnong Chemical by Product, 2013-2015
R&D Costs and % of Total Revenue of Jiangsu Yangnong Chemical, 2013-2015
Output and Sales Volume of Pesticide Products of Jiangsu Yangnong Chemical, 2012-2014
Capacity of Main Pesticide Products of Jiangsu Yangnong Chemical as of June 30, 2015
Revenue and Net Income of Major Subsidiaries of Jiangsu Yangnong Chemical, 2015H1
Revenue and Net Income of Jiangsu Yangnong Chemical, 2014-2018
Revenue and Net Income of Jiangsu Changqing Agrichemical, 2011-2015
Revenue of Jiangsu Changqing Agrichemical by Product, 2013-2015
Revenue Structure of Jiangsu Changqing Agrichemical by Product, 2013-2015
Revenue of Jiangsu Changqing Agrichemical by Region, 2013-2015
Revenue Structure of Jiangsu Changqing Agrichemical by Region, 2013-2015
Gross Margin of Jiangsu Changqing Agrichemical by Product, 2013-2015
R&D Costs and % of Total Revenue of Jiangsu Changqing Agrichemical, 2013-2015
Capacity of Main Pesticide Products of Jiangsu Changqing Agrichemical as of June 30, 2015
Output and Sales Volume of Pesticide Products of Jiangsu Changqing Agrichemical, 2012-2014
Revenue and Net Income of Major Subsidiaries of Jiangsu Changqing Agrichemical, 2015H1
Revenue and Net Income of Jiangsu Changqing Agrichemical, 2014-2018E
Revenue and Net Income of Zhejiang Xin’an Chemical Industrial Group, 2011-2015
Revenue of Zhejiang Xin’an Chemical Industrial Group by Product, 2013-2015
Revenue Structure of Zhejiang Xin’an Chemical Industrial Group by Product, 2013-2015
Revenue of Zhejiang Xin’an Chemical Industrial Group by Region, 2013-2015
Revenue Structure of Zhejiang Xin’an Chemical Industrial Group by Region, 2013-2015
Gross Margin of Zhejiang Xin’an Chemical Industrial Group by Product, 2013-2015
R&D Costs and % of Total Revenue of Zhejiang Xin’an Chemical Industrial Group, 2013-2015
Pesticide Output and Sales Volume of Zhejiang Xin’an Chemical Industrial Group, 2012-2014
Revenue and Net Income of Zhejiang Xin’an Chemical Industrial Group, 2014-2018E
Revenue and Net Income of Zhejiang Shenghua Biok Biology, 2011-2015
Revenue of Zhejiang Shenghua Biok Biology by Product, 2013-2015
Revenue Structure of Zhejiang Shenghua Biok Biology by Product, 2013-2015
Revenue of Zhejiang Shenghua Biok Biology by Region, 2013-2015
Revenue Structure of Zhejiang Shenghua Biok Biology by Region, 2013-2015
Gross Margin of Zhejiang Shenghua Biok Biology by Product, 2013-2015
R&D Costs and % of Total Revenue of Zhejiang Shenghua Biok Biology, 2013-2015
Revenue and Net Income of Zhejiang Shenghua Biok Biology, 2014-2018E
Main Product System of HUBEI SANONDA
Revenue and Net Income of HUBEI SANONDA, 2011-2015
Revenue of HUBEI SANONDA by Product, 2013-2015
Revenue Structure of HUBEI SANONDA by Product, 2013-2015
Revenue of HUBEI SANONDA by Region, 2013-2015
Revenue Structure of HUBEI SANONDA by Region, 2013-2015
Gross Margin of HUBEI SANONDA by Product, 2013-2015
R&D Costs and % of Total Revenue of HUBEI SANONDA, 2013-2015
Capacity of Main Products of HUBEI SANONDA, 2014
Revenue and Net Income of HUBEI SANONDA, 2014-2018E
Revenue and Net Income of Jiangsu Huifeng Agrochemical, 2011-2015
Revenue of Jiangsu Huifeng Agrochemical by Product, 2011-2015
Revenue Structure of Jiangsu Huifeng Agrochemical by Product, 2011-2015
Revenue of Jiangsu Huifeng Agrochemical by Region, 2011-2015
Revenue Structure of Jiangsu Huifeng Agrochemical by Region, 2011-2015
Gross Margin of Jiangsu Huifeng Agrochemical by Product, 2011-2015
R&D Costs and % of Total Revenue of Jiangsu Huifeng Agrochemical, 2013-2015
Capacity of Main Pesticide Products of Jiangsu Huifeng Agrochemical, 2014
Revenue and Net Income of Jiangsu Huifeng Agrochemical, 2014-2018E
Revenue and Net Income of Hunan Haili Chemical, 2011-2015
Revenue of Hunan Haili Chemical by Product, 2013-2015
Revenue Structure of Hunan Haili Chemical by Product, 2013-2015
Revenue of Hunan Haili Chemical by Region, 2013-2015
Revenue Structure of Hunan Haili Chemical by Region, 2013-2015
Gross Margin of Hunan Haili Chemical by Product, 2013-2015
R&D Costs and % of Total Revenue of Hunan Haili Chemical, 2013-2015
Pesticide Output and Sales Volume of Hunan Haili Chemical, 2013-2014
Revenue and Net Income of Hunan Haili Chemical, 2014-2018E
Revenue and Net Income of Limin Chemical, 2011-2015
Revenue of Limin Chemical by Product, 2014-2015
Revenue Structure of Limin Chemical by Product, 2014-2015
Revenue of Limin Chemical by Region, 2013-2015
Revenue Structure of Limin Chemical by Region, 2013-2015
Gross Margin of Limin Chemical by Product, 2014-2015
R&D Costs and % of Total Revenue of Limin Chemical, 2013-2015
Output and Sales Volume ofMajor Products of Limin Chemical, 2012-2014
Revenue and Net Income of Limin Chemical, 2014-2018E
Revenue and Net Income of Lianhe Chemical Technology, 2011-2015
Revenue of Lianhe Chemical Technology by Product, 2013-2015
Revenue Structure of Lianhe Chemical Technology by Product, 2013-2015
Revenue of Lianhe Chemical Technology by Region, 2013-2015
Revenue Structure of Lianhe Chemical Technology by Region, 2013-2015
Gross Margin of Lianhe Chemical Technology by Product, 2013-2015
R&D Costs and % of Total Revenue of Lianhe Chemical Technology, 2013-2015
Pesticides Intermediate Output and Sales Volume of Lianhe Chemical Technology, 2012-2014
Revenue and Net Income of Major Subsidiaries of Lianhe Chemical Technology, 2015H1
Revenue and Net Income of Lianhe Chemical Technology, 2014-2018E
Revenue and Net Income of Lanfeng Biochemical, 2011-2015
Revenue of Lanfeng Biochemical by Product, 2013-2015
Revenue Structure of Lanfeng Biochemical by Product, 2013-2015
Revenue of Lanfeng Biochemical by Region, 2013-2015
Revenue Structure of Lanfeng Biochemical by Region, 2013-2015
Gross Margin of Lanfeng Biochemical by Product, 2013-2015
R&D Costs and % of Total Revenue of Lanfeng Biochemical, 2013-2015
Output and Sales Volume of Major Products of Lanfeng Biochemical, 2012-2014
Revenue and Net Income of Lanfeng Biochemical, 2014-2018E
Revenue and Net Income of Noposion Agrochemicals, 2011-2015
Revenue of Noposion Agrochemicals by Product, 2013-2015
Revenue Structure of Noposion Agrochemicals by Product, 2013-2015
Revenue of Noposion Agrochemicals by Region, 2013-2015
Revenue Structure of Noposion Agrochemicals by Region, 2013-2015
Gross Margin of Noposion Agrochemicals by Product, 2013-2015
R&D Costs and % of Total Revenue of Noposion Agrochemicals, 2013-2015
Output and Sales Volume of Pesticide Preparations of Noposion Agrochemicals, 2012-2014
Revenue and Net Income of Noposion Agrochemicals, 2014-2018E
Revenue and Net Income of ENN Group, 2011-2015
Revenue of ENN Group by Product, 2013-2015
Revenue Structure of ENN Group by Product, 2013-2015
Revenue of ENN Group by Region, 2013-2015
Revenue Structure of ENN Group by Region, 2013-2015
Gross Margin of ENN Group by Product, 2013-2015
R&D Costs and % of Total Revenue of ENN Group, 2013-2015
Pesticide Output and Sales Volume of ENN Group, 2012-2014
Operation of Pesticide-related Subsidiaries of ENN Group, 2015H1
Revenue and Net Income of ENN Group, 2014-2018E
Main Products of Guoguang Agrochemical
Revenue and Net Income of Sichuan, 2011-2015
Revenue of Sichuan Guoguang Agrochemical by Product, 2013-2015
Revenue Structure of Sichuan Guoguang Agrochemical by Product, 2013-2015
Revenue of Sichuan Guoguang Agrochemical by Region, 2013-2015
Revenue Structure of Sichuan Guoguang Agrochemical by Region, 2013-2015
Gross Margin of Sichuan Guoguang Agrochemical by Product, 2013-2015
R&D Costs and % of Total Revenue of Sichuan Guoguang Agrochemical, 2013-2015
Progress of Fund-raising Projects of Sichuan Guoguang Agrochemical as of June 30, 2015
Capacity of Major API and Preparation Products of Sichuan Guoguang Agrochemical, 2014
Output of Major API and Preparation Products of Sichuan Guoguang Agrochemical, 2012-2014
Output and Sales Volume of Main Pesticide Products of Sichuan Guoguang Agrochemical, 2012-2014
Revenue and Net Income of Sichuan Guoguang Agrochemical, 2014-2018E
Import and Export Volume of Pesticide in China, 2010-2015
Output and Sales Volume of Pesticide APIs (equivalent to 100% Active Ingredient) in China, 2006-2015
Pesticide Revenue and Market Share of Major Chinese Enterprises, 2015H1
Output of Pesticide APIs (equivalent to 100% Active Ingredient) in China, 2014-2018E
如果这份报告不能满足您的要求,我们还可以为您定制报告,请 留言说明您的详细需求。
|