|
报告导航:研究报告—
TMT产业—TMT其他
|
|
2015年全球及中国动漫行业研究报告 |
 |
字数:4.9万 |
页数:140 |
图表数:145 |
|
中文电子版:8500元 |
中文纸版:4250元 |
中文(电子+纸)版:9000元 |
|
英文电子版:2400美元 |
英文纸版:2600美元 |
英文(电子+纸)版:2700美元 |
|
编号:LMX072
|
发布日期:2015-11 |
附件:下载 |
 |
|
|
2014年以来,受益政府对动漫产业的扶持政策以及互联网新媒体发行渠道的蓬勃发展,中国动漫产业继续保持强劲增长。2014年,中国动漫行业总产值超过1000亿元,同比增长14.84%。
2014-2015年,中国动漫行业发展呈现出以下几个特点:
从动漫内容制作来看,动画片产量下滑,动画电影票房持续走高。2014年,全国制作完成的国产电视动画片共138579分钟,同比下降32.31%,为2009年以来最低产量,仅相当于2011年最高产量的一半左右。主要原因:一是由于市场竞争激烈,部分动画制作企业仅微利生存;二是由于“十二五”规划提出动画生产需要从数量向质量转变,各地相继优化了扶持方案。
2014年,中国动画电影票房接近30亿元:共上映进口动画电影17部,票房约19亿元;国产动画电影28部,总票房为10.6亿。
从动漫发行渠道来看,以移动互联网、智能电视等为代表的新媒体渠道的兴起和繁荣助力动漫行业发展。互联网对动漫行业需求的影响,具体可分为三个方面:1)新媒体渠道对内容要求更细化,各视频网站都开辟了专门的动漫板块;2)新媒体下动漫具备社交属性满足社交需求,如弹幕、漫展、动漫社区等;3)新媒体提供动漫衍生需求,如手游、端游等。
以“有妖气原创漫画梦工厂”为例,旗下动漫作品《十万个冷笑话》动画短片播放量数亿次,2015年初上映的同名电影获得1.18亿票房。
从动漫衍生品市场来看,衍生品市场规模持续扩大。2014年中国动漫衍生品市场规模为316 亿元,占动漫产业的31.6%,增速为19.7%,略高于整个动漫产业的14.8%。其中,动漫玩具占比最高,其市场规模达到中国动漫衍生品整体市场的一半以上,动漫服装和动漫出版则分别占16%和4%。
从市场竞争格局来看,主要动漫上市公司通过并购不断延伸产业链条,打造全产业链业务版图。
《2015年全球及中国动漫行业研究报告》主要涉及以下内容:
 全球动漫产业发展概况,主要包括扶持政策、产业格局、主要动漫产业基地,美国、日本及韩国的动漫产业发展模式及盈利模式; 全球动漫产业发展概况,主要包括扶持政策、产业格局、主要动漫产业基地,美国、日本及韩国的动漫产业发展模式及盈利模式;
中国动漫产业整体概况,包括政策扶持、行业产值、企业类型、竞争格局等;
中国动漫制作和传播发行市场分析,主要针对电视动漫、动漫电影、动漫游戏、漫画、新媒体市场、动漫产业基地进行分析及研究;
中国动漫衍生产业分析,包括动漫玩具、动漫服饰、主题公园等衍生产业的行业发展状况;
8家跨国企业及9家中国动漫企业分析,包括公司经营状况,主要动漫作品,经营模式、发展战略及业绩预测等。
Chinese animation industry has maintained the momentum of robust growth from 2014 on, thanks to the government's supportive policies on animation industry and booming Internet-based new media distribution channels. In 2014, the total output value of China’s animation industry exceeded RMB100 billion, up 14.84% from a year earlier.
The animation industry of China characterizes the following during 2014-2015:
The production of animation declined, but box-office earnings of animated movies kept going up. In 2014, China produced 138,579 minutes of domestic TV cartoons, down 32.31% year on year, the lowest level since 2009 and only half of the peak in 2011. There are two main reasons: 1) Fierce market competition resulted in slim profits for some animation firms to stay afloat. 2) Proposal for animation production transiting from quantity to quality put forward in the 12th Five-Year Plan (2011-2015) promoted local authorities to optimize their support schemes.
In 2014, a total of 45 animated movies were released in Chinese mainland theatres, generating total box office of nearly RMB3 billion, including about RMB1.9 billion contributed by 17 imported animated movies and RMB1.06 billion by 28 domestic ones.
The rise and prosperity of new media channels represented by mobile Internet and smart TV fueled the development of animation industry. The influence of Internet on the animation industry is reflected in the following three aspects: 1) New media channels are more demanding on the segmentation of animation content. Video websites have special column for animations. 2) Animation is endowed with the property of being social to meet people’s social needs, such as “barrage”, animation fairs, and animation communities. 3) New media provides demand for animation derivatives like games on desktop and mobile devices.
Take U17.com (a premier platform for original comics and animations) for example, its animated short “One Hundred Thousand Bad Jokes” was broadcast for hundreds of millions of times, and the movie of the same name released in early 2015 recorded a box office of RMB118 million.
Derivatives market size continued to expand. In 2014, the Chinese animation derivatives market scale grew by 19.7% year on year to RMB31.6 billion, or 31.6% of the entire animation industry (with a growth rate of 14.8%). Animation toys hold the highest proportion, more than half of the whole Chinese animation derivatives market size, followed by animation apparel and animation publishing with a share of 16% and 4%, respectively.
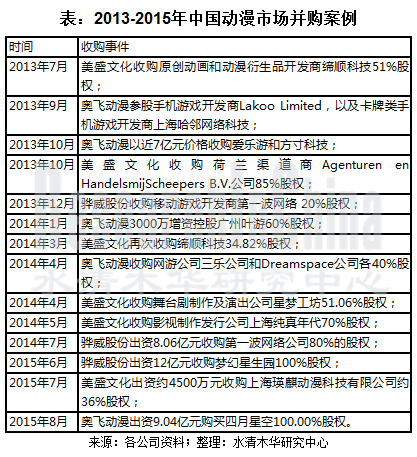
Major listed animation companies continuously extended industry chain with the aim of making a business presence throughout the whole industry via M&As.
M&As in the Chinese Animation Market, 2013-2015
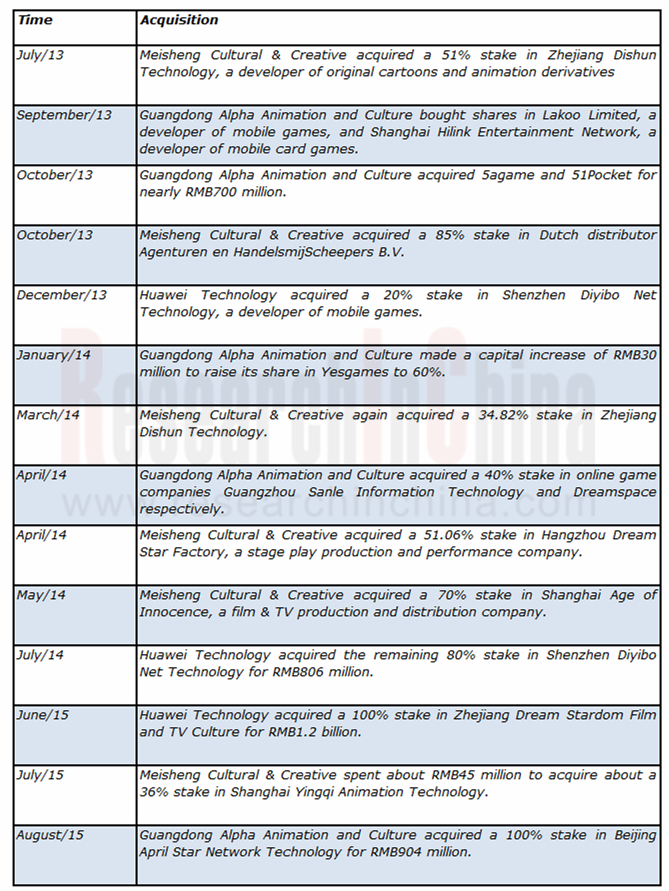
Source: Above-mentioned Companies, ResearchInChina
Global and China Animation Industry Report, 2015 highlights the followings:
 Overview of global animation industry, mainly involving support policies, industrial pattern, as well as development model and profit model of U.S., Japanese and South Korean animation industries; Overview of global animation industry, mainly involving support policies, industrial pattern, as well as development model and profit model of U.S., Japanese and South Korean animation industries;
Overview of China’s animation industry, including support policies, output value, type of company, competitive landscape, etc.
Analysis of the Chinese animation production and distribution markets, covering mainly TV animation, animated film, animation game, cartoon, new media market and animation industrial base;
Analysis of China’s animation derivatives industries, involving cartoon toys, animation apparel, theme park, etc.;
Operation, anime works, business model, development strategy, performance forecast of 8 multinational companies and 9 Chinese animation companies.
前言
第一章 动漫行业的基本介绍
1.1 基本概念
1.2 产业链
1.3 经营模式
1.4 经济特性
1.5 发展特点
第二章 全球动漫行业发展概况
2.1 整体发展
2.1.1 扶持政策
2.1.2 市场格局
2.2 美国
2.2.1 产业概况
2.2.2 发展历程
2.2.3 产业链分析
2.3 日本
2.3.1 产业概况
2.3.2 发展历程
2.3.3 产业链分析
2.4 韩国
第三章 中国动漫行业发展概况
3.1 政策扶持
3.2 行业产值
3.3 动漫企业分析
3.3.1 主要参与者
3.3.2 制作型公司
3.3.3 媒体型公司
3.3.4 整合运营型公司
3.4 竞争格局
3.4.1 海外企业在华布局
3.4.2 资本关注度
第四章 中国动漫制作和传播发行市场
4.1 电视动画
4.2 动漫电影
4.3 动漫游戏
4.4 漫画
4.5 新媒体市场
4.6 动漫产业基地
第五章 中国动漫衍生产业分析
5.1 整体概述
5.2 动漫玩具
5.3 动漫服饰
5.4 主题公园
5.5 品牌授权
5.5.1 市场规模
5.5.2 发展特点及存在的问题
5.5.3 发展趋势
第六章 国外动漫行业重点企业分析
6.1 Disney
6.1.1 公司简介
6.1.2 主要业务
6.1.3 发展历程
6.1.4 经营状况
6.1.5 业务模式
6.1.6 竞争优势
6.2 Bandai Namco Group
6.2.1 公司简介
6.2.2 发展历程
6.2.3 经营状况
6.2.4 业绩预测
6.2.5 发展战略
6.3 Hasbro
6.3.1 公司简介
6.3.2 发展历程
6.3.3 品牌介绍
6.3.4 经营状况
6.3.5 发展规划
6.4 DreamWorks
6.4.1 公司简介
6.4.2 经营状况
6.5 Pixar Animation
6.5.1 公司简介
6.5.2 发展历程
6.5.3 经营状况
6.6 Toei Animation
6.6.1 公司简介
6.6.2 发展历程
6.6.3 经营状况
6.7 Sotsu
6.7.1 公司简介
6.7.2 发展历程
6.7.3 经营状况
6.8 吉卜力工作室
第七章 中国动漫行业重点分析
7.1 奥飞动漫
7.1.1 公司简介
7.1.2 发展历程
7.1.3 经营状况
7.1.4 营收构成
7.1.5 毛利率
7.1.6 研发投入
7.1.7 竞争优势
7.1.8 收购四月星空100.00%股权
7.1.9 战略布局
7.1.10 业绩预测
7.2 美盛文化
7.2.1 公司简介
7.2.2 发展历程
7.2.3 产品介绍
7.2.4 经营状况
7.2.5 营收构成
7.2.6 毛利率
7.2.7 子公司、参股公司分析
7.2.8 收购瑛麒动漫
7.2.9 与阿里影业合作
7.2.10 业绩预测
7.3 骅威股份
7.3.1 公司简介
7.3.2 发展历程
7.3.3 经营状况
7.3.4 营收构成
7.3.5 毛利率
7.3.6 研发投入
7.3.7 客户及供应商
7.3.8 子公司、参股公司分析
7.3.9 公司收购
7.3.10 业绩预测
7.4 华强文化
7.4.1 公司简介
7.4.2 业务介绍
7.4.3 发展战略
7.5 淘米网络
7.5.1 公司简介
7.5.2 发展历程
7.5.3 业务介绍
7.5.4 经营状况
7.6 央视动画
7.7 中南卡通
7.7.1 公司简介
7.7.2 经营状况
7.7.3 主要客户
7.7.4 研发投入
7.7.5 与皇氏集团合作
7.8 炫动传播
7.8.1 公司简介
7.8.2 业务介绍
7.8.3 优势及劣势
7.9 腾讯动漫
第八章 市场总结与发展预测
8.1 市场总结
8.2 发展预测
8.2.1 驱动因素
8.2.2 行业产值预测
Preface
1. Overview of Animation Industry
1.1 Basic Concept
1.2 Industrial Chain
1.3 Business Model
1.4 Economic Characteristics
1.5 Features of Development
2. Development of Global Animation Industry
2.1 Overall
2.1.1 Support Policy
2.1.2 Market Pattern
2.2 United States
2.2.1 Overview
2.2.2 Development History
2.2.3 Industry Chain
2.3 Japan
2.3.1 Overview
2.3.2 Development History
2.3.3 Industry Chain
2.4 South Korea
3. Development of China’s Animation Industry
3.1 Policy Support
3.2 Output Value
3.3 Animation Enterprises
3.3.1 Major Participants
3.3.2 Production-based
3.3.3 Media-based
3.3.4 Integrated Operation-based
3.4 Competitive Landscape
3.4.1 Overseas Companies’ Layout in China
3.4.2 Attention from Capital
4. Chinese Animation Production and Distribution Markets
4.1 TV Animation
4.2 Animated Film
4.3 Animation Game
4.4 Cartoon
4.5 New Media Market
4.6 Animation Industry Base
5. China’s Animation Derivative Industry
5.1 Overview
5.2 Animation Toy
5.3 Anime Apparel
5.4 Theme Park
5.5 Brand Authorization
5.5.1 Market Scale
5.5.2 Characteristics and Existing Problems
5.5.3 Trends
6. Typical Companies in Global Animation Industry
6.1 Disney
6.1.1 Profile
6.1.2 Main Business
6.1.3 Development History
6.1.4 Operation
6.1.5 Business Model
6.1.6 Competitive Edges
6.2 Bandai Namco Group
6.2.1 Profile
6.2.2 Development History
6.2.3 Operation
6.2.4 Performance Forecast
6.2.5 Development Strategy
6.3 Hasbro
6.3.1 Profile
6.3.2 Development History
6.3.3 Brand Introduction
6.3.4 Operation
6.3.5 Development Planning
6.4 DreamWorks
6.4.1 Profile
6.4.2 Operation
6.5 Pixar Animation
6.5.1 Profile
6.5.2 Development History
6.5.3 Operation
6.6 Toei Animation
6.6.1 Profile
6.6.2 Development History
6.6.3 Operation
6.7 Sotsu
6.7.1 Profile
6.7.2 Development History
6.7.3 Operation
6.8 Studio Ghibli
7. Typical Enterprises in China's Animation Industry
7.1 Guangdong Alpha Animation and Culture Co., Ltd.
7.1.1 Profile
7.1.2 Development History
7.1.3 Operation
7.1.4 Revenue Structure
7.1.5 Gross Margin
7.1.6 R&D Costs
7.1.7 Competitive Edges
7.1.8 Full Acquisition of Beijing April Star Network Technology Co., Ltd.
7.1.9 Strategic Layout
7.1.10 Performance Forecast
7.2 Meisheng Cultural & Creative Corp., Ltd.
7.2.1 Profile
7.2.2 Development History
7.2.3 Products
7.2.4 Operation
7.2.5 Revenue Structure
7.2.6 Gross Margin
7.2.7 Subsidiaries and Joint-Stock Companies
7.2.8 Acquisition of Shanghai Yingqi Animation
7.2.9 Cooperation with Alibaba Pictures
7.2.10 Performance Forecast
7.3 Huawei Technology Co., Ltd.
7.3.1 Profile
7.3.2 Development History
7.3.3 Operation
7.3.4 Revenue Structure
7.3.5 Gross Margin
7.3.6 R&D Costs
7.3.7 Customers and Suppliers
7.3.8 Subsidiaries and Joint-Stock Companies
7.3.9 Acquisitions
7.3.10 Performance Forecast
7.4 Fantawild Holdings Inc.
7.4.1 Profile
7.4.2 Business
7.4.3 Development Strategy
7.5 Taomee Holdings Limited
7.5.1 Profile
7.5.2 Development History
7.5.3 Business
7.5.4 Operation
7.6 CCTV Animation Inc.
7.7 Zhejiang Zhongnan Animation Co. Ltd
7.7.1 Profile
7.7.2 Operation
7.7.3 Main Customers
7.7.4 R&D Costs
7.7.5 Cooperation with Royal Group
7.8 Toonmax Media Co., Ltd.
7.8.1 Profile
7.8.2 Business
7.8.3 Advantages and Disadvantages
7.9 Tencent Animation
8. Market Summary and Development Forecast
8.1 Market Summary
8.2 Development Forecast
8.2.1 Drivers
8.2.2 Output Value Forecast
图:动漫产业链
图:动漫产业经营模式
表:“产业文化化”与“文化产业化”两种模式之特点
表:美国及日本经典动漫形象蕴含的主题
表:经典动漫形象的播出情况
图:动漫产业关联效应
表:发达国家动漫产业扶持政策及效果
图:国外动漫产业扶持方法
图:全球动漫产业三大梯队
表:主要国家动漫产业发展对比
表:美国动漫产业发展历程
图:美国的动漫产业链
图:2002-2013年日本动漫市场结构
图:2002-2014年日本儿童家庭动漫和深夜电视动漫制作时长
表:日本动漫产业发展历程
图:日本动漫产业链
图:日本动漫产业投资链
表:中国动漫产业的扶持政策
图:2009-2014年中国动漫产业总值及同比增速
图:动漫产业参与者
表:中国动漫产业链主要代表公司
表:2007-2015年中国国内市场主要动漫形象及出品公司
表:中国动漫行业政府补贴情况
表:中国国内六大动漫卫视频道对比
表:中国动漫衍生品主要上市公司介绍
表:2014-2015年中国主要动漫衍生品企业营业收入与净利润
表:2014-2015年中国主要动漫衍生品企业营业收入与净利润增长
表:海外动漫企业在华布局
图:2014年中国动漫内容消费市场结构
图:2008-2014年中国国内动漫公司融资数量
图:2010-2015年中国国产动画片数量
图:2007-2015年中国国产动画片时长
图:2009-2015年中国动画电影数量
图:2008-2015年中国动画电影市场票房收入
图:2009-2015年中国国产动画电影票房收入占动画电影总票房收入的比例
图:2010-2014年中国票房超过5000万国产动画数量
图:2011-2015年中国网络游戏市场规模
图:2011-2015年中国网络游戏市场规模结构
表:腾讯动漫频道人气榜TOP10国产漫画作品
图:动漫的新媒体发行渠道
表:中国主流独立动漫网站介绍
图:中国人口各年龄阶段智能手机的持有状况
图:2009-2015年中国手机动漫市场规模
表:中国动漫产业基地的三种类型
表:中国动漫产业基地名录
表:中国动漫产业基地的运作模式
图:2009-2015年中国动漫衍生品市场规模
图:2014年中国动漫衍生品细分市场份额
图:2007-2015年中国动漫玩具市场规模及同比增长
图:2007-2015年中国动漫服饰市场规模
表:中国国内主要动漫服饰企业情况
图:全球迪士尼乐园分布
表:上海迪士尼客流量预测
图:深圳华强集团主题公园系列
表:2014年全球动漫品牌授权市场规模
表:迪士尼公司概况
表:迪斯尼公司主要业务介绍
图:迪士尼公司全球业务分布
表:迪士尼公司发展历程
图:2014-2015财年迪士尼公司主要财务指标
图:2014-2015财年迪士尼公司营业收入与营业利润(分业务)构成
图:迪斯尼品牌价值链
图:迪斯尼品牌产业结构
图:迪斯尼业务模式
图:Bandai Namco Group主要业务单元
表:Bandai Namco Group发展阶段
表:Bandai Namco Group大事件
图:2014-2015财年Bandai Namco Group主要财务指标
图:2014-2015财年Bandai Namco Group营业收入和营业利润(分业务)构成
图:2016财年第一季度Bandai Namco Group主要财务指标
图:2016财年第一季度Bandai Namco Group营业收入和营业利润(分业务)构成
图:2015-2016财年Bandai Namco Group主要财务指标预测
图:2015-2016财年Bandai Namco Group营业收入和营业利润(分业务)预测
图:Bandai Namco Group中期发展规划
图:孩子宝介绍
图:孩之宝业务产业链
表:孩之宝发展历程
图:孩之宝品牌发展阶段
图:孩之宝品牌介绍
图:2010-2015年孩之宝主要财务指标
图:2014-2015年前三季度孩之宝营业收入(分业务)构成
图:2014-2015年前三季度孩之宝营业收入(分产品)构成
图:孩之宝品牌化规划
图:2015年孩之宝重点推广品牌
表:1998-2015年梦工厂主要电影票房情况
表:Pixar Animation Studios发展历程
表:皮克斯主要动漫电影票房情况
表:2015-2019年皮克斯计划上映影片
图:Toei Animation基本信息
表:Toei Animation发展历程
图:东映动画动漫形象创作流程
图:Toei Animation业务介绍
图:Toei Animation全球业务分布
图:2010-2014财年Toei Animation主要财务指标
图:2015财年第一季度Toei Animation主要财务指标
图:Sotsu基本信息
表:Sotsu发展历程
表:Sotsu主要业务介绍
图:2012-2015财年Sotsu营业收入与利润
表:吉卜力工作室主要动漫作品票房情况
表:2011-2015年奥飞动漫发展历程
图:2009-2015年奥飞动漫营业收入与净利润
表:2010-2015年奥飞动漫营业收入(分业务)构成
图:2006-2014年奥飞动漫营业收入(分区域)构成
表:2010-2015年奥飞动漫毛利率(分业务)
表:2011-2015年奥飞动漫研发投入及占营业收入的比例
表:奥飞动漫业务产业链发展历程
表:2015-2017年奥飞动漫营业收入与净利润预测
表:美盛文化发展历程
表:美盛文化服饰系列产品
图:2010-2015年美盛文化营业收入与净利润
图:2009-2015年美盛文化营业收入(分业务)构成
图:2009-2015年美盛文化营业收入(分区域)构成
表:2010-2015年美盛文化毛利率
表:2015年上半年美盛文化主要子公司、参股公司运营数据
图:美盛文化与阿里影业的多唯合作
表:2015-2017年美盛文化营业收入与净利润预测
表:骅威股份发展历程
图:2009-2015年骅威股份营业收入与净利润
图:2009-2015年骅威股份营业收入(分业务)构成
图:2010-2015年骅威股份营业收入(分区域)构成
表:2010-2015年骅威股份毛利率(分产品)
表:2009-2014年骅威股份研发费用及占营业收入的比例
表:2014年骅威股份TOP5客户收入及占营业收入的比例
表:2014年骅威股份TOP5供应商及占采购总额的比例
表:2015年上半年骅威股份主要子公司、参股公司运营数据
表:2015-2017年骅威股份营业收入与净利润预测
图:华强文化产业基地
图:华强文化国内主题公园分布
表:华强文化文化内容产品及服务介绍
图:华强文化发展规划
表:淘米网络发展历程
表:淘米网络业务介绍
图:2014-2015年淘米网络主要运营指标
表:央视动画公司发展概况
图:中南卡通主要合作伙伴
表:2013-2015年中南卡通主要运营指标
表:2013-2014年中南卡通主营业务收入和毛利率(分业务)构成
图:2013-2014年中南卡通营业收入(分区域)构成
表:2015年上半年中南卡通来自TOP5客户收入及占营业收入的比例
表:2013-2015年中南卡通研发费用及占营业收入的比例
图:炫动传播业务架构
图:炫动传播合作伙伴
表:动漫产品传播渠道对比分析
图:1970-2014年中国城镇化率(%)
图:1952-2014年中国人口出生率
图:2015-2017年中国动漫行业产值预测
Animation Industry Chain
Business Model of Animation Industry
Characteristics of “Industrial Culturalization” and “Cultural Industrialization”
Themes Embodied in Classic Cartoon Images in U.S. and Japan
Broadcast of Classic Cartoon Images
Correlation Effects of Animation Industry
Support Policies on Animation Industry and Effects in Developed Nations
Support Measures on Animation Industry in Overseas Countries
Three Echelons of Global Animation Industry
Comparison of the Development of Animation Industry in Major Countries
Development History of Animation Industry in the United States
Animation Industry Chain in United States
Animation Market Structure in Japan, 2002-2013
Production Length of Child Family Animation and Late-night TV Animation in Japan, 2002-2014
Development History of Animation Industry in Japan
Animation Industry Chain in Japan
Investment Chain of Animation Industry in Japan
Support Policies on Animation Industry in China
Output Value and YoY Change of Animation Industry in China, 2009-2014
Major Participants in Animation Industry
Major Typical Companies in China’s Animation Industry Chain
Major Animation Images and Producers in China, 2007-2015
Government Subsidies to Animation Industry in China
Comparison of Six Animation Satellite TV Channels in China
Major Listed Companies in Animation Derivative Industry in China
Revenue and Net Income of Major Animation Derivatives Companies in China, 2014-2015
YoY Change in Revenue and Net Income of Major Animation Derivatives Companies in China, 2014-2015
Overseas Animation Companies’ Layout in China
Chinese Animation Content Consumer Market Structure, 2014
Number of Chinese Animation Companies that Had Been Financed, 2008-2014
Number of Chinese Cartoons, 2010-2015
Duration of Chinese Cartoons, 2007-2015
Number of Chinese Animated Films, 2009-2015
Box Office Revenue of the Chinese Animated Film Market, 2008-2015
Box Office Revenue Proportion of Domestic Animated Films to All Animated Films in China, 2009-2015
Number of Chinese Animated Films with Box Office Revenue of over RMB50 million, 2010-2014
Online Game Market Scale in China, 2011-2015
Structure of Online Game Market Scale in China, 2011-2015
Top10 Chinese Comic Works on ac.qq.com
New Media Distribution Channels for Animation
Mainstream Independent Animation Websites in China
Smartphone Ownership in China by Age Group
Mobile Animation Market Scale in China, 2009-2015
Three Types of Animation Industrial Bases in China
List of Animation Industrial Bases in China
Operation Models of Animation Industrial Bases in China
Market Scale of Animation Derivative in China, 2009-2015
Share of Animation Derivative Market Segments in China, 2014
Market Scale of Animation Toy in China, 2007-2015
Market Scale of Animation Apparel in China, 2007-2015
Major Domestic Animation Apparel Enterprises in China
Global Presence of Disneyland
Passenger Traffic Forecast of Shanghai Disneyland Park
Shenzhen Huaqiang’s Theme Parks
Global Animation Brand Authorization Market Scale, 2014
Profile of Disney
Main Businesses of Disney
Global Business Presence of Disney
Development History of Disney
Main Financial Metrics of Disney, FY2014-FY2015
Revenue and Operating Income Structure of Disney by Business, FY2014-FY2015
Brand Value Chain of Disneyland
Brand-based Industrial Structure of Disneyland
Business Model of Disneyland
Main Business Units of Bandai Namco Group
Development History of Bandai Namco Group
Milestones of Bandai Namco Group
Main Financial Metrics of Bandai Namco Group, FY2014-FY2015
Revenue and Operating Income Structure of Bandai Namco Group by Business, FY2014-FY2015
Main Financial Metrics of Bandai Namco Group, Q1 FY2016
Revenue and Operating Income of Bandai Namco Group by Business, Q1FY2016
Main Financial Metrics of Bandai Namco Group, FY2015-FY2016E
Revenue and Operating Income of Bandai Namco Group by Business, FY2015-FY2016E
Mid-term Development Planning of Bandai Namco Group
Profile of Hasbro
Business Industry Chain of Hasbro
Development History of Hasbro
Brand Development of Hasbro
Brands of Hasbro
Main Financial Metrics of Hasbro, 2010-2015
Revenue Structure of Hasbro by Business, 1Q-3Q2014-2015
Revenue Structure of Hasbro by Product, 1Q-3Q2014-2015
Hasbro’s Plan for Branding
Brands Vigorously Promoted by Hasbro, 2015
Box Office of Animated Films of DreamWorks, 1998-2015
Development History of Pixar Animation Studios
Box Office of Animated Films of Pixar Animation Studios
Pixar Animation Studios’ Animation Films Planned to Hit Screens, 2015-2019
Profile of Toei Animation
Development History of Toei Animation
Production Process of Cartoon Images of Toei Animation
Business of Toei Animation
Global Presence of Toei Animation
Main Financial Metrics of Toei Animation, FY2010-FY2014
Main Financial Metrics of Toei Animation, Q1FY2015
Profile of Sotsu
Development History of Sotsu
Main Businesses of Sotsu
Revenue and Operating Income of Sotsu, FY2012-FY2015
Box Office of Main Animated Films of Studio Ghibli
Development History of Guangdong Alpha Animation and Culture, 2011-2015
Revenue and Net Income of Guangdong Alpha Animation and Culture, 2009-2015
Revenue Structure of Guangdong Alpha Animation and Culture by Business, 2010-2015
Revenue Structure of Guangdong Alpha Animation and Culture by Region, 2006-2014
Gross Margin of Guangdong Alpha Animation and Culture by Business, 2010-2015
R&D Costs and % of Total Revenue of Guangdong Alpha Animation and Culture, 2011-2015
Development History of Business Industrial Chain of Guangdong Alpha Animation and Culture
Revenue and Net Income of Guangdong Alpha Animation and Culture, 2015-2017E
Development Course of Meisheng Cultural & Creative
Apparel Products of Meisheng Cultural &Creative
Revenue and Net Income of Meisheng Cultural & Creative, 2010-2015
Revenue Structure of Meisheng Cultural & Creative by Business, 2009-2015
Revenue Structure of Meisheng Cultural & Creative by Region, 2009-2015
Gross Margin of Meisheng Cultural & Creative, 2010-2015
Operating Data of Subsidiaries and Joint-Stock Companies of Meisheng Cultural & Creative, 2015H1
Multi-Dimensional Cooperation between Meisheng Cultural & Creative and Alibaba Pictures
Revenue and Net Income of Meisheng Cultural & Creative, 2015-2017E
Development History of Huawei Technology
Revenue and Net Income of Huawei Technology, 2009-2015
Revenue Structure of Huawei Technology by Business, 2009-2015
Revenue Structure of Huawei Technology by Region, 2010-2015
Gross Margin of Huawei Technology by Product, 2010-2015
R&D Costs and % of Total Revenue of Huawei Technology, 2009-2014
Huawei Technology’s Revenue from Top5 Customers and % of Total Revenue, 2014
Huawei Technology’ Procurement from Top5 Suppliers and % of Total Procurement, 2014
Operating Data of Subsidiaries and Joint-Stock Companies of Huawei Technology, 2015H1
Revenue and Net Income of Huawei Technology, 2015-2017E
Industrial Bases of Fantawild
Theme Parks of Fantawild in China
Culture Content Products and Services of Fantawild
Development Planning of Fantawild
Development History of Taomee
Businesses of Taomee
Key Operating Indicators of Taomee, 2014-2015
Development Overview of CCTV Animation
Partners of Zoland Animation
Key Operating Indicators of Zoland Animation, 2013-2015
Revenue and Gross Margin of Zoland Animation by Business, 2013-2014
Revenue Breakdown of Zoland Animation by Region, 2013-2014
Zoland Animation’s Revenue from Top5 Customers and % of Total Revenue, 2015H1
R&D Costs and % of Total Revenue of Zoland Animation, 2013-2015
Business Architecture of Toonmax Media
Partners of Toonmax Media
Comparison of Distribution Channels for Animation Products
Urbanization Rate in China, 1970-2014
Fertility Rate in China, 1952-2014
Output Value of China’s Animation Industry, 2015-2017E
如果这份报告不能满足您的要求,我们还可以为您定制报告,请 留言说明您的详细需求。
|