|
|
|
报告导航:研究报告—
生命科学—制药医疗
|
|
2015-2018年中国医院行业研究报告 |
 |
字数:6.4万 |
页数:160 |
图表数:162 |
|
中文电子版:8500元 |
中文纸版:4250元 |
中文(电子+纸)版:9000元 |
|
英文电子版:2500美元 |
英文纸版:2700美元 |
英文(电子+纸)版:2800美元 |
|
编号:ZLC-026
|
发布日期:2015-11 |
附件:下载 |
 |
|
|
在需求刺激下,中国医院数量从2011年的21979家增长至2015年5月底的26479家,总计增长4500家。其中,公立医院数量整体下降,民营医院数量增长迅速。
2011-2015年5月底,中国民营医院增加4713家,数量占比从38.4%增长至49.7%。但按收入算,中国民营医院占比仅为10%。
从医疗服务来看,2015年1-5月,中国医院诊疗人次达12.152亿人次,同比增长5.4%,虽然公立医院数量仅占医院总量的50.3%,但诊疗人次占比达89.1%。这主要是由民营医院本身规模较小、医师质量相对较差及民众认知度较低导致的。
目前,专科医院由于长期受到社会资本关注而投资不断,市场需求旺盛。2014年底,中国专科医院数量估计已达5449个,占医院总量的21.4%。其中,精神病医院、妇产医院、骨科医院、口腔医院、眼科医院数量相对较多;肿瘤医院收入相对最高;美容医院、眼科医院和口腔医院的利润率相对较高。
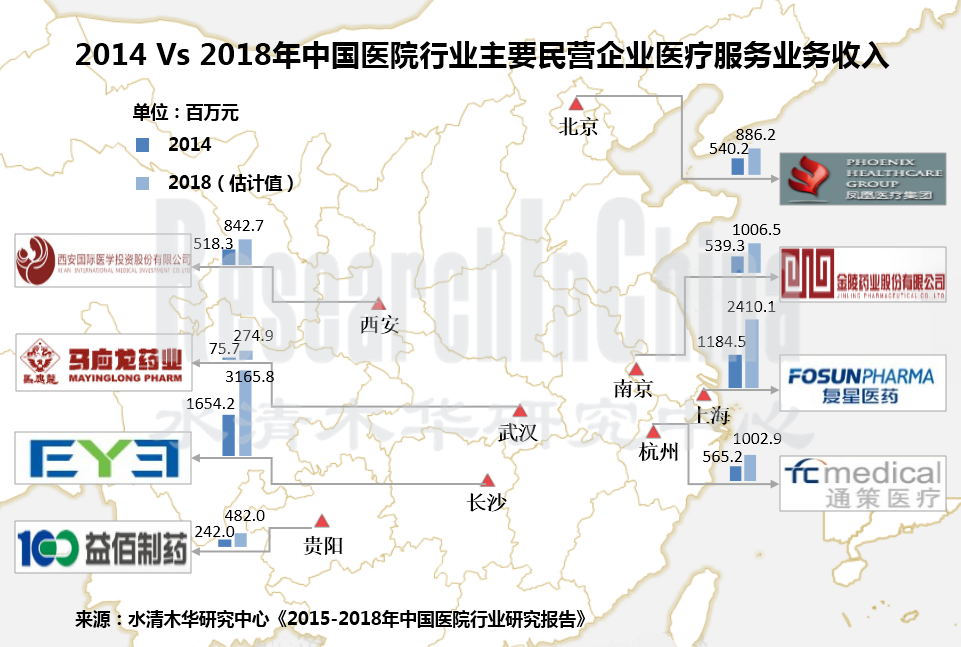
近几年,国家颁布一系列利好政策,鼓励民营资本进入医院产业,掀起了社会资本投资进入医疗服务领域的浪潮。目前,包括爱尔眼科、通策医疗、马应龙、复星医药、金陵药业、凤凰医疗等多家民企已涉足医疗服务领域。其中,爱尔眼科和复星医药的医疗服务业务发展相对较好。2015上半年,爱尔眼科和复星医药的医疗服务业务收入分别达11.75亿元和6.744亿元。
爱尔眼科是中国规模最大的眼科医疗连锁机构,已在全国建立了100余家专业眼科医院,年门诊量超过300万人。近两年,公司成立了4家产业并购基金,用于投资大健康行业,加大医院网点建设,以实现产业扩张。
复兴医药以药品制造与研发为主营,兼营医疗服务业务。公司近几年通过自建、并购、合营和联营等方式在医疗服务领域内持续扩张,医疗服务收入呈爆发式增长,2011-2014年,其医疗服务年均复合增长率达371.5%。2014年公司参与美中互利私有化项目,持有其42.927%股权,同时获得了其旗下的高端医疗服务品牌“和睦家”的掌握权。
《2015-2018年中国医院行业研究报告》主要包括以下内容:
 中国医院行业发展现状,包括医院数量、收入情况、医疗服务、竞争格局、总结与预测等; 中国医院行业发展现状,包括医院数量、收入情况、医疗服务、竞争格局、总结与预测等;
中国专科医院发展现状,包括总体运营情况、各类专科医院发展情况等;
中国医院行业发展预测分析,包括医保体系和城镇化对医院行业发展的影响等;
中国医院行业投资分析,包括政策分析、公立和民营医院对比、社会资本投资机会、外资医院发展模式等;
16家涉足医院行业的企业经营情况、医疗服务业务等。
Stimulated by the demand, the number of hospitals in China rose from 21,979 in 2011 to 26,479 at the end of May 2015, an increase of 4,500 in total. Among them, public hospitals showed an overall decline whereas private hospitals increased rapidly.
During the period from 2011 to late May2015, the number of private hospitals in China advanced 4,713, with the share up from 38.4% to 49.7%. But in point of revenue, China's private hospitals just accounted for 10%.
In terms of medical service, between January and May 2015, China saw 1.2152 billion hospital visits, up 5.4% from a year earlier. Although the number of public hospitals occupied only 50.3% of total hospitals, yet the public hospital visits represented up to 89.1%, which was mainly due to the fact that private hospitals are small in scale and have relatively poor treatment level and lower public awareness.
At present, more investment has gone to specialized hospitals, which have captured long-term attention from social capital, hence a great market demand. As of the end of 2014, the number of specialized hospitals in China were expected to reach 5,449, making up 21.4% of the total. Among them, mental hospitals, maternity hospitals, orthopaedic hospitals, stomatological hospitals, and ophthalmic hospitals constitute the mainstay. Tumor hospitals generated the most revenue while beauty hospitals, ophthalmic hospitals, and stomatological hospitals produced relatively higher profit margin.
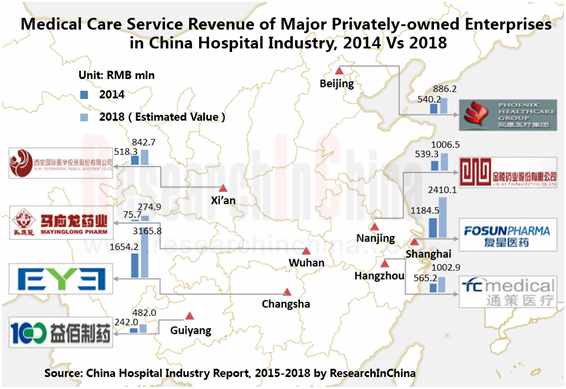
In recent years, the State has introduced a series of favorable policies designed to encourage private capital into the hospital industry, thus setting off a wave of social capital inrush to medical service. Currently, many private companies including Aier Eye Hospital Group, TC Medical, Mayinglong Pharm, Shanghai Fosun Pharmaceutical (Group), Jinling Pharmaceutical Company Limited, and Phoenix Healthcare Group have ventured into the field of medical service. Among them, Aier Eye Hospital Group and Shanghai Fosun Pharmaceutical (Group) achieved good results in business development. In H1 2015, the medical service revenue for the two companies totaled RMB1.175 billion and RMB674.4 million, respectively.
As China's largest ophthalmic medical chain institution, Aier Eye Hospital Group have established more than 100 professional ophthalmic hospitals throughout the country, with over 3 million outpatient visits annually. In the past two years, the company set up four industrial merger & acquisition funds used to invest in grand health industry, in the hope of increasing hospital outlets and achieving industrial expansion.
Fosun Pharma specializes in drug manufacturing and research and development meanwhile operating medical service business. In recent years, through self-building, mergers and acquisitions, joint venturing, and affiliation, the company has made continuous expansion in medical service and seen explosive growth in revenue from this field. In 2011-2014, the company’s medical service revenue registered a CAGR of 371.5%. In 2014, the company participated in the privatization of Chindex International, Inc. (“Chindex”), and upon the completion of the privatization transaction, Fosun Industrial held a 42.927% equity interest and at the same time owned “United Family Hospital”, a high-end brand for healthcare services under Chindex.
The report highlights the followings:
 Overview of China hospital industry, including number of hospitals, revenue, medical service, competition pattern, summary and forecast, etc.; Overview of China hospital industry, including number of hospitals, revenue, medical service, competition pattern, summary and forecast, etc.;
Status quo of specialized hospitals in China, including overall operation, development of specialized hospitals of all sorts, etc.;
Development prediction of China hospital industry, including the impact of medical insurance system and urbanization on hospital industry, etc.;
Investment in China hospital industry, including related policies, comparison of public and private hospitals, investment opportunities of social capital, and development model of foreign-funded hospitals, etc.;
Operation, and medical service business of 16 enterprises venturing into hospital industry.
第一章 中国医院行业概述
1.1 定义
1.2 分类
1.3 产业链
第二章 中国医院行业发展现状
2.1 医院概况
2.1.1 医院数量
2.1.2 分布情况
2.2 收入情况
2.2.1 总收入
2.2.2 综合医院
2.3 医疗服务
2.4 竞争格局
2.5 总结与预测
第三章 中国专科医院发展现状
3.1 专科医院总体情况
3.1.1 数量
3.1.2 收入
3.2 各类专科医院现状
3.2.1 眼科医院
3.2.2 口腔医院
3.2.3 整形外科及美容医院
3.2.4 妇产医院
3.2.5 儿童医院
3.2.6 肿瘤医院
第四章 中国医院行业发展预测分析
4.1 中国医疗保障发展现状
4.1.1 医保体系
4.1.2 医保覆盖率接近饱和
4.1.3 城乡居民大病保险
4.2 城镇化推动医院行业发展
4.2.1 城镇化发展现状
4.2.2 城镇化将优化医疗保健体系
4.2.3 推进异地医保结算
4.2.4 城镇化通过医疗保障体系贡献增量
4.2.5 医保基金结余率有望进一步降低
4.2.6 县医院医疗资源供给能力将提升
4.2.7 城镇化将推动政府投资城市医疗资源
第五章 中国医院行业投资分析
5.1 政策推动
5.2 公立医院与民营医院对比分析
5.2.1 公立医院占据主导地位
5.2.2 民营医院运营效率高
5.3 社会资本投资机会
5.3.1 专科医疗领域
5.3.2 综合性公立医院
5.4 外资医院发展方向及经营模式
5.4.1 外资医院在华现状
5.4.2 外资医院发展方向
5.4.3 外资医院经营方式
第六章 中国医院主要企业
6.1 爱尔眼科
6.1.1 公司简介
6.1.2 经营情况
6.1.3 营收构成
6.1.4 毛利率
6.1.5 研发与投资
6.1.6 医疗服务
6.1.7 预测与展望
6.2 通策医疗
6.2.1 公司简介
6.2.2 经营情况
6.2.3 营收构成
6.2.4 毛利率
6.2.5 医疗服务
6.2.6 预测与展望
6.3 马应龙
6.3.1 公司简介
6.3.2 经营情况
6.3.3 营收构成
6.3.4 毛利率
6.3.5 研发与投资
6.3.6 医疗服务
6.3.7 预测与展望
6.4 复星医药
6.4.1 公司简介
6.4.2 经营情况
6.4.3 营收构成
6.4.4 毛利率
6.4.5 研发与投资
6.4.6 医疗服务
6.4.7 预测与展望
6.5 金陵药业
6.5.1 公司简介
6.5.2 经营情况
6.5.3 营收构成
6.5.4 毛利率
6.5.5 研发与投资
6.5.6 医疗服务
6.5.7 预测与展望
6.6 新华医疗
6.6.1 公司简介
6.6.2 经营情况
6.6.3 营收构成
6.6.4 毛利率
6.6.5 研发与投资
6.6.6 医疗服务
6.6.7 预测与展望
6.7 国际医学
6.7.1 公司简介
6.7.2 经营情况
6.7.3 营收构成
6.7.4 医疗服务
6.7.5 预测与展望
6.8 福瑞股份
6.8.1 公司简介
6.8.2 经营情况
6.8.3 营收构成
6.8.4 医疗服务
6.8.5 预测与展望
6.9 健民集团
6.9.1 公司简介
6.9.2 经营情况
6.9.3 营收构成
6.9.4 医疗服务
6.9.5 预测与展望
6.10 泰和诚
6.10.1 公司简介
6.10.2 经营情况
6.10.3 医疗服务
6.10.4 预测与展望
6.11 凤凰医疗
6.11.1 公司简介
6.11.2 经营情况
6.11.3 医疗服务
6.11.4 预测与展望
6.12 益佰制药
6.12.1 公司简介
6.12.2 经营情况
6.12.3 医疗服务
6.12.4 预测与展望
6.13 康美药业
6.13.1 公司简介
6.13.2 经营情况
6.13.3 医疗服务
6.13.4 预测与展望
6.14 模塑科技
6.14.1 公司简介
6.14.2 经营情况
6.14.3 医疗服务
6.14.5 预测与展望
6.15 华润三九
6.15.1 公司简介
6.15.2 经营情况
6.15.3 医疗服务
6.16 百汇班底
6.16.1 公司简介
6.16.2 在华发展
1. Overview of China Hospital Industry
1.1 Definition
1.2 Classification
1.3 Industry Chain
2. Development of China Hospital Industry
2.1 Overview
2.1.1 Number of Hospitals
2.1.2 Distribution
2.2 Revenue
2.2.1 Total Revenue
2.2.2 General Hospitals
2.3 Medical Service
2.4 Competition Pattern
2.5 Summary and Forecast
3. Development of Specialized Hospitals in China
3.1 Overview
3.1.1 Number of Hospitals
3.1.2 Revenue
3.2 Status Quo of Specialized Hospitals of All Kinds
3.2.1 Ophthalmic Hospital
3.2.2 Stomatological Hospital
3.2.3 Orthopedics & Beauty Hospital
3.2.4 Maternity Hospital Obstetrics and Gynecology Hospital
3.2.5 Children’s Hospital
3.2.6 Tumor Hospital
4. Development Forecast of China Hospital Industry
4.1 Status Quo of China Medical Insurance
4.1.1 Medical Insurance System
4.1.2 Medical Insurance Close to Saturation
4.1.3 Medical Insurance for Serious Illness of Urban and Rural Residents
4.2 Urbanization Bolsters Development of the Hospital Industry
4.2.1 Status Quo of Urbanization in China
4.2.2 Urbanization Expects to Optimize Medical Insurance System
4.2.3 Trans-regional Medical Insurance Settlement is to be advanced
4.2.4 Urbanization Incrementation Depends on the Contribution of Medical Insurance System
4.2.5 Medical Insurance Fund Balance Rate Will See Further Decrease
4.2.6 Medical Resource Supply of County-Level Hospitals Will Improve
4.2.7 Urbanization Will Encourage Central Government to Invest in Urban Medical Resources
5. Investment in China Hospital Industry
5.1 Impetus Given by Policies
5.2 Comparison of Public and Private Hospitals
5.2.1 Public Hospitals Play a Leading Role
5.2.2 Private Hospitals Run with Efficiency
5.3 Investment Opportunities of Social Capital
5.3.1 Specialized Medical Field
5.3.2 General Public Hospitals
5.4 Development Orientation and Business Model of Foreign Hospitals
5.4.1 Status Quo of Foreign Hospitals in China
5.4.2 Development Direction
5.4.3 Business Practice
6. Major Private Hospitals in China
6.1 Aier Eye Hospital Group
6.1.1 Profile
6.1.2 Operation
6.1.3 Revenue Structure
6.1.4 Gross Margin
6.1.5 R&D and Investment
6.1.6 Medical Service
6.1.7 Prediction and Outlook
6.2 TC Medical
6.2.1 Profile
6.2.2 Operation
6.2.3 Revenue Structure
6.2.4 Gross Margin
6.2.5 Medical Service
6.2.6 Prediction and Outlook
6.3 Mayinglong Pharm
6.3.1 Profile
6.3.2 Operation
6.3.3 Revenue Structure
6.3.4 Gross Margin
6.3.5 R&D and Investment
6.3.6 Medical Service
6.3.7 Prediction and Outlook
6.4 Shanghai Fosun Pharmaceutical (Group)
6.4.1 Profile
6.4.2 Operation
6.4.3 Revenue Structure
6.4.4 Gross Margin
6.4.5 R&D and Investment
6.4.6 Medical Service
6.4.7 Prediction and Outlook
6.5 Jinling Pharmaceutical Company Limited
6.5.1 Profile
6.5.2 Operation
6.5.3 Revenue Structure
6.5.4 Gross Margin
6.5.5 R&D and Investment
6.5.6 Medical Service
6.5.7 Prediction and Outlook
6.6 Shinva Medical
6.6.1 Profile
6.6.2 Operation
6.6.3 Revenue Structure
6.6.4 Gross Margin
6.6.5 R&D and Investment
6.6.6 Medical Service
6.6.7 Prediction and Outlook
6.7 Xi’an International Medical Investment Co., Ltd.
6.7.1 Profile
6.7.2 Operation
6.7.3 Revenue Structure
6.7.4 Medical Service
6.7.5 Prediction and Outlook
6.8 Inner Mongolia Furui Medical Science
6.8.1 Profile
6.8.2 Operation
6.8.3 Revenue Structure
6.8.4 Medical Service
6.8.5 Prediction and Outlook
6.9 Wuhan Jianmin Pharmaceutical Groups Corp.
6.9.1 Profile
6.9.2 Operation
6.9.3 Revenue Structure
6.9.4 Medical Service
6.9.5 Prediction and Outlook
6.10 Concord Medical Services Holdings Limited
6.10.1 Profile
6.10.2 Operation
6.10.3 Medical Service
6.10.4 Prediction and Outlook
6.11 Phoenix Healthcare Group
6.11.1 Profile
6.11.2 Operation
6.11.3 Medical Service
6.11.4 Prediction and Outlook
6.12 Guizhou Yibai Pharmaceutical
6.12.1 Profile
6.12.2 Operation
6.12.3 Medical Service
6.12.4 Prediction and Outlook
6.13 Kangmei Pharmaceutical
6.13.1 Profile
6.13.2 Operation
6.13.3 Medical Service
6.13.4 Prediction and Outlook
6.14 JNMPT
6.14.1 Profile
6.14.2 Operation
6.14.3 Medical Service
6.14.5 Prediction and Outlook
6.15 China Resources Sanjiu Medical & Pharmaceutical Co., Ltd.
6.15.1 Profile
6.15.2 Operation
6.15.3 Medical Service
6.16 Parkway Pantai
6.16.1 Profile
6.16.2 Development in China
图:中国医院行业产业链
图:2009-2015年中国医院数量及增长量
图:2009-2015年中国医院数量(按等级)
图:截至2015年5月底中国医院数量占比(按等级)
图:2009-2015年中国医院数量(按经济类型)
图:2009-2015年中国医院数量占比(按经济类型)
表:2009-2014年中国医院数量(按类型)
表:截至2015年5月底中国医院数量(分地区)
图:2009-2014年中国医院总收入及同比增长率
图:2009-2014年中国医院利润率
图:2013年中国医院收入构成(按来源)
图:2013年中国医院收入构成(按类别)
图:2009-2014年中国综合医院平均收入及同比增长率
图:2009-2013年中国平均每所综合医院收入(分业务)
图:2009-2015年中国医院诊疗人次
图:2009-2015年中国医院病床使用率
图:2012-2015年中国医院诊疗人次(按经济类型)
图:2015年1-5月中国医院诊疗人次构成(按经济类型)
图:2012-2015年中国医院诊疗人次(按医院等级)
图:2015年1-5月中国医院诊疗人次构成(按医院等级)
图:2009-2015年中国医院病床使用率(按医院等级)
图:2013年中国医疗机构公立和民营医院数量占比(按种类)
图:2012-2015年中国医院行业主要民营企业医疗服务业务收入
图:2014-2018E中国医院行业主要民营企业营业收入
图:2014-2018E中国医院数量及增长数量
图:2014-2018E中国专科医院数量及占医院总量比重
图:2014-2018E中国医院收入及同比增长率
图:2014-2018E中国医院收入(按经济类型)
图:2014-2018E中国专科医院收入及占医院总收入比重
图:2009-2014年中国专科医院数量及占医院总量比重
图:2009-2014年中国专科医院数量占比(按经济类型)
表:2010-2013年中国专科医院数量(按种类)
图:2009-2014年中国专科医院收入及收入占比
表:2010-2013年中国专科医院收入(按种类)
表:2010-2013年中国专科医院利润率(按种类)
图:2009-2014年中国眼科医院数量(按经济类型)
表:2006-2013年中国眼科医院总收入及利润
表:2006-2013年中国眼科医院病床使用率及医师服务效率
图:2009-2014年中国口腔医院数量(按经济类型)
表:2006-2013年中国口腔医院总收入及利润
表:2006-2013年中国口腔医院病床使用率及医师工作量
表:2015年中国主要民营口腔医疗机构及其连锁数量、分布
图:2009-2014年中国整形外科及美容医院数量(按经济类型)
表:2006-2013年中国整形外科及美容医院总收入及利润
图:2009-2014年中国妇产医院数量(按经济类型)
表:2006-2013年中国妇产医院总收入及利润
表:2006-2013年中国妇产医院病床使用率及医师工作量
图:2009-2014年中国儿童医院数量(按经济类型)
表:2006-2013年中国儿童医院总收入及利润
表:2006-2013年儿童医院病床使用率及医师工作量
图:2009-2014年中国肿瘤医院数量(按经济类型)
表:2006-2013年中国肿瘤医院总收入及利润
表:2006-2013年中国肿瘤医院病床使用率及医师工作量
表:中国医保体系构成
图:2008-2014年中国城镇医保参保人数
图:2000-2014年中国城镇化率
图:2005-2014年中国医疗保健支出构成
图:2005-2014年中国城镇职工医保与新农合基金结余率
表:2009-2014年中国县级医院建设扶持政策
表:1985-2014年中国社会资本进入医疗服务领域里程碑事件
表:2009-2015年中国社会资本进入医疗服务领域相关政策
表:中国民营医院与公立医院政策方面差别
图:中国公立医院委托代理链
图:2008-2014年中国公立医院收入及市场份额
图:2008-2014年中国民营医院收入及市场份额
表:中国主要医疗服务专科项目比较
表:中国医疗服务体系市场化趋势
表:中国公立医院既有产权制度改革模式
表:1999-2015年中国社会资本试水公立医院改制部分案例
表:中国部分中外合作经营医院合作方及主要医疗服务
表:中国部分外资主导合资医院合作方及主要服务
图:2011-2015年爱尔眼科营业收入及净利润
表:2015上半年爱尔眼科主要子公司及其净利润
表:2009-2015年爱尔眼科营业收入(分业务)
图:2009-2014年爱尔眼科营业收入(分地区)
图:2009-2014年爱尔眼科营业收入构成(分地区)
表:2009-2014年爱尔眼科毛利率(分业务)
图:2012-2014年爱尔眼科研发支出及占总营收比重
图:2009-2015年爱尔眼科医疗服务收入及占总营收比重
图:2014-2018E爱尔眼科营业收入及净利润
图:2011-2015年通策医疗营业收入及净利润
图:2012-2015年通策医疗营业收入(分业务)
图:2012-2015年通策医疗营业收入(分地区)
图:2012-2015年通策医疗营业收入构成(分地区)
图:2012-2015年通策医疗毛利率
图:2012-2015年通策医疗毛利率(分业务)
图:通策医疗客户定位
表:2013-2014年通策医疗主要子公司营业收入及净利润
图:2014-2018E通策医疗营业收入及净利润
图:2011-2015年马应龙营业收入及净利润
图:2012-2015年马应龙营业收入(分产品)
图:2012-2015年马应龙营业收入构成(分产品)
图:2012-2015年马应龙营业收入(分地区)
图:2012-2015年马应龙营业收入构成(分地区)
图:2012-2015年马应龙毛利率(分产品)
图:2012-2015年马应龙研发支出及占总营收比重
表:2015年马应龙重点研发项目
表:马应龙旗下肛肠医院建立方式及股权占比
图:2014-2018E马应龙营业收入及净利润
图:2011-2015年复星医药营业收入及净利润
图:2011-2015年复星医药营业收入(分业务)
图:2011-2015年复星医药营业收入构成(分业务)
图:2011-2015年复星医药营业收入(分地区)
图:2011-2015年复星医药营业收入构成(分地区)
图:2011-2015年复星医药毛利率(分业务)
图:2012-2015年复星医药研发支出及占总营收比重
表:2015年复星医药非公开发行股份数量及认购金额
图:2011-2015年复星医药医疗服务收入及占总营收比重
图:2014-2018E复星医药营业收入及净利润
图:2011-2015年金陵药业营业收入及净利润
图:2011-2015年金陵药业营业收入(分产品)
图:2011-2015年金陵药业营业收入构成(分产品)
图:2012-2015年金陵药业营业收入(分地区)
图:2012-2015年金陵药业营业收入构成(分地区)
图:2011-2015年金陵药业毛利率(分产品)
图:2012-2015年金陵药业研发支出及占总营收比重
图:2011-2015年金陵药业医疗服务收入及占总营收比重
图:2014-2018E金陵药业营业收入及净利润
图:2011-2015年新华医疗营业收入及净利润
图:2011-2015年新华医疗营业收入(分产品)
图:2011-2015年新华医疗营业收入构成(分产品)
图:2011-2015年新华医疗营业收入(分地区)
图:2011-2015年新华医疗营业收入构成(分地区)
图:2011-2015年新华医疗毛利率(分产品)
图:2012-2014年新华医疗研发支出及占总营收比重
图:2014-2018E新华医疗营业收入及净利润
图:2011-2015年国际医学营业收入及净利润
图:2012-2015年国际医学营业收入(分行业)
图:2012-2015年国际医学营业收入构成(分行业)
图:2011-2015年国际医学营业收入(分地区)
图:2011-2015年国际医学营业收入构成(分地区)
图:2012-2015年国际医学医疗服务收入及占总营收比重
图:2011-2015年国际医学营业收入及净利润
表:2015年国际医学非公开发行股票发行对象及其获配股数、认购金额
图:2014-2018E国际医学营业收入及净利润
图:2011-2015年福瑞股份营业收入及净利润
图:2011-2015年福瑞股份营业收入(分产品)
图:2011-2015年福瑞股份营业收入构成(分产品)
图:2014-2018E福瑞股份营业收入及净利润
图:2011-2015年健民集团营业收入及净利润
图:2012-2015年健民集团营业收入(分行业)
图:2012-2015年健民集团营业收入构成(分行业)
图:2011-2015年健民集团营业收入(分地区)
图:2011-2015年健民集团营业收入构成(分地区)
图:2014-2018E健民集团营业收入及净利润
图:2011-2015年泰和诚营业收入及净利润
图:泰和诚服务网络覆盖地区
图:2014-2018E泰和诚营业收入及净利润
图:2011-2015年凤凰医疗营业收入及净利润
图:2011-2015年凤凰医疗综合医院服务营业收入及同比增长率
图:2014年凤凰医疗医院管理服务营业收入构成(分医院)
图:2014-2018E凤凰医疗营业收入及净利润
图:2011-2015年益佰制药营业收入及净利润
图:2011-2015年益佰制药医疗服务营业收入及占总营收比重
图:2014-2018E益佰制药营业收入及净利润
图:2011-2015年康美药业营业收入及净利润
图:2014-2018E康美药业营业收入及净利润
图:2011-2015年模塑科技营业收入及净利润
图:2014-2018E模塑科技营业收入及净利润
图:2011-2015年华润三九营业收入及净利润
图:2009-2013年华润三九医疗服务收入及同比增长
表:百汇班底在华医疗中心及服务
China’s Hospital Industry Chain
Number and Increment of Hospitals in China, 2009-2015
Number of Hospitals in China by Level, 2009-2015
Percentage of Hospitals in China by Level as of the end of May 2015
Number of Hospitals in China by Economic Type, 2009-2015
Number of Hospitals in China by Economic Type, 2009-2015
Number of Hospitals in China by Type, 2009-2014
Number of Hospitals in China by Region as of the end of May 2015
Total Revenue and YoY Growth of Hospitals in China 2009-2014
Gross Margin of Hospitals in China, 2009-2014
Revenue Structure of China Hospital Industry by Source, 2013
Revenue Structure of China Hospital Industry by Type, 2013
Average Revenue and YoY Growth of General Hospitals in China 2009-2014
Average Revenue of Each General Hospital in China by Business, 2009-2013
Number of Visits to China’s Hospitals, 2009-2015
Bed Utilization in China’s Hospitals, 2009-2015
Number of Visits to China’s Hospitals by Economic Type, 2012-2015
Structure of Chinese Hospital Visits by Economic Type, Jan.-May, 2015
Number of Visits to China’s Hospitals by Hospital Level, 2012-2015
Structure of Chinese Hospital Visits by Hospital Level, Jan.-May, 2015
Bed Utilization in China’s Hospitals by Hospital Level, 2009-2015
Proportion of Public Medical Institutions and Private Hospitals by Type, 2013
Medical Service Revenue of Major Private Hospitals in China, 2012-2015
Revenue of Major Chinese Private Hospitals, 2014-2018E
Number and Increment of Hospitals in China, 2014-2018E
Number of Specialized Hospitals and % of Total Hospitals in China, 2014-2018E
Revenue and YoY Growth of Hospitals in China, 2014-2018E
Revenue of Hospitals in China by Economic Type, 2014-2018E
Revenue from Specialized Hospitals and % of Total Revenue in China, 2014-2018E
Number of Specialized Hospitals and % of Total Hospitals in China, 2009-2014
Proportion of Specialized Hospitals in China by Economic Type, 2009-2014
Number of Specialized Hospitals in China by Type, 2010-2013
Proportion of Specialized Hospitals in China by Revenue, 2009-2014
Revenue from Specialized Hospitals in China by Type, 2010-2013
Operating Margin of Specialized Hospitals in China by Type, 2010-2013
Number of Ophthalmic Hospitals in China by Economic Type, 2009-2014
Total Revenue and Profits of Ophthalmic Hospitals in China, 2006-2013
Utilization of Hospital Beds and Service Efficiency of Doctors of Ophthalmic Hospitals in China, 2006-2013
Number of Stomatological Hospitals in China by Economic Type, 2009-2014
Total Revenue and Profits of Stomatological Hospitals in China, 2006-2013
Utilization of Hospital Beds and Workload of Doctors of Stomatological Hospitals in China, 2006-2013
Number and Distribution of Major Private Stomatological Medical Institutions and Their Chains in China, 2015
Plastic Surgery & Cosmetic Hospitals in China by Economic Type, 2009-2014
Total Revenue and Profits of Plastic Surgery & Cosmetic Hospitals in China, 2006-2013
Number of Maternity Hospitals in China by Economic Type, 2009-2014
Total Revenue and Profits of Maternity Hospitals in China, 2006-2013
Utilization of Hospital Beds and Workload of Doctors of Maternity Hospitals in China, 2006-2013
Number of Children’s Hospitals in China by Economic Type, 2009-2014
Total Revenue and Profits of Children’s Hospitals in China, 2006-2013
Utilization of Hospital Beds and Workload of Doctors of Children’s Hospitals, 2006-2013
Number of Tumor Hospitals in China by Economic Type, 2009-2014
Total Revenue and Profits of Tumor Hospitals in China, 2006-2013
Utilization of Hospital Beds and Workload of Doctors of Tumor Hospitals in China, 2006-2013
Structure of Medical Insurance System in China
Population Covered under China’s Urban Medical Insurance, 2008-2014
Urbanization Rate of China, 2000-2014
China’s Healthcare Expenditure Structure, 2005-2014
Medical Insurances of China’s Urban Workers and Balance Rate of New Rural Cooperative Medical System, 2005-2014
Favorable Polices on the Construction of County-Level Hospitals, 2009-2014
Landmark Events on Social Capitals Flowing to Medical Service Field in China, 1985-2014
Policies on Social Capitals Flowing to Medical Service Field in China, 2009-2015
Differences in Policies on China’s Private and Public Hospitals
Entrustment Chain of Public Hospitals in China
Revenue and Market Share of Public Hospitals in China, 2008-2014
Revenue and Market Share of Private Hospitals in China, 2008-2014
Comparison of China’s Major Medical Service-related Special projects
Trends towards Marketization of Medical Service System in China
Reform Mode of Established Property Rights System of Public Hospitals
Pilot Cases of China’s Social Capitals Contributing to Public Hospital Restructuring, 1999-2015
Partners and Major Medical Treatment Services of Sino-Foreign Joint Ventures in China
Partners and Major Services of Sino-Foreign Joint Ventures in China
Revenue and Net Income of Aier Eye Hospital Group, 2011-2015
Net Income of Aier Eye Hospital Group’s Major Subsidiaries , 2015H1
Revenue of Aier Eye Hospital Group by Business, 2009-2015
Revenue of Aier Eye Hospital Group by Region, 2009-2014
Revenue Structure of Aier Eye Hospital Group by Region, 2009-2014
Gross Margin of Aier Eye Hospital Group by Business,2009-2014
R&D Costs and % of Total Revenue of Aier Eye Hospital Group, 2012-2014
Medical Service Revenue and % of Total of Aier Eye Hospital Group, 2009-2015
Revenue and Net Income of Aier Eye Hospital Group, 2014-2018E
Revenue and Net Income of TC Medical, 2011-2015
Revenue of TC Medical by Business, 2012-2015
Revenue of TC Medical by Region, 2012-2015
Revenue Structure of TC Medical by Region, 2012-2015
Gross Margin of TC Medical, 2012-2015
Gross Margin of TC Medical by Business, 2012-2015
Client Orientation of TC Medical
Revenue and Net Income of TC Medical’s Major Subsidiaries, 2013-2014
Revenue and Net Income of TC Medical, 2014-2018E
Revenue and Net Income of Mayinglong Pharm, 2011-2015
Revenue of Mayinglong Pharm by Product, 2012-2015
Revenue Structure of Mayinglong Pharm by Product, 2012-2015
Revenue of Mayinglong Pharm by Region, 2012-2015
Revenue Structure of Mayinglong Pharm by Region, 2012-2015
Gross Margin of Mayinglong Pharm by Product, 2012-2015
R&D Costs and % of Total Revenue of Mayinglong Pharm, 2012-2015
Key R&D Projects of Mayinglong Pharm, 2015
Establishment Mode and Equity Structure of Anorectum Hospitals under Mayinglong Pharm
Revenue and Net Income of Mayinglong Pharm, 2014-2018E
Revenue and Net Income of Shanghai Fosun Pharmaceutical (Group), 2011-2015
Revenue of Shanghai Fosun Pharmaceutical (Group) by Business, 2011-2015
Revenue Structure of Shanghai Fosun Pharmaceutical (Group) by Business, 2011-2015
Revenue of Shanghai Fosun Pharmaceutical (Group) by Region, 2011-2015
Revenue Structure of Shanghai Fosun Pharmaceutical (Group) by Region, 2011-2015
Gross Margin of Shanghai Fosun Pharmaceutical (Group) by Business, 2011-2015
R&D Costs and % of Total Revenue of Shanghai Fosun Pharmaceutical (Group), 2012-2015
Number and Subscription Amount of Shares through Private Placement of Shanghai Fosun Pharmaceutical (Group), 2015
Medical Service Revenue and % of Total of Shanghai Fosun Pharmaceutical (Group), 2011-2015
Revenue and Net Income of Shanghai Fosun Pharmaceutical (Group), 2014-2018E
Revenue and Net Income of Jinling Pharmaceutical, 2011-2015
Revenue of Jinling Pharmaceutical by Product, 2011-2015
Revenue Structure of Jinling Pharmaceutical by Product, 2011-2015
Revenue of Jinling Pharmaceutical by Region, 2012-2015
Revenue Structure of Jinling Pharmaceutical by Region, 2012-2015
Gross Margin of Jinling Pharmaceutical by Product, 2011-2015
R&D Costs and % of Total Revenue of Jinling Pharmaceutical, 2012-2015
Medical Service Revenue and % of Total of Jinling Pharmaceutical, 2011-2015
Revenue and Net Income of Jinling Pharmaceutical, 2014-2018E
Revenue and Net Income of Shinva Medical, 2011-2015
Revenue of Shinva Medical by Product, 2011-2015
Revenue Structure of Shinva Medical by Product, 2011-2015
Revenue of Shinva Medical by Region, 2011-2015
Revenue Structure of Shinva Medical by Region, 2011-2015
Gross Margin of Shinva Medical by Product, 2011-2015
R&D Costs and % of Total Revenue of Shinva Medical, 2012-2014
Revenue and Net Income of Shinva Medical, 2014-2018E
Revenue and Net Income of Xi'an International Medical Investment, 2011-2015
Revenue of Xi'an International Medical Investment by Segment, 2012-2015
Revenue Structure of Xi'an International Medical Investment by Segment, 2012-2015
Revenue of Xi'an International Medical Investment by Region, 2011-2015
Revenue Structure of Xi'an International Medical Investment by Region, 2011-2015
Medical Service Revenue and % of Total of Xi'an International Medical Investment, 2012-2015
Revenue and Net Income of Xi'an International Medical Investment, 2011-2015
Issue Objects for the Private Placement, Their Placement Shares, and Subscription Amount of Xi'an International Medical Investment, 2015
Revenue and Net Income of Xi'an International Medical Investment, 2014-2018E
Revenue and Net Income of Inner Mongolia Furui Medical Science, 2011-2015
Revenue of Inner Mongolia Furui Medical Science by Product, 2011-2015
Revenue Structure of Inner Mongolia Furui Medical Science by Product, 2011-2015
Revenue and Net Income of Inner Mongolia Furui Medical Science, 2014-2018E
Revenue and Net Income of Wuhan Jianmin Pharmaceutical Groups Corp., 2011-2015
Revenue of Wuhan Jianmin Pharmaceutical Groups Corp. by Segment, 2012-2015
Revenue Structure of Wuhan Jianmin Pharmaceutical Groups Corp. by Segment, 2012-2015 .
Revenue of Wuhan Jianmin Pharmaceutical Groups Corp. by Region, 2011-2015
Revenue Structure of Wuhan Jianmin Pharmaceutical Groups Corp. by Region, 2011-2015
Revenue and Net Income of Wuhan Jianmin Pharmaceutical Groups Corp., 2014-2018E
Revenue and Net Income of Concord Medical Services Holdings Limited, 2011-2015
Coverage of Service Network of Concord Medical Services Holdings Limited
Revenue and Net Income of Concord Medical Services Holdings Limited, 2014-2018E
Revenue and Net Income of Phoenix Healthcare Group, 2011-2015
General Hospital Service Revenue and YoY Growth of Phoenix Healthcare Group, 2011-2015
Hospital Management Service Revenue Structure of Phoenix Healthcare Group by Hospital, 2014
Revenue and Net Income of Phoenix Healthcare Group, 2014-2018E
Revenue and Net Income of Guizhou Yibai Pharmaceutical, 2011-2015
Medical Service Revenue and % of Total of Guizhou Yibai Pharmaceutical, 2011-2015
Revenue and Net Income of Guizhou Yibai Pharmaceutical, 2014-2018E
Revenue and Net Income of Kangmei Pharmaceutical, 2011-2015
Revenue and Net Income of Kangmei Pharmaceutical, 2014-2018E
Revenue and Net Income of JNMPT, 2011-2015
Revenue and Net Income of JNMPT, 2014-2018E
Revenue and Net Income of China Resources Sanjiu Medical & Pharmaceutical Co., 2011-2015
Medical Service Revenue and YoY Growth of China Resources Sanjiu Medical & Pharmaceutical Co., 2009-2013
Parkway Pantai Medical’s Centers and Services in China
如果这份报告不能满足您的要求,我们还可以为您定制报告,请 留言说明您的详细需求。
|