|
|
|
报告导航:研究报告—
制造业—材料
|
|
2015-2018年全球及中国钕铁硼行业研究报告 |
 |
字数:3.0万 |
页数:109 |
图表数:151 |
|
中文电子版:8500元 |
中文纸版:4250元 |
中文(电子+纸)版:9000元 |
|
英文电子版:2300美元 |
英文纸版:2500美元 |
英文(电子+纸)版:2600美元 |
|
编号:ZHP030
|
发布日期:2015-11 |
附件:下载 |
 |
|
|
钕铁硼是普钕金属、硼铁等的合金,属于第三代稀土永磁材料,具有高磁能积、高矫顽力以及高能量密度的优点,是目前性价比最佳的磁体,享有“磁王”的美誉。
得益于中国钕铁硼产业的快速发展,全球钕铁硼产量从2000年的1.4万吨增长至2014年的12.7万吨,年均复合增长率为13.4%。2015年,受中国取消稀土出口配额的带动,全球钕铁硼产量将继续增长至14.3万吨。
中国是全球第一大钕铁硼生产国,2014年产量达11.2万吨(占全球总产量的88.1%),同比增长19.0%。2015年,受钕铁硼价格持续下滑的影响,全年产量将同比增长13.5%,至12.7万吨。
目前,中国75%左右的钕铁硼应用在电声器件、磁选、消费电子等传统领域,而变频空调、新能源汽车、节能电梯等新型应用领域只占1/4。但是从需求增速看,传统应用领域需求较为平稳,而新型应用领域的增长较为显著,尤其是新能源汽车领域。据统计,2014年中国新能源汽车钕铁硼用量为439吨(新能源汽车产量为7.9万辆),2015年随着新能源汽车产量的大幅增长(预计达到17.8万辆),需求量将进一步增长至946吨。
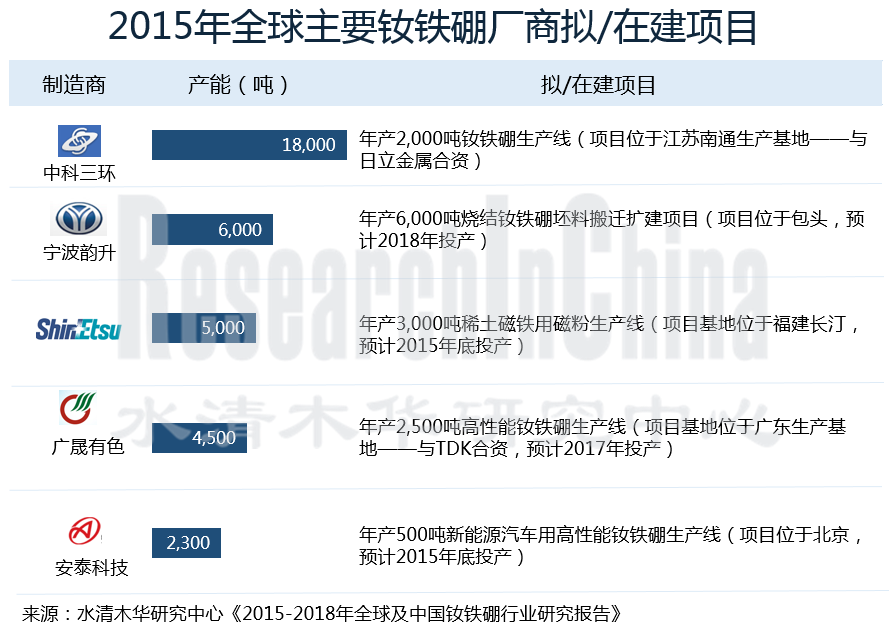
得益于下游市场需求的稳步增长,以及上游丰富的原材料资源,目前世界主要钕铁硼企业均已布局中国,并不断扩张现有产能。
日立金属:日本最大的钕铁硼制造商,生产基地主要位于日本。2015年6月,决定与中科三环共同在江苏设立“日立金属三环磁材(南通)有限公司”。项目一期建设年产2,000吨钕铁硼生产线,计划2016年投产。
信越化学:继福建长汀基地年产3,000吨稀土磁铁合金拨片生产线(一期)于2013年建成后,年产3,000吨稀土磁铁用磁粉生产线(二期)也将于2015年底建成。该项目生产的所有产品将出口至日本,用于混合动力汽车生产。
中科三环:中国乃至全球最大的钕铁硼制造商,生产基地分布在宁波、天津、南通、北京、广东、上海等地,共有钕铁硼产能18,000吨/年。2015年5月,南通生产基地 “年产2,000吨高性能钕铁硼生产线”正式竣工。
水清木华研究中心《2015-2018年全球及中国钕铁硼行业研究报告》着重研究了以下内容:
 全球钕铁硼发展环境、市场规模、市场结构、竞争格局等情况; 全球钕铁硼发展环境、市场规模、市场结构、竞争格局等情况;
中国钕铁硼产业政策、市场规模、市场结构、竞争格局、进出口等情况;
中国钕铁硼主要原材料价格变化、主要应用领域需求结构等情况;
国外5家、中国16家钕铁硼生产商经营情况、营收构成、钕铁硼业务等情况。
As the third-generation rare-earth permanent magnet material, NdFeB, an alloy of Pr-Nd metal and ferroboron, is featured with strong magnetic energy product, high coercive force, and high energy density. Being the best-value magnet, it enjoys the reputation of the “King of Magnets”.
Thanks to the booming NdFeB industry in China, global NdFeB output soared from 14 kt in 2000 to 127 kt in 2014 at a CAGR of 13.4%. As the Chinese government eliminated export quota for rare earths, global NdFeB output will continue to grow to 143 kt in 2015.
China is the world’s largest NdFeB producer with an output of 112 kt in 2014 (88.1% of the global total), up 19.0% year on year. In 2015, due to ceaseless decline in NdFeB price, China will produce 127 kt throughout the year, gaining by 13.5% from a year ago.
Nowadays, around 75% of NdFeB is used in traditional fields (electro-acoustic devices, magnetic separation, consumer electronics, etc.), while only 25% finds application in new fields (inverter air-conditioners, new energy vehicles, and energy-saving elevators). Compared with stable demand from traditional fields, the demand for NdFeB from new applications, especially new energy vehicles, increases significantly. According to the statistics, new energy vehicles’ consumption of NdFeB was 439 tons in China in 2014 when 79,000 new energy vehicles were manufactured, and is expected to further rise to 946 tons in 2015 when the country’s new energy vehicle output will witness a spectacular rise (to an estimated 178,000).
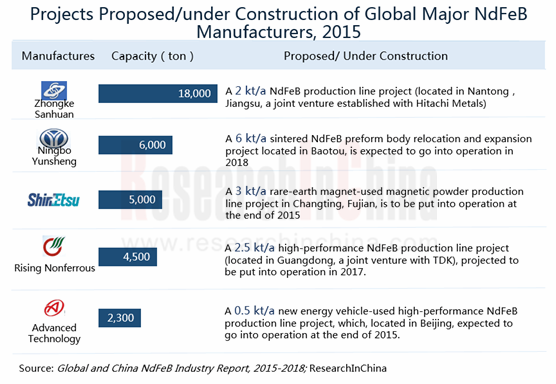
As downstream demand grows steadily and upstream raw material resources are abundant in China, the world’s major NdFeB companies have made their presence here and continued to expand capacity.
Hitachi Metals: The largest NdFeB manufacturer in Japan where is the home to most of its production bases. The company decided in Jun 2015 to set up a joint venture- Hitachi Metals San Huan Magnetic Materials (Nantong) Co., Ltd. with Beijing Zhong Ke San Huan Hi-Tech Co., Ltd. Phase I of the project will see the construction of 2 kt/a NdFeB production line and is planned to go into operation in 2016.
Shin-Etsu Chemical: With completion of 3 kt/a magnet alloys production line for rare earth magnets in Changting base in 2013, the 3 kt/a magnetic powder production line for rare earth magnets will finish construction at the end of 2015. All products manufactured by the project will be exported to Japan for the production of hybrid electric vehicles.
Beijing Zhong Ke San Huan Hi-Tech: The largest NdFeB manufacturer in China and even across the world; production bases located in Ningbo, Tianjin, Nantong, Beijing, Guangdong, and Shanghai with total NdFeB capacity of 18 kt/a. The 2 kt/a high-performance NdFeB production line was officially completed in Nantong base in May 2015.
Global and China NdFeB Industry Report, 2015-2018 focuses on the followings:
 Global NdFeB industry (development environment, market size/structure, competitive landscape, etc.); Global NdFeB industry (development environment, market size/structure, competitive landscape, etc.);
NdFeB industry in China (industrial policies, market size/structure, competitive landscape, import & export, etc.);
NdFeB in China (price changes of main raw materials, demand structure of main applications, etc.);
Operation, revenue structure, NdFeB business, etc. of 5 foreign and 16 Chinese NdFeB manufacturers.
第一章 钕铁硼行业简介
1.1 定义
1.2 产品类别
1.3 产业链
第二章 全球钕铁硼市场现状
2.1 发展环境
2.2 市场规模
2.3 市场结构
2.4 竞争格局
第三章 中国钕铁硼市场现状
3.1 产业政策
3.2 市场规模
3.3 市场结构
3.4 成本结构
3.5 进出口
3.5.1 进口
3.5.2 出口
3.6 竞争格局
第四章 中国钕铁硼产业上下游分析
4.1 原材料价格
4.2 主要应用领域
4.2.1 新能源汽车
4.2.2 风电设备
4.2.3 变频空调
4.2.4 节能电梯
第五章 国外主要钕铁硼生产商
5.1 日立金属株式会社
5.1.1 公司简介
5.1.2 经营情况
5.1.3 营收结构
5.1.4 钕铁硼业务
5.1.5 在华发展
5.2 信越化学工业株式会社
5.2.1 公司简介
5.2.2 经营情况
5.2.3 营收结构
5.2.4 钕铁硼业务
5.2.5 在华发展
5.3 TDK株式会社
5.3.1 公司简介
5.3.2 经营情况
5.3.3 营收结构
5.3.4 钕铁硼业务
5.4 其他企业
5.4.1 精工爱普生株式会社
5.4.2 德国VAC公司
第六章 中国主要钕铁硼生产商
6.1 北京中科三环高技术股份有限公司
6.1.1 公司简介
6.1.2 经营情况
6.1.3 营收结构
6.1.4 毛利率
6.1.5 钕铁硼业务
6.1.6 发展动态
6.2 中国北方稀土(集团)高科技股份有限公司
6.2.1 公司简介
6.2.2 经营情况
6.2.3 营收结构
6.2.4 钕铁硼业务
6.2.5 发展动态
6.3 太原双塔刚玉股份有限公司
6.3.1 公司简介
6.3.2 经营情况
6.3.3 营收结构
6.3.4 毛利率
6.3.5 钕铁硼业务
6.4 烟台正海磁性材料股份有限公司
6.4.1 公司简介
6.4.2 经营情况
6.4.3 营收结构
6.4.4 毛利率
6.4.5 研发情况
6.4.6 钕铁硼业务
6.4.7 主要项目
6.5 宁波韵升股份有限公司
6.5.1 公司简介
6.5.2 经营情况
6.5.3 营收结构
6.5.4 钕铁硼业务
6.5.5 发展动态
6.6 广晟有色金属股份有限公司
6.6.1 公司简介
6.6.2 经营情况
6.6.3 营收结构
6.6.4 毛利率
6.6.5 钕铁硼业务
6.6.6 发展动态
6.7 厦门钨业股份有限公司
6.7.1 公司简介
6.7.2 经营情况
6.7.3 营收结构
6.7.4 钕铁硼业务
6.8 安泰科技股份有限公司
6.8.1 公司简介
6.8.2 经营情况
6.8.3 营收结构
6.8.4 钕铁硼业务
6.8.5 发展动态
6.9 中钢集团安徽天源科技股份有限公司
6.9.1 公司简介
6.9.2 经营情况
6.9.3 营收结构
6.9.4 钕铁硼业务
6.10 中山大洋电机股份有限公司
6.10.1 公司简介
6.10.2 经营情况
6.10.3 营收结构
6.10.4 毛利率
6.10.5 钕铁硼业务
6.11 成都银河磁体股份有限公司
6.11.1 公司简介
6.11.2 经营情况
6.11.3 营收结构
6.11.4 钕铁硼业务
6.11.5 主要项目
6.12 其他企业
6.12.1 烟台首钢磁性材料股份有限公司
6.12.2 北京京磁强磁材料有限公司
6.12.3 北京银纳金科科技有限公司
6.12.4 安徽大地熊新材料股份有限公司
6.12.5 宁波金鸡钕铁硼强磁材料有限公司
第七章 总结与预测
7.1 市场
7.2 企业
1 Introduction to NdFeB Industry
1.1 Definition
1.2 Product Category
1.3 Industry Chain
2 Status Quo of Global NdFeB Market
2.1 Development Environment
2.2 Market Size
2.3 Market Structure
2.4 Competitive Landscape
3 Status Quo of Chinese NdFeB Market
3.1 Industrial Policy
3.2 Market Size
3.3 Market Structure
3.4 Cost Structure
3.5 Import & Export
3.5.1 Import
3.5.2 Export
3.6 Competitive Landscape
4 Upstream and Downstream of NdFeB Industry
4.1 Raw Material Price
4.2 Main Applications
4.2.1 New Energy Vehicle
4.2.2 Wind Power Equipment
4.2.3 Inverter Air Conditioner
4.2.4 Energy-saving Elevator
5 Major Foreign NdFeB Manufacturers
5.1 Hitachi Metals
5.1.1 Profile
5.1.2 Operation
5.1.3 Revenue Structure
5.1.4 NdFeB Business
5.1.5 Development in China
5.2 Shin-Etsu Chemical
5.2.1 Profile
5.2.2 Operation
5.2.3 Revenue Structure
5.2.4 NdFeB Business
5.2.5 Development in China
5.3 TDK
5.3.1 Profile
5.3.2 Operation
5.3.3 Revenue Structure
5.3.4 NdFeB Business
5.4 Other Enterprises
5.4.1 Seiko Epson
5.4.2 VAC
6 Major Chinese NdFeB Manufacturers
6.1 Beijing Zhong Ke San Huan High-Tech Co., Ltd.
6.1.1 Profile
6.1.2 Operation
6.1.3 Revenue Structure
6.1.4 Gross Margin
6.1.5 NdFeB Business
6.1.6 Developments
6.2 China Northern Rare Earth (Group) High-tech Co., Ltd.
6.2.1 Profile
6.2.2 Operation
6.2.3 Revenue Structure
6.2.4 NdFeB Business
6.2.5 Developments
6.3 Taiyuan Twin Tower Aluminum Oxide Co., Ltd.
6.3.1 Profile
6.3.2 Operation
6.3.3 Revenue Structure
6.3.4 Gross Margin
6.3.5 NdFeB Business
6.4 Yantai Zhenghai Magnetic Material Co., Ltd.
6.4.1 Profile
6.4.2 Operation
6.4.3 Revenue Structure
6.4.4 Gross Margin
6.4.5 R&D
6.4.6 NdFeB Business
6.4.7 Key Projects
6.5 Ningbo Yunsheng Co., Ltd.
6.5.1 Profile
6.5.2 Operation
6.5.3 Revenue Structure
6.5.4 NdFeB Business
6.5.5 Developments
6.6 Rising Nonferrous Metals Co., Ltd.
6.6.1 Profile
6.6.2 Operation
6.6.3 Revenue Structure
6.6.4 Gross Margin
6.6.5 NdFeB Business
6.6.6 Developments
6.7 Xiamen Tungsten Co., Ltd.
6.7.1 Profile
6.7.2 Operation
6.7.3 Revenue Structure
6.7.4 NdFeB Business
6.8 Advanced Technology & Materials Co., Ltd.
6.8.1 Profile
6.8.2 Operation
6.8.3 Revenue Structure
6.8.4 NdFeB Business
6.8.5 Developments
6.9 Sinosteel Anhui Tianyuan Technology Co., Ltd.
6.9.1 Profile
6.9.2 Operation
6.9.3 Revenue Structure
6.9.4 NdFeB Business
6.10 Zhongshan Broad-Ocean Motor Co., Ltd.
6.10.1 Profile
6.10.2 Operation
6.10.3 Revenue Structure
6.10.4 Gross Margin
6.10.5 NdFeB Business
6.11 Chengdu Galaxy Magnets Co., Ltd.
6.11.1 Profile
6.11.2 Operation
6.11.3 Revenue Structure
6.11.4 NdFeB Business
6.11.5 Key Projects
6.12 Other Enterprises
6.12.1 Yantai Shougang Magnetic Materials Inc
6.12.2 Beijing Jingci Magnet Co., Ltd.
6.12.3 Beijing Thinova
6.12.4 Anhui Earth-Panda Advance Magnetic Material Co., Ltd.
6.12.5 Ningbo Jinji Strong Magnetic Material Co., Ltd
7 Summary and Forecast
7.1 Market
7.2 Enterprise
图:钕铁硼构成元素
表:钕铁硼永磁材料与其他永磁材料磁性能对比
表:三种钕铁硼性能对比
图:钕铁硼分类
图:钕铁硼产业链
图:2014年粘结钕铁硼下游应用比例
图:全球永磁材料发展历程
表:全球主要钕铁硼专利到期时间
表:截至2015上半年中国已获得钕铁硼专利授权的企业
图:2008-2018年全球钕铁硼产量及增速
图:2008-2018年全球粘结钕铁硼产量
图:2008-2018年全球高性能钕铁硼产量
图:2014年全球钕铁硼(分国家)产量构成
图:2014年全球高性能钕铁硼(分国家)产量构成
图:2014年全球钕铁硼下游消费结构
图:2014年全球高性能钕铁硼市场竞争格局
图:2018年全球高性能钕铁硼竞争格局
表:2000-2015年中国钕铁硼相关产业政策
图:2006-2018年中国钕铁硼产量及增速
图:2007-2018年中国高性能钕铁硼产量及增速
图:2014年中国钕铁硼产能分布
表:2010-2018年中国高性能钕铁硼(分领域)需求量
图:2014年中国钕铁硼成本构成
表:2011-2015年中国钕铁硼及相关产品进口量及进口额
图:2014年中国钕铁硼永磁体(分国家/地区)进口量构成
表:2013-2015年中国钕铁硼及相关产品出口量及出口额
图:2014年钕铁硼永磁体(分国家/地区)出口量构成
图:2014年钕铁硼磁粉(分国家/地区)出口量构成
图:2014年其他钕铁合金(分国家/地区)出口量构成
图:2015年钕铁硼生产企业产能结构
表:2015年中国主要钕铁硼生产商产能
图:2013-2015年中国金属钕价格
图:2013-2015年中国金属镨价格
图:2014年中国钕铁硼下游需求结构
图:2011-2018年中国新能源汽车产量
表:永磁电机与其他电机性能比较
表:2015年全球主流新能源汽车驱动电机类型
图:2014-2018年中国新能源汽车钕铁硼需求量
图:2010-2018年中国风电装机容量
图:2014-2018年中国直驱永磁装机容量
图:2014-2018年中国风电设备钕铁硼需求量
表:2014-2018年中国变频空调钕铁硼需求量
图:2014-2018年中国节能电梯钕铁硼需求量
图:日立金属全球业务布局
图:2009-2015财年日立金属营业收入及净利润
图:2013-2015财年日立金属(分产品)营业收入构成
表:2015年日立金属全球市场扩张战略
图:2014财年日立金属磁材业务收入
图:2014财年日立金属钕铁硼应用结构
图:2014财年日立金属钕铁硼生产基地
图:2014财年日立金属在华销售结构
图:2015年日立金属在华企业分布
图:信越化学全球布局
图:2008-2016财年信越化学营业收入及净利润
图:2014-2016财年信越化学(分业务)营业收入构成
图:2014-2015财年信越化学(分地区)营业收入构成
图:2015年信越化学磁材业务投资
图:TDK全球营销网络
图:2010-2016财年TDK营业收入及净利润
图:2013-2016财年TDK(分产品)营业收入构成
图:2010-2016财年TDK(分地区)营业收入构成
图:TDK主要磁材产品
图:精工爱普生全球营销网络
图:2015年VAC(分产品)主营业务收入构成
图:2015年中科三环股权结构
图:2009-2015年中科三环营业收入及净利润
图:2008-2015年中科三环(分产品)主营业务收入
图:2012-2015年中科三环(分地区)主营业务收入构成
图:2010-2015年中科三环毛利及毛利率
表:2014年中科三环钕铁硼子公司营业收入
图:2003-2015年中科三环钕铁硼业务收入及增长率
图:2014年中科三环钕铁硼应用结构
图:2015年北方稀土股权结构
图:2008-2014年北方稀土员工数量
图:2008-2015年北方稀土营业收入及净利润
表:2014年北方稀土落后产能淘汰子公司
图:2012-2015年北方稀土(分产品)营业收入构成
图:2008-2015年北方稀土(分地区)营业收入构成
图:2008-2015年北方稀土钕铁硼业务收入及毛利率
表:2012-2015年内蒙古包钢稀土磁性材料有限公司主要经济指标
图:2015年太原刚玉股权结构
图:2008-2014年太原刚玉员工数量
图:2008-2015年太原刚玉营业收入及净利润
图:2013-2015年太原刚玉(分产品)营业收入构成
图:2008-2015年太原刚玉(分地区)营业收入构成
图:2008-2015年太原刚玉(分产品)毛利率
图:2013-2014年太原刚玉钕铁硼成本结构
图:2008-2015年太原刚玉钕铁硼业务收入及增速
表:2012-2015年浙江英洛华磁业有限公司营业收入及净利润
表:2012-2015年山西英洛华磁业有限公司营业收入及净利润
图:2015年正海磁材股权结构
图:2009-2015年正海磁材营业收入及净利润
图:2015年正海磁材(分产品)营业收入构成
图:2010-2014年正海磁材(分地区)营业收入构成
图:2010-2015年正海磁材毛利率
图:2011-2015年正海磁材研发投入
图:2010-2015年正海磁材钕铁硼业务收入及毛利率
图:2012-2014年正海磁材钕铁硼产销量
图:2014年正海磁材钕铁硼(分类别)营业收入构成
图:2014年正海磁材钕铁硼消费结构
图:2015年宁波韵升股权结构
图:2007-2014年宁波韵升员工数量
图:2008-2015年宁波韵升营业收入及净利润
图:2012-2015年宁波韵升(分产品)营业收入构成
图:2010-2015年宁波韵升(分地区)营业收入构成
表:2014年宁波韵升主要钕铁硼子公司营业收入
图:2009-2015年宁波韵升钕铁硼业务收入及毛利率
图:2012-2014年宁波韵升钕铁硼产品成本结构
图:2014年宁波韵升钕铁硼产品消费结构
图:2015年广晟有色股权结构
图:2009-2014年广晟有色员工数量
图:2009-2015年广晟有色营业收入及净利润
图:2013-2015年广晟有色(分产品)营业收入构成
图:2013-2015年广晟有色(分地区)营业收入构成
图:2009-2015年广晟有色(分产品)毛利率
表:2012-2015年广东广晟有色金属进出口有限公司营业收入及净利润
表:2012-2015年广东广晟智威稀土新材料有限公司营业收入及净利润
图:2015年厦门钨业股权结构
图:2008-2015年厦门钨业营业收入及净利润
图:2012-2015年厦门钨业(分产品)营业收入构成
图:2009-2015年厦门钨业(分地区)营业收入构成
表:2010-2015年长汀金龙稀土有限公司营业收入及净利润
图:2015年安泰科技股权结构
图:2009-2015年安泰科技营业收入及净利润
图:2013-2015年安泰科技(分产品)营业收入构成
图:2010-2015年安泰科技(分地区)营业收入
表:2013-2015海美格磁石技术(深圳)有限公司营业收入
图:2015年中钢天源股权结构
图:2008-2015年中钢天源营业收入及净利润
图:2013-2015年中钢天源(分产品)营业收入构成
图:2009-2015年中钢天源(分地区)营业收入构成
图:2015年大洋电机股权结构
图:2009-2014年大洋电机员工数量
图:2009-2015年大洋电机营业收入及净利润
图:2013-2015年大洋电机(分产品)营业收入构成
图:2009-2015年大洋电机(分地区)营业收入构成
图:2009-2015年大洋电机(分产品)毛利率
表:2012-2014年宁波科星材料科技有限公司营业收入
图:2015年银河磁体股权结构
图:2008-2015年银河磁体营业收入及净利润
图:2012-2014年银河磁体(分产品)营业收入构成
图:2011-2015年银河磁体(分地区)营业收入构成
图:2009-2015年银河磁体钕铁硼业务收入及增速
图:2013-2015年银河磁体钕铁硼(分产品)收入构成
表:2015年银河磁体主要研发项目
表:安徽大地熊主要生产基地及产能
图:2008-2018年全球钕铁硼及高性能钕铁硼产量
图:2007-2018年中国钕铁硼及高性能钕铁硼产量
图:2014/2018年中国高性能钕铁硼应用结构
图:2009-2015年全球主要钕铁硼生产商营业收入增速
图:2015年全球钕铁硼企业竞争格局
Elements of NdFeB
Magnetic Performance Comparison between NdFeB Permanent Magnet Materials and Other Permanent Magnet Materials
Performance Comparison of Three Kinds of NdFeB
Classification of NdFeB
NdFeB Industry Chain
Consumption of Bonded NdFeB by Application, 2014
Development History of Global Permanent Magnet Materials
Expiration of Main Global NdFeB Patents
Enterprises Holding Authorized NdFeB Patents in China, by 2015H1
Global NdFeB Output and Growth Rate, 2008-2018E
Global Bonded NdFeB Output, 2008-2018E
Global High-performance NdFeB Output, 2008-2018E
Global NdFeB Output Structure (by Country), 2014
Global High-performance NdFeB Output Structure (by Country), 2014
Global Downstream NdFeB Consumption Structure, 2014
Global High-performance NdFeB Market Competition Pattern, 2014
Global High-performance NdFeB Competition Pattern, 2018E
Policies on NdFeB Industry in China, 2000-2015
NdFeB Output and Growth Rate in China, 2006-2018E
High-performance NdFeB Output and Growth Rate in China, 2007-2018E
NdFeB Capacity Distribution in China, 2014
China’s Demand for High-performance NdFeB by Field, 2010-2018E
NdFeB Cost Structure in China, 2014
Import Volume & Value of NdFeB and Related Products in China, 2011-2015
Import Volume Structure of NdFeB Permanent Magnets by Country/Region, 2014
Export Volume & Value of NdFeB and Related Products from China, 2013-2015
Export Volume Structure of NdFeB Permanent Magnets by Country/Region, 2014
Export Volume Structure of NdFeB Magnetic Powder by Country/Region, 2014
Export Volume Structure of Other Neodymium-Iron Alloys by Country/Region, 2014
Capacity Structure of NdFeB Manufacturers, 2015
Capacity of Major Chinese NdFeB Manufacturers, 2015
China's Metal Neodymium Price, 2013-2015
China's Metal Praseodymium Price, 2013-2015
Structure of Downstream Demand for NdFeB in China, 2014
New Energy Vehicle Output in China, 2011-2018E
Performance Comparison between Permanent Magnet Motors and Other Motors
Global Mainstream New Energy Vehicle Drive Motors, 2015
Demand for NdFeB from New Energy Vehicle in China, 2014-2018E
China’s Installed Wind Power Capacity, 2010-2018E
Direct-drive Permanent Magnet Turbine Installed Capacity in China, 2014-2018E
Demand for NdFeB from Wind Power Equipment in China, 2014-2018E
Demand for NdFeB from Converter Air Conditioner in China, 2014-2018E
Demand for NdFeB from Energy-saving Elevator in China, 2014-2018E
Global Business Presence of Hitachi Metals
Revenue and Net Income of Hitachi Metals, FY2009-FY2015
Revenue Structure of Hitachi Metals by Product, FY2013-FY2015
Global Market Expansion Strategy of Hitachi Metals, 2015
Magnetic Material Revenue of Hitachi Metals, FY2014
NdFeB Application Structure of Hitachi Metals, FY2014
NdFeB Production Bases of Hitachi Metals, FY2014
Sales Structure of Hitachi Metals in China, FY2014
Hitachi Metals’ Enterprises in China, 2015
Global Presence of Shin-Etsu Chemical
Revenue and Net Income of Shin-Etsu Chemical, FY2008-FY2016
Revenue Structure of Shin-Etsu Chemical by Business, FY2014-FY2016
Revenue Structure of Shin-Etsu Chemical by Region, FY2014-FY2015
Shin-Etsu Chemical’s Investment in Magnetic Material Business, 2015
Global Marketing Network of TDK
Revenue and Net Income of TDK, FY2010-FY2016
Revenue Structure of TDK by Product, FY2013-FY2016
Revenue Structure of TDK by Region, FY2010-FY2016
Main Magnetic Products of TDK
Global Marketing Network of Seiko Epson
Operating Revenue Structure of VAC by Product, 2015
Equity Structure of Beijing Zhong Ke San Huan High-Tech, 2015
Revenue and Net Income of Beijing Zhong Ke San Huan High-Tech, 2009-2015
Operating Revenue Breakdown of Beijing Zhong Ke San Huan High-Tech by Product, 2008-2015
Operating Revenue Structure of Beijing Zhong Ke San Huan High-Tech by Region, 2012-2015
Gross Profit and Gross Margin of Beijing Zhong Ke San Huan High-Tech, 2010-2015
Revenue of NdFeB Subsidiaries of Beijing Zhong Ke San Huan High-Tech, 2014
NdFeB Revenue and Growth Rate of Beijing Zhong Ke San Huan High-Tech, 2003-2015
NdFeB Application Structure of Beijing Zhong Ke San Huan High-Tech, 2014
Equity Structure of China Northern Rare Earth (Group) High-tech, 2015
Employees of China Northern Rare Earth (Group) High-tech, 2008-2014
Revenue and Net Income of China Northern Rare Earth (Group) High-tech, 2008-2015
Subsidiaries Eliminated by China Northern Rare Earth (Group) High-tech for Backward Capacity, 2014
Revenue Structure of China Northern Rare Earth (Group) High-tech by Product, 2012-2015
Revenue Structure of China Northern Rare Earth (Group) High-tech by Region, 2008-2015
NdFeB Revenue and Gross Margin of China Northern Rare Earth (Group) High-tech, 2008-2015
Key Economic Indicators of Inner Mongolia Baotou Steel Rare Earth Magnetic Material, 2012-2015
Equity Structure of Taiyuan Twin Tower Aluminum Oxide, 2015
Employees of Taiyuan Twin Tower Aluminum Oxide, 2008-2014
Revenue and Net Income of Taiyuan Twin Tower Aluminum Oxide, 2008-2015
Revenue Structure of Taiyuan Twin Tower Aluminum Oxide by Product, 2013-2015
Revenue Structure of Taiyuan Twin Tower Aluminum Oxide by Region, 2008-2015
Gross Margin of Taiyuan Twin Tower Aluminum Oxide by Product, 2008-2015
NdFeB Cost Structure of Taiyuan Twin Tower Aluminum Oxide, 2013-2014
NdFeB Revenue and Growth Rate of Taiyuan Twin Tower Aluminum Oxide, 2008-2015
Revenue and Net Income of Zhejiang Innuovo Magnetics, 2012-2015
Revenue and Net Income of Shanxi Innuovo Magnetics, 2012-2015
Equity Structure of Yantai Zhenghai Magnetic Material, 2015
Revenue and Net Income of Yantai Zhenghai Magnetic Material, 2009-2015
Revenue Structure of Yantai Zhenghai Magnetic Material by Product, 2015
Revenue Structure of Yantai Zhenghai Magnetic Material by Region, 2010-2014
Gross Margin of Yantai Zhenghai Magnetic Material, 2010-2015
R&D Costs of Yantai Zhenghai Magnetic Material, 2011-2015
NdFeB Revenue and Gross Margin of Yantai Zhenghai Magnetic Material, 2010-2015
NdFeB Output and Sales Volume of Yantai Zhenghai Magnetic Material, 2012-2014
NdFeB Revenue Structure of Yantai Zhenghai Magnetic Material by Type, 2014
NdFeB Consumption Structure of Yantai Zhenghai Magnetic Material, 2014
Equity Structure of Ningbo Yunsheng, 2015
Employees of Ningbo Yunsheng, 2007-2014
Revenue and Net Income of Ningbo Yunsheng, 2008-2015
Revenue Structure of Ningbo Yunsheng by Product, 2012-2015
Revenue Structure of Ningbo Yunsheng by Region, 2010-2015
Revenue of Ningbo Yunsheng’s Major NdFeB Subsidiaries, 2014
NdFeB Revenue and Gross Margin of Ningbo Yunsheng, 2009-2015
NdFeB Cost Structure of Ningbo Yunsheng, 2012-2014
NdFeB Consumption Structure of Ningbo Yunsheng, 2014
Equity Structure of Rising Nonferrous Metals, 2015
Employees of Rising Nonferrous Metals, 2009-2014
Revenue and Net Income of Rising Nonferrous Metals, 2009-2015
Revenue Structure of Rising Nonferrous Metals by Product, 2013-2015
Revenue Structure of Rising Nonferrous Metals by Region, 2013-2015
Gross Margin of Rising Nonferrous Metals by Product, 2009-2015
Revenue and Net Income of Guangdong Rising Nonferrous Metals Import & Export, 2012-2015
Revenue and Net Income of Guangdong Rising Zhiwei Rare Earth New Materials, 2012-2015
Equity Structure of Xiamen Tungsten, 2015
Revenue and Net Income of Xiamen Tungsten, 2008-2015
Revenue Structure of Xiamen Tungsten by Product, 2012-2015
Revenue Structure of Xiamen Tungsten by Region, 2009-2015
Revenue and Net Income of Changting Golden Dragon Rare-Earth, 2010-2015
Equity Structure of Advanced Technology & Materials, 2015
Revenue and Net Income of Advanced Technology & Materials, 2009-2015
Revenue Structure of Advanced Technology & Materials by Product, 2013-2015
Revenue Structure of Advanced Technology & Materials by Region, 2010-2015
Revenue of Highmag Technology, 2013-2015
Equity Structure of Sinosteel Anhui Tianyuan Technology, 2015
Revenue and Net Income of Sinosteel Anhui Tianyuan Technology, 2008-2015
Revenue Structure of Sinosteel Anhui Tianyuan Technology by Product, 2013-2015
Revenue Structure of Sinosteel Anhui Tianyuan Technology by Region, 2009-2015
Equity Structure of Zhongshan Broad-Ocean Motor, 2015
Employees of Zhongshan Broad-Ocean Motor, 2009-2014
Revenue and Net Income of Zhongshan Broad-Ocean Motor, 2009-2015
Revenue Structure of Zhongshan Broad-Ocean Motor by Product, 2013-2015
Revenue Structure of Zhongshan Broad-Ocean Motor by Region, 2009-2015
Gross Margin of Zhongshan Broad-Ocean Motor by Product, 2009-2015
Revenue of Ningbo Co-star Materials Hi-Tech, 2012-2014
Equity Structure of Chengdu Galaxy Magnets, 2015
Revenue and Net Income of Chengdu Galaxy Magnets, 2008-2015
Revenue Structure of Chengdu Galaxy Magnets by Product, 2012-2014
Revenue Structure of Chengdu Galaxy Magnets by Region, 2011-2015
NdFeB Revenue and Growth Rate of Chengdu Galaxy Magnets, 2009-2015
NdFeB Revenue Structure of Chengdu Galaxy Magnets by Product, 2013-2015
Key R&D Projects of Chengdu Galaxy Magnets, 2015
Main Production Bases and Capacity of Anhui Earth-Panda Advance Magnetic Material
Global NdFeB and High-performance NdFeB Output, 2008-2018E
NdFeB and High-performance NdFeB Output in China, 2007-2018E
High-performance NdFeB Application Structure in China, 2014/2018E
Revenue Growth Rate of the World’s Major NdFeB Manufacturers, 2009-2015
Competitive Landscape of Global NdFeB Manufacturers, 2015
如果这份报告不能满足您的要求,我们还可以为您定制报告,请 留言说明您的详细需求。
|