|
|
|
报告导航:研究报告—
制造业—能源矿产
|
|
2015年全球及中国锑行业研究报告 |
 |
字数:1.9万 |
页数:62 |
图表数:69 |
|
中文电子版:6000元 |
中文纸版:3000元 |
中文(电子+纸)版:6500元 |
|
英文电子版:1500美元 |
英文纸版:1600美元 |
英文(电子+纸)版:1800美元 |
|
编号:LMX073
|
发布日期:2015-11 |
附件:下载 |
 |
|
|
2015年以来,中国锑行业主要呈现以下几个发展特点:
锑精矿及锑品产量继续下滑。受下游应用市场需求萎靡、价格下行以及成本不断攀升的影响,中国锑生产企业开工率普遍不高,行业产量下滑。2015年1-9月,中国锑品产量累计155354.49吨,同比下降8.72%;锑精矿产量79791吨,同比下滑7.4%。
锑精矿进口大幅下滑,未锻轧锑出口大幅增长。2014年以来,受国内企业减、停产影响,锑矿需求量下降,加之国外冶炼产能的投放,导致锑精矿进口量大幅下降。根据海关统计数据显示,2015年1-8月,中国锑精矿进口量约30555吨,同比下降26.83%。
2015年1-8月,中国未锻轧锑出口量3271吨,同比大幅增长374.75%。未锻轧锑出口量出现大幅增长,主要受2015年海关严打走私行动的影响,从而使正规出口渠道供应量显著增加。
在价格下降、成本上升的双重压力下,锑行业出现亏损。据中国有色金属工业协会统计,2015年1-8月中国锑矿采选实现利润8833.8万元,同比下降42%;锑冶炼亏损1.57亿元,去年同期则盈利2.6亿元。
另外,作为国内锑行业的龙头上市企业,2015年上半年,湖南黄金(原辰州矿业)锑品销售收入48788.16万元,同比减少22.26%,占主营业务收入的16.95%,上年同期为23.07%,减少6.12个百分点。公司锑品年产能4万吨,2015年上半年,公司生产锑品13,891吨,同比增长5.71%。
《2015年全球及中国锑行业研究报告》主要涉及以下内容:
全球锑资源储量、锑矿产量及需求量;
中国锑行业政策环境,主要包括开采总量控制政策以及出口配额政策;
中国锑资源储量及分布、锑精矿、锑品产量及分布、锑需求量、需求结构及主要应用领域分析、主要锑品价格走势及市场竞争格局;
中国锑精矿及锑品进出口量分析;
中国11家主要锑相关企业分析。
Since 2015, China’s antimony industry has been characterized by the followings:
China sees a continued decline in the output of antimony concentrates and antimony products. Owing to weak demand from downstream sectors, downward mobility of prices as well as rising costs, the operating rate of Chinese antimony production enterprises is not high in general, and the industry’s gross output falls. From January to September of 2015, China’s cumulative output of antimony products dropped 8.72% year on year to 155,354.49 tons; the output of antimony concentrates shrank 7.4% year on year to 79,791 tons.
The import of antimony concentrates slumps, while the export of unwrought antimony surges. Since 2014, domestic enterprises have reduced or ceased production, the antimony ore demand has descended and the overseas smelting capacity has been released, resulting in a substantial decline in the antimony concentrate import. According to the statistics of the customs, China imported about 30,555 tons of antimony concentrates with a year-on-year decrease of 26.83% from January to August of 2015.
From January to August of 2015, China exported 3,271 tons of unwrought antimony, soaring by 374.75% year on year, because the crackdown of the customs on smuggling propelled the supply of formal export channels significantly.
The antimony industry suffers losses amid lower prices and rising costs. China Nonferrous Metals Industry Association reveals that China’s antimony ore mining and dressing earned profits of RMB88.338 million from January to August of 2015, dipping by 42% year on year; meanwhile, antimony smelting made losses of RMB157 million, compared with the profit of RMB260 million in the same period last year.
In addition, the domestic antimony giant Hunan Gold (formerly known as Chenzhou Mining) which is a listed company achieved the antimony product revenue of RMB487.8816 million in the first half of 2015, representing a year-on-year fall of 22.26%, accounting for 16.95% of the operating revenue (6.12 percentage points lower than 23.07% in the same period last year). With annual capacity of 40,000 tons, the company produced 13,891 tons of antimony products in the first half of 2015, up 5.71% year on year.
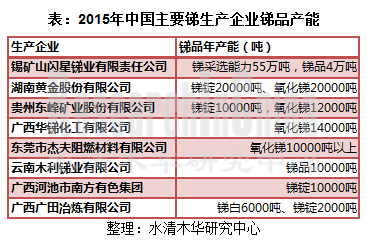
Antimony Products Capacity of Major Producers in China, 2015
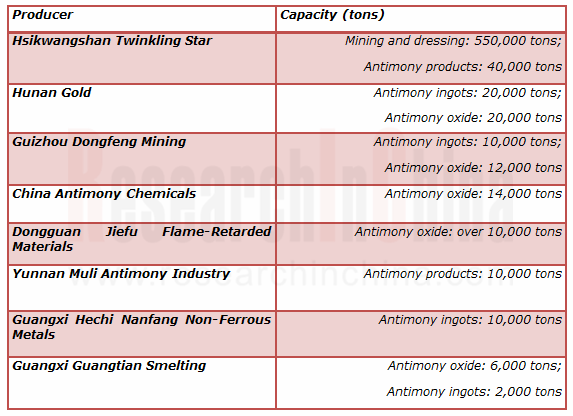
Source: ResearchInChina
China Antimony Industry Report, 2015 highlights the followings:
 Global antimony reserves, output, and demand; Global antimony reserves, output, and demand;
Policies about antimony industry in China, mainly including these on exploitation cap and export quotas;
China’s antimony reserves and distribution, antimony concentrates, output and distribution of antimony products, antimony demand, demand structure and major antimony applications, main antimony price trends and market competition pattern;
China’s import & export volume of antimony concentrates and antimony products;
11 major antimony-related companies in China.
第一章 锑概述
1.1 锑金属特点及应用
1.2 锑行业产业链
第二章 全球锑行业发展概况
2.1资源储量及分布
2.2供给情况
2.3需求情况
第三章 中国锑行业发展状况
3.1发展政策环境
3.1.1 资源开发政策
3.1.2 开采总量控制政策
3.1.3 出口配额政策
3.2 资源储量及分布
3.3 供应
3.3.1 供给规模
3.3.2 供给结构
3.4 需求
3.4.1 需求结构
3.4.2 应用领域
3.4.3 需求量
3.5 价格
3.6 竞争格局
第四章 中国锑行业进出口状况
4.1 进出口一览
4.2 进口
4.3 出口
第五章 重点企业分析
5.1 湖南黄金股份有限公司
5.1.1 公司简介
5.1.2 经营状况
5.1.3 营收构成
5.1.4 毛利率
5.1.5 锑品产量
5.1.6 出口配额
5.1.7 研发及投资
5.1.8 业绩预测
5.2 锡矿山闪星锑业有限责任公司
5.2.1 公司简介
5.2.2 发展历程
5.2.3 出口配额
5.3 五矿有色金属股份有限公司
5.3.1 公司简介
5.3.2 锑业务
5.3.3 出口配额
5.4 广西华锡集团股份有限公司
5.4.1 公司简介
5.4.2 出口配额
5.5 广西日星金属化工有限公司
5.5.1 公司简介
5.5.2 出口配额
5.6 贵州东峰矿业股份有限公司
5.6.1 公司简介
5.6.2 业务体系
5.7 东莞市杰夫阻燃材料有限公司
5.7.1 公司简介
5.7.2 出口配额
5.8 云南木利锑业有限公司
5.8.1 公司简介
5.8.2 出口配额
5.9 广西河池市南方有色集团
5.10 广西广田冶炼有限公司
5.11 河池五吉有限责任公司
第六章 市场总结与发展预测
6.1 市场总结
6.2 发展预测
1. Overview of Antimony
1.1 Characteristics and Application of Antimony Metal
1.2 Industry Chain
2. Development of Antimony Industry Worldwide
2.1 Reserves and Distribution
2.2 Supply
2.3 Demand
3. Development of Antimony Industry in China
3.1 Policy Environment
3.1.1 Policy on Resource Exploitation
3.1.2 Policy on Control of Total Exploitation
3.1.3 Policy on Export Quota
3.2 Reserves and Distribution
3.3 Supply
3.3.1 Supply Volume
3.3.2 Supply Structure
3.4 Demand
3.4.1 Demand Structure
3.4.2 Applications
3.4.3 Quantity Demanded
3.5 Price
3.6 Competition Pattern
4. Import and Export of China Antimony Industry
4.1 Summary of Import and Export
4.2 Import
4.3 Export
5. Key Enterprises
5.1 Hunan Gold Corporation Limited
5.1.1 Profile
5.1.2 Operation
5.1.3 Revenue Structure
5.1.4 Gross Margin
5.1.5 Output of Antimony Products
5.1.6 Export Quota
5.1.7 R & D and Investment
5.1.8 Performance Forecast
5.2 Hsikwangshan Twinkling Star Co., Ltd.
5.2.1 Profile
5.2.2 Development Course
5.2.3 Export Quota
5.3 China Minmetals Non-ferrous Metals Co.,Ltd.
5.3.1 Profile
5.3.2 Antimony Business
5.3.3 Export Quota
5.4 Guangxi China Tin Co., Ltd.
5.4.1 Profile
5.4.2 Export Quota
5.5 Guangxi Youngsun Chemicals Co., Ltd.
5.5.1 Profile
5.5.2 Export Quota
5.6 Guizhou Dongfeng Mining Group Co., Ltd.
5.6.1 Profile
5.6.2 Business System
5.7 Dongguan Jiefu Flame-Retarded Materials Co., Ltd.
5.7.1 Profile
5.7.2 Export Quota
5.8 Yunnan Muli Antimony Industry Co., Ltd.
5.8.1 Profile
5.8.2 Export Quota
5.9 Guangxi Hechi Nanfang Non-Ferrous Metals Group
5.10 Guangxi Guangtian Smelting Co., Ltd.
5.11 Hechi Wuji Co., Ltd.
6. Market Summary and Development Prospect
6.1 Market Summary
6.2 Development Prospect
表:锑产品的用途
图:锑行业产业链
图:锑产业链及应用领域
图:2014年全球锑储量分布
表:2014年全球及中国锑静态储采比
图:1994-2014年全球锑矿产量
图:2013-2014年全球锑矿产量(分国家)
图:1994-2014年中国锑矿产量占全球的比重
图:2010-2014年美国锑产量和进口量
图:2014年全球锑消费结构
图:2010-2014年美国锑表观消费量和进口量
图:2014年美国锑消费结构
图:2010-2014年美国锑消费结构中阻燃剂所占比重
表:1991-2015年中国锑行业相关政策、法规及标准
图:2009-2013年中国锑开采总量控制指标
表:2014年中国前两批锑及其制品出口配额
表:2014年中国前两批氧化锑出口配额
表:2015年中国前两批锑及其制品出口配额
表:2015年中国前两批氧化锑出口配额
图:2012-2015年中国锑及其制品出口配额对比
图:2012-2015年中国氧化锑出口配额对比
表:2006-2014年中国锑基础储量与探明储量
图:中国锑资源分布
图:2009-2015年中国锑品产量
图:2009-2015年中国锑精矿产量
图:2015年1-9月中国锑品产量分布
图:2015年中国锑消费结构
表:锑的主要应用领域
图:阻燃剂在汽车中的应用
图:2008-2015年中国铅酸蓄电池产量
图:2001-2015年中国国内锑消费量
图:2015年中国市场2#锑锭价格走势
图:2015年中国市场三氧化二锑99.5%价格走势
图:2015年中国市场硫化锑精矿55%价格走势
图:2015年11月13日中国市场锑品报价
表:2015年中国主要锑生产企业锑品产能
表:2015年中国锑产品进出口关税一览
表:2015年1-8月中国锑品进出口数据统计
图:2009-2015年中国锑品进口量
图:2009-2015年中国锑品进口金额
图:2009-2015年中国锑品出口量
图:2009-2015年中国锑品出口金额
图:2009-2015年湖南黄金营业收入及同比增长
图:2009-2015年湖南黄金净利润及同比增长
图:2011-2015年湖南黄金营业收入(分业务)构成
图:2009-2015年湖南黄金营业收入(分区域)构成
图:2012-2015年湖南黄金毛利率(分业务)
表:2010-2015年湖南黄金锑制品产量
图:2011-2015年湖南省中南锑钨工业贸易有限公司锑产品出口配额
表:2011-2015年湖南黄金研发费用及其占营业收入的比重
表:2015-2018年湖南黄金营业收入与净利润预测
表:锡矿山闪星锑业有限责任公司发展历程
图:2011-2015年湖南锡矿山闪星锑业进出口有限公司锑出口配额
图:五矿有色金属股份有限公司股权结构
表:广西华锑化工有限公司基本信息
表:广西华锑科技有限公司基本信息
图:2011-2015年五矿有色金属股份有限公司锑出口配额
图:2009-2015年广西华锡集团股份有限公司锑出口配额
表:广西华锑化工有限公司基本信息
图:广西日星金属化工有限公司氧化锑规格
图:2011-2015年广西日星金属化工有限公司锑出口配额
表:2014-2015年东莞市杰夫阻燃材料有限公司氧化锑出口配额
图:云南木利锑业有限公司销售网络
表:云南联合锑业股份有限公司基本信息
图:2011-2015年云南联合锑业股份有限公司锑出口配额
表:广西广田冶炼有限公司基本信息
表:河池五吉有限责任公司基本信息
图:2010-2015年中国锑品和锑精矿产量同比增长
表:2015-2018年中国锑产品产量和消费量预测
Uses of Antimony-Based Products
Antimony Industry Chain
Industrial Chain and Applications of Antimony
Distribution of Antimony Reserve Worldwide, 2014
Antimony Reserves-to-Output Ratio (Static) in China and the World, 2014
Worldwide Antimony Ore Production 1994-2014
Worldwide Antimony Ore Production (by Country), 2013-2014
Proportion of China’s Antimony Ore Production to the World’s Total, 1994-2014
Production and Import Volume of Antimony in USA, 2010-2014
Antimony Consumption Structure Worldwide, 2014
Apparent Consumption and Import Volume of Antimony in USA, 2010-2014
Antimony Consumption Structure in USA, 2014
Flame Retardant Proportion in Antimony Consumption Structure in USA, 2010-2014
Policies, Regulations and Standards on China Antimony Industry, 1991-2015
Index of Gross Exploitation Amount in China, 2009-2013 (Unit: ton)
China’s First Two Batches of Export Quotas for Antimony and Its Products, 2014
China’s First Two Batches of Export Quotas for Antimony Oxide, 2014
China’s First Two Batches of Export Quotas for Antimony and Its Products, 2015
China’s First Two Batches of Export Quotas for Antimony Oxide, 2015
China’s Export Quotas for Antimony and Its Products, 2012-2015
China’s Export Quotas for Antimony Oxide, 2012-2015
Basic Reserves and Proven Reserves of Antimony in China, 2006-2014
Antimony Resource Distribution in China
Antimony Products Output in China, 2009-2015
Antimony Concentrate Output in China, 2009-2015
Regional Structure of Antimony Products Output in China, Jan.-Sep., 2015
Antimony Consumption Structure in China in 2015
Major Application Fields of Antimony
Application of Flame Retardant in Auto
Output of Lead-acid Storage Battery in China, 2008-2015
Consumption Amount of Antimony in China, 2001-2015
Antimony Ingot 2# Prices in Chinese Market, 2015
Antimony Trioxide 99.5% Prices in Chinese Market, 2015
Antimony Sulfide Concentrate 55% Prices in Chinese Market, 2015
Antimony Products Offers in Chinese Market, November 13, 2015
Antimony Products Capacity of Major Producers in China, 2015
Import and Export Tariff of Antimony Products in China, 2015
Import and Export Data of Antimony Products in China, Jan.-Aug., 2015
Import Volume of Antimony Products in China, 2009-2015
Import Value of Antimony Products in China, 2009-2015
Export Volume of Antimony Products in China, 2009-2015
Export Value of Antimony Products in China, 2009-2015
Revenue and YoY Growth of Hunan Gold Corporation Limited, 2009-2015
Net Income and YoY Growth of Hunan Gold Corporation Limited, 2009-2015
Revenue Structure of Hunan Gold Corporation Limited (by Business Unit), 2011-2015
Revenue Structure of Hunan Gold Corporation Limited (by Region), 2009-2015
Gross Margin of Hunan Gold Corporation Limited, 2012-2015
Output of Antimony Products of Hunan Gold Corporation Limited, 2010-2015
Antimony Export Quotas of Hunan Zhongnan Antimony-Tungsten Industry Trading Company, 2011-2015
Hunan Gold Corporation Limited’s R & D Cost and % of Revenue, 2011-2015
Revenue and Net Income of Hunan Gold Corporation Limited, 2015-2018E
Development Course of Hsikwangshan Twinkling Star
Antimony Export Quota of Hsikwangshan Twinkling Star, 2011-2015
Equity Structure of China Minmetals Non-ferrous Metals
Basic Information of China Antimony Chemicals
Basic Information of China Antimony Technology
Antimony Export Quota of China Minmetals Non-ferrous Metals, 2011-2015
Antimony Export Quota of Guangxi China Tin, 2009-2015
Basic Information of Guangxi Youngsun Chemicals
Antimony Oxide of Guangxi Youngsun Chemicals
Antimony Export Quota of Guangxi Youngsun Chemicals, 2011-2015
Antimony Export Quota of Dongguan Jiefu Flame-Retarded Materials, 2014-2015
Sales Network of Yunnan Muli Antimony Industry
Basic Information of Yunnan Muli Antimony Industry
Antimony Export Quota of Yunnan Muli Antimony Industry, 2011-2015
Basic Information of Guangxi Guangtian Smelting
Basic Information of Hechi Wuji
Output Growth of Antimony Products and Concentrate in China, 2010-2015
Output and Consumption of Antimony Products in China, 2015-2018E
如果这份报告不能满足您的要求,我们还可以为您定制报告,请 留言说明您的详细需求。
|