|
|
|
报告导航:研究报告—
制造业—材料
|
|
2015-2018年全球及中国低辐射玻璃行业研究报告 |
 |
字数:2.8万 |
页数:100 |
图表数:135 |
|
中文电子版:8000元 |
中文纸版:4000元 |
中文(电子+纸)版:8500元 |
|
英文电子版:2300美元 |
英文纸版:2400美元 |
英文(电子+纸)版:2600美元 |
|
编号:ZHP031
|
发布日期:2015-12 |
附件:下载 |
 |
|
|
Low-E玻璃又称低辐射玻璃,是一种新型节能玻璃,主要应用在建筑节能领域。中国政府从90年代起开始出台政策支持建筑节能产业的发展,从而也带动了低辐射玻璃的发展。Low-e玻璃的产能从2005年的2,500万平方米/年扩张至2015年的6.6亿平方米/年,年均复合增长率高达38.7%。
虽然中国Low-e玻璃产能快速增长,但受生产技术的制约(尤其是在线镀膜技术方面)其产能利用率相对较低。2014年,中国Low-e玻璃产量为1.5亿平方米,同比增长11.9%,产能利用率仅25.1%。2015年,在玻璃市场整体运行稳定的大环境下,预计中国Low-e玻璃的产能利用率将小幅增长至25.8%。此外,中国Low-e玻璃的普及率也比较低。目前,欧美日韩等发达地区的Low-e使用率已经达到80%左右,而中国的使用率尚不足15%。
近两年,受房地产市场调整的影响,Low-e玻璃价格波动较大。例如6mm单银Low-e玻璃,2012年该产品价格大约在210元/重箱左右;2013年开始不断下滑,至2015年中旬已经下滑至120元/重箱左右。
全球主要的Low-e玻璃生产商包括美国的PPG,日本的NSG、AGC,法国的圣戈班,中国的南玻、台玻、旗滨等。为了应对产品价格下跌、市场下行的压力,全球各企业纷纷采取措施积极应对,如PPG进行附加值较高的新型产品的研发;台玻集团、旗滨集团则在目标市场新建生产基地。
PPG:积极进行新型Low-e玻璃的研发。2014年9月,推出新型Low-e玻璃——SOLARBAN67(具有柔软、透明度高等优点);2015年8月,与Walker玻璃公司合作研发一款新型高性能防鸟撞的阳光控制Low-e玻璃。
台玻集团:是继日本NSG之后,全球第二家拥有低辐射真空玻璃生产厂的制造商,生产基地位于台湾彰滨。2015年底,投资2.4亿美元建设的沈阳分厂将投产,届时会新增一条复层Low-E玻璃生产线、两条真空Low-E玻璃生产线。
南玻集团:Low-E玻璃生产基地位于天津、东莞、吴江、咸宁、成都。产品在高端Low-e玻璃市场具有较强竞争力——公司生产的三银Low-e玻璃国际市场占有率在30%左右,而中国国内市场占有率大约在60%左右。
旗滨集团:2015年5月,决定投资11.7亿元在马来西亚森美兰州建设一条600t/d的Low-E在线镀膜玻璃生产线和一条600t/d高档多元化玻璃生产线,以满足东南亚、中亚、中东等地区的市场需求。
水清木华研究中心《2015-2018年全球及中国低辐射玻璃行业研究报告》着重研究了以下内容:
 全球低辐射玻璃发展环境、市场规模、普及率等情况; 全球低辐射玻璃发展环境、市场规模、普及率等情况;
中国低辐射玻璃产业政策、技术现状等情况;
中国低辐射玻璃供需现状、竞争格局、市场价格、应用等情况;
国外4家、中国13家低辐射玻璃生产商经营情况、营收构成、低辐射玻璃业务等情况。
Low-E glass, a new type of energy-saving glass, is mainly used in the field of building energy conservation. Chinese Government has introduced policies to support the development of the building energy efficiency industry since the 1990s, which propels the advancement of Low-E glass. The annual Low-E glass capacity jumps from 25 million m2 in 2005 to 660 million m2 in 2015, presenting a CAGR of 38.7%.
Although China’s Low-E glass capacity grows rapidly, the constraint of production technologies (especially online coating technology) leads to a low capacity utilization rate. In 2014, China’s Low-E glass output ascended 11.9% year on year to 150 million m2, while the capacity utilization rate was only 25.1%. In 2015, the capacity utilization rate is expected to hit 25.8% amid the stable glass market. In addition, China's Low-E glass penetration rate is less than 15%, still lagging far behind 80% in Europe, Japan, South Korea, the United States and other developed countries.
In the past two years, the adjustment in real estate market has incurred fluctuations in the Low-E glass price. For example, the price of 6mm single-silver Low-E glass dropped from RMB210 /weight case in 2012 to RMB120/weight case in mid-2015.
The world's leading Low-E glass manufacturers include the US-based PPG, Japan-based NSG and AGC, France-based Saint-Gobain, China-based CSG, Taiwan Glass Group, Kibing Group and so on. These players have taken measures in response to falling commodity prices and downward market trends, like PPG develops higher value-added new products; Taiwan Glass Group and Kibing Group set up new production bases in target markets.
PPG is enthusiastic about R & D of new-type Low-E glass. In September 2014, it launched SOLARBAN67 featured with excellent flexibility, transparency and other merits; in August 2015, it collaborated with Walker Glass to develop new-type high-performance anti-bird-strike solar control Low-E glass.
Following Japan NSG, Taiwan Glass Group is the world's second producer boasting Low-E glass plants. Its production base is located in Changbin, Taiwan. At the end of 2015, a Low-E glass factory consisting of a Low-E laminated glass production line and two Low-E vacuum glass production lines in Shenyang invested by USD240 million is expected to be completed and put into production.
CSG Holding has Low-E glass production bases in Tianjin, Dongguan, Wujiang, Xianning and Chengdu. It shows strong competitiveness in the high-end Low-E glass market -- its triple-silver Low-E glass seizes about 30% shares of the international market and 60% shares of Chinese market.
In May 2015, Kibing Group decided to invest RMB1.17 billion in a 600t/d Low-E online coated glass production line and a 600t/d high-end diversified glass production line in Negeri Sembilan, Malaysia to meet the market demand in Southeast Asia, Central Asia, the Middle East and other regions.
Global and China Low-E Glass Industry Report, 2015-2018 focuses on the followings:
 Development environments, market size, penetration rate and others of global Low-E glass industry; Development environments, market size, penetration rate and others of global Low-E glass industry;
Policies, technologies, etc. of China’s Low-E glass industry;
Supply, demand, competition pattern, market prices, applications, etc. of China’s Low-E glass industry;
Operation, revenue structure, Low-E glass business, etc. of 4 foreign and 13 Chinese Low-E glass manufacturers.
第一章 低辐射玻璃行业概述
1.1 定义与分类
1.2 节能效果
第二章 全球低辐射玻璃行业现状
2.1 发展历程
2.2 主要国家建筑节能政策
2.2.1 德国
2.2.2 美国
2.2.3 日本
2.3 市场现状
第三章 中国低辐射玻璃行业运行环境
3.1 政策环境
3.2 社会环境
3.3 技术环境
第四章 中国低辐射玻璃供给状况
4.1 生产成本
4.2 供给
4.2.1 产能
4.2.2 产量
4.3 竞争格局
第五章 中国低辐射玻璃需求状况
5.1 应用现状
5.2 需求
5.2.1 销售收入
5.2.2 需求量
5.3 价格
第六章 全球重点企业分析
6.1 PPG工业公司
6.1.1 企业简介
6.1.2 经营情况
6.1.3 营收构成
6.1.4 Low-E玻璃业务
6.1.5 在华业务
6.2 日本板硝子株式会社(NSG)
6.2.1 企业简介
6.2.2 经营情况
6.2.3 营收构成
6.2.4 Low-E玻璃业务
6.2.5 在华业务
6.3 旭硝子株式会社(AGC)
6.3.1 企业简介
6.3.2 经营情况
6.3.3 营收构成
6.3.4 Low-E玻璃业务
6.3.5 在华业务
6.4 圣戈班集团(Saint-Gobain)
6.4.1 企业简介
6.4.2 经营情况
6.4.3 营收构成
6.4.4 Low-E玻璃业务
6.4.5 在华业务
第七章 中国重点企业分析
7.1中国南玻集团股份有限公司
7.1.1 企业简介
7.1.2 经营情况
7.1.3 营收构成
7.1.4 毛利率
7.1.5 研发与投资
7.1.6 Low-E玻璃业务
7.2 台玻集团
7.2.1 企业简介
7.2.2 经营情况
7.2.3 Low-E玻璃业务
7.2.4 台玻长江玻璃有限公司
7.2.5 台玻成都玻璃有限公司
7.2.6 台玻安徽玻璃有限公司
7.2.7 台玻咸阳玻璃有限公司
7.3 信义玻璃控股有限公司
7.3.1 企业简介
7.3.2 经营情况
7.3.3 营收构成
7.3.4 毛利率
7.3.5 Low-E玻璃业务
7.4 上海耀皮玻璃集团股份有限公司
7.4.1 企业简介
7.4.2 经营情况
7.4.3 营收构成
7.4.4 毛利率
7.4.5 研发与投资
7.4.6 Low-E玻璃业务
7.5 中国玻璃控股有限公司
7.5.1 企业简介
7.5.2 经营情况
7.5.3 营收构成
7.5.4 毛利率
7.5.5 Low-E玻璃业务
7.6 中航三鑫股份有限公司
7.6.1 企业简介
7.6.2 经营情况
7.6.3 营收构成
7.6.4 毛利率
7.6.5 Low-E玻璃业务
7.7 株洲旗滨集团股份有限公司
7.7.1 企业简介
7.7.2 经营情况
7.7.3 营收构成
7.7.4 毛利率
7.7.5 Low-E玻璃业务
7.8 山东金晶科技股份有限公司
7.8.1 企业简介
7.8.2 经营情况
7.8.3 营收构成
7.8.4 毛利率
7.8.5 Low-E玻璃业务
7.9 其他企业
7.9.1 格兰特工程玻璃(中山)有限公司
7.9.2 苏州华东镀膜玻璃有限公司
7.9.3 威海蓝星玻璃股份有限公司
7.9.4 中国耀华玻璃集团有限公司
7.9.5 明达玻璃(厦门)有限公司
第八章 总结与预测
8.1 市场
8.2 企业
1. Overview of Low-E Glass Industry
1.1 Definition and Classification
1.2 Energy-saving Effect
2. Status of Global Low-E Glass Industry
2.1 Development History
2.2 Building Energy-saving Policies of Main Countries
2.2.1 Germany
2.2.2 USA
2.2.3 Japan
2.3 Market Status
3. Operating Environment for China Low-E Glass Industry
3.1 Policy Environment
3.2 Social Environment
3.3 Technological Environment
4. Low-E Glass Supply in China
4.1 Production Cost
4.2 Supply
4.2.1 Capacity
4.2.2 Output
4.3 Competition
5. Low-E Glass Demand in China
5.1 Application
5.2 Demand
5.2.1 Revenue
5.2.2 Volume
5.3 Price
6. Key Global Players
6.1 PPG Industries
6.1.1 Profile
6.1.2 Operation
6.1.3 Revenue Structure
6.1.4 Low-E Glass Business
6.1.5 Business in China
6.2 Nippon Sheet Glass (NSG)
6.2.1 Profile
6.2.2 Operation
6.2.3 Revenue Structure
6.2.4 Low-E Glass Business
6.2.5 Business in China
6.3 Asahi Glass Co. (AGC)
6.3.1 Profile
6.3.2 Operation
6.3.3 Revenue Structure
6.3.4 Low-E Glass Business
6.3.5 Business in China
6.4 Saint-Gobain
6.4.1 Profile
6.4.2 Operation
6.4.3 Revenue Structure
6.4.4 Low-E Glass Business
6.4.5 Business in China
7. Key Players in China
7.1 CSG Holding
7.1.1 Profile
7.1.2 Operation
7.1.3 Revenue Structure
7.1.4 Gross Margin
7.1.5 R&D and Investment
7.1.6 Low-E Glass Business
7.2 Taiwan Glass Group
7.2.1 Profile
7.2.2 Operation
7.2.3 Low-E Glass Business
7.2.4 TG Changjiang Glass Co., Ltd.
7.2.5 TG Chengdu Glass Co., Ltd.
7.2.6 TG Anhui Glass Co., Ltd.
7.2.7 TG Xianyang Glass Co., Ltd.
7.3 Xinyi Glass
7.3.1 Profile
7.3.2 Operation
7.3.3 Revenue Structure
7.3.4 Gross Margin
7.3.5 Low-E Glass Business
7.4 Shanghai Yaohua Pilkington Glass Group Co., Ltd. (SYP Group)
7.4.1 Profile
7.4.2 Operation
7.4.3 Revenue Structure
7.4.4 Gross Margin
7.4.5 R&D and Investment
7.4.6 Low-E Glass Business
7.5 China Glass
7.5.1 Profile
7.5.2 Operation
7.5.3 Revenue Structure
7.5.4 Gross Margin
7.5.5 Low-E Glass Business
7.6 AVIC Sanxin
7.6.1 Profile
7.6.2 Operation
7.6.3 Revenue Structure
7.6.4 Gross Margin
7.6.5 Low-E Glass Business
7.7 Zhuzhou Kibing Group
7.7.1 Profile
7.7.2 Operation
7.7.3 Revenue Structure
7.7.4 Gross Margin
7.7.5 Low-E Glass Business
7.8 Shandong Jinjing Science & Technology Stock Co., Ltd.
7.8.1 Profile
7.8.2 Operation
7.8.3 Revenue Structure
7.8.4 Gross Margin
7.8.5 Low-E Glass Business
7.9 Others
7.9.1 Grand Engineering Glass (ZhongShan) Co., Ltd.
7.9.2 Suzhou Huadong Coating Glass Co., Ltd.
7.9.3 Weihai Blue Star Glass Holding Co., Ltd
7.9.4 China Yaohua Glass Group Corporation
7.9.5 Intex Glass (Xiamen) Co., Ltd.
8. Summary and Forecast
8.1 Market
8.2 Enterprise
图:节能玻璃分类
图:Low-E玻璃分类
表:离线法与在线法Low-E玻璃的区别
表:低辐射玻璃主要品种及适用性
图:主要玻璃光热参数
表:各种玻璃节能效果对比
图:全球Low-E玻璃发展历程
表:德国建筑节能相关政策
表:德国窗户传热系数限值标准
表:美国建筑节能相关政策
图:1975-2015年美国居住建筑及商业建筑能源效率改善趋势
表:日本建筑节能相关政策
图:1990-2018年全球Low-E玻璃产量及增速
图:欧洲主要国家Low-E玻璃在建筑领域普及度
图:2014年全球主要国家Low-E玻璃普及率
表:国外Low-E玻璃主要制造商
表:2011-2015年中国建筑节能相关政策及法规
图:2010-2018年中国新增节能建筑面积
表:不同结构玻璃的节能效果
图:Low-E玻璃制造成本结构(以进口设备为例)
图:Low-E玻璃单位加工成本
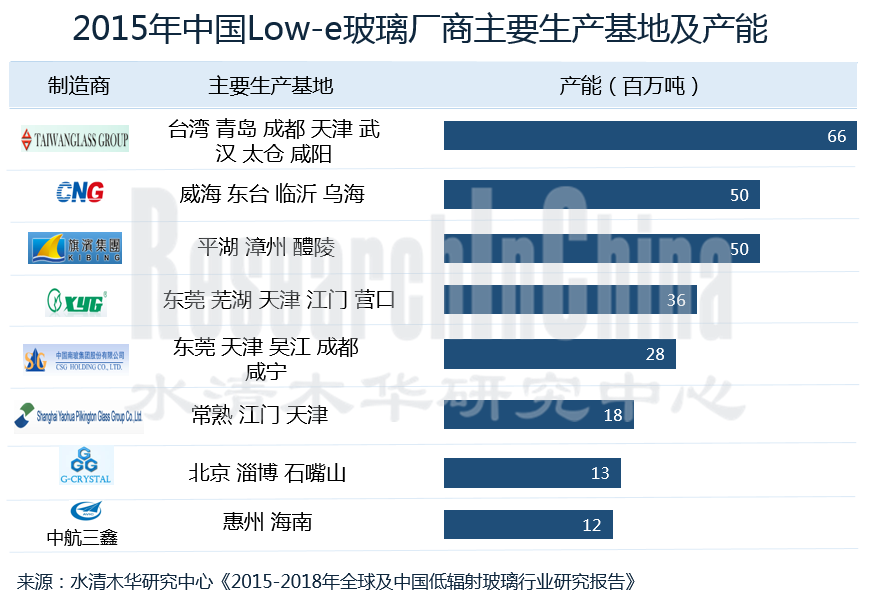
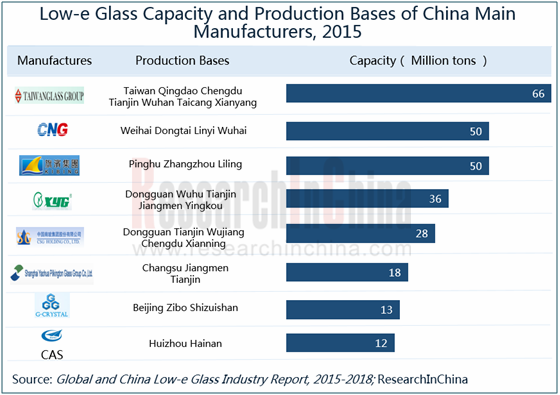
表:2015年中国主要企业Low-E玻璃产能
图:2006-2018年中国Low-e玻璃产能
表:中国部分采用国产设备的Low-E玻璃生产线
图:2014年中国Low-E玻璃(分省市)产能构成
图:2006-2018年中国Low-E玻璃产量及增速
图:2015年中国Low-E玻璃市场竞争格局
图:2008-2015年中国Low-E玻璃主要企业营业收入
图:中国社会总能耗中各种能耗占比
图:中国北方住宅建筑能耗中各种能耗占比
图:2006-2018年中国Low-E玻璃行业销售收入
图:2006-2018年中国建筑玻璃及Low-E玻璃需求量
图:2014-2015年中国6mm Low-E玻璃价格
表:2015年PPG工厂(分地区)分布
图:2008-2015年PPG营业收入与净利润
图:2009-2015年PPG(分业务)营业收入构成
图:2011-2014年PPG(分地区)营业收入
图:PPG公司Low-E玻璃业务结构
图:2007-2015年PPG玻璃业务收入与净利润
表:PPG在中国的Low-E玻璃业务合作情况
表:2015年NSG全球生产力分布
图:2009-2016财年NSG营业收入与净利润
图:2016年NSG发展规划
图:2009-2016财年NSG(分业务)营业收入构成
图:2013-2015财年NSG(分地区)营业收入构成
图:2015财年NSG主要产品(分地区)营业收入构成
图:FY2009-FY2016年NSG建筑玻璃业务收入与营业利润
表:2015年NSG在中国主要子公司分布
图:AGC(分地区)玻璃生产线
图:2008-2015年AGC营业收入与净利润
图:2015年AGC生产力布局
图:2010-2015年AGC集团(分产品)营业收入构成
图:2011-2014年AGC集团(分地区)营业收入构成
图:AGC集团玻璃业务主要产品及服务
图:2009-2015年AGC玻璃业务营业收入与增速
表:2013-2015年AGC玻璃业务(分地区)营业收入
图:2015年AGC在中国(分产品)主要子公司
图:AGC中国区营销网络
图:2014年圣戈班员工分布
图:2009-2015年圣戈班营业收入与净利润
图:2009-2015年圣戈班(分业务)营业收入构成
图:2009-2015年圣戈班(分地区)营业收入构成
图:2015年圣戈班平板玻璃业务产品
图:2009-2015年圣戈班平板玻璃业务营业收入与营业利润
图:2002-2015年圣戈班在中国的销售额及增速
表:2015年圣戈班玻璃业务在中国的主要企业
图:2015年南玻集团股权结构
图:南玻集团全球营销网络
图:2007-2015年南玻集团营业收入与净利润
图:2008-2015年南玻集团(分产品)营业收入构成
图:2008-2015年南玻集团(分地区)营业收入构成
图:2008-2015年南玻集团(分产品)毛利率
表:2015年南玻集团主要工程玻璃相关项目
图:2008-2015年南玻集团工程玻璃业务收入及增速
表:2012-2015年南玻集团工程玻璃业务主要子公司营业收入
表:2015年南玻集团(分产品/分地区) Low-E玻璃产能
图:2015年台玻集团生产基地分布
图:2008-2015年台玻集团营业收入与净利润
图:2015年台玻集团平板玻璃生产基地分布
表:2015年台玻集团(分工厂)Low-E玻璃生产线及产能
表:2015年长江玻璃产品生产线情况
表:台玻安徽玻璃生产线项目
图:2015年信义集团股权结构
图:2007-2015年信义集团营业收入与净利润
图:2007-2015年信义玻璃(分产品)营业收入构成
图:2007-2015年信义玻璃(分地区)营业收入构成
图:2008-2015年信义玻璃(分产品)毛利率
图:信义玻璃中国区工程玻璃营销网络
表:2015年信义玻璃主要Low-E玻璃生产线及产能
图:耀皮玻璃中国营销网络
图:2015年耀皮玻璃股权结构
图:2007-2015年耀皮玻璃营业收入与净利润
图:2008-2015年耀皮玻璃(分产品)营业收入构成
图:2006-2015年耀皮玻璃(分地区)营业收入
图:2006-2015年耀皮玻璃(分产品)毛利率
表:2015年耀皮玻璃拟建设项目
表:2015年耀皮玻璃Low-E玻璃产能
图:2015年中国玻璃股权结构
图:2007-2015年中国玻璃营业收入与净利润
图:2010-2015年中国玻璃(分产品)营业收入构成
图:2008-2014年中国玻璃(分地区)营业收入
图:2010-2014年中国玻璃(分产品)毛利率
图:2010-2015年中国镀膜玻璃业务收入
表:2015年中国玻璃Low-E玻璃生产线及产能
图:2015年中航三鑫股权结构
图:2007-2015年中航三鑫营业收入与净利润
表:2014年中航三鑫子公司营业收入与净利润
图:2008-2015年中航三鑫(分产品)营业收入构成
图:2008-2015年中航三鑫(分地区)营业收入
图:2008-2015年中航三鑫(分产品)毛利率
图:2008-2015年中航三鑫特种玻璃业务收入及增速
表:2015年中航三鑫Low-E玻璃生产线
图:2015年旗滨集团股权结构
图:旗滨集团全球营销网络
图:2008-2015年旗滨集团营业收入与净利润
图:2008-2015年旗滨集团(分产品)营业收入构成
图:2008-2015年旗滨集团(分地区)营业收入
图:2008-2015年旗滨集团(分产品)毛利率
表:2015年旗滨集团Low-E玻璃产品产能
图:2015年金晶科技股权结构
图:2006-2015年金晶科技营业收入与净利润
表:2008-2015年金晶科技(分产品)营业收入及占比
图:2008-2015年金晶科技(分地区)营业收入
图:2008-2015年金晶科技(分产品)毛利率
表:2015年金晶科技Low-E玻璃产品产能
表:2015年金晶科技在建Low-E玻璃项目
图:2015年华东玻璃股权结构
图:2007-2015年蓝星玻璃营业收入与净利润
图:2015年耀华玻璃股权结构
表:耀华玻璃主要产品及子公司
图:明达玻璃全球营销网络
图:2013-2018年全球及中国Low-E玻璃产量
图:2007-2018年中国Low-E玻璃产能及需求增速
图:2008-2015年全球主要Low-E玻璃生产商营业收入增速
图:2015年中国生产商Low-E玻璃产能排名(Top 10)
Classification of Energy-efficient Glass
Classification of Low-E Glass
Difference between Offline and Online Low-E Glass
Applicability of Low-E Glass by Main Varieties
Optothermal Parameters of Major Classes
Comparison of Energy-saving Effect of Glasses
Development History of Global Low-E Glass
Building Energy-saving Policies in Germany
German Standards for Limiting Window Heat Transfer Coefficient
Building Energy-saving Policies in the U.S.
Residential and Commercial Building Energy Efficiency Improvement Trends in the U.S., 1975-2015
Building Energy-saving Policies in Japan
Global Low-E Glass Output and Growth Rate, 1990-2018E
Popularity of Low-E Architectural Glass in Major European Countries
Popularity of Low-E Glass in Major Countries Worldwide, 2014
Main Low-E Glass Manufacturers Abroad
Building Energy-saving Policies and Regulations in China, 2011-2015
New Energy-saving Building Area in China, 2010-2018E
Energy-saving Effects of Different Glass Structures
Cost Structure of Low-E Glass Manufacturing (e.g. Imported Equipment)
Unit Cost of Low-E Glass Processing
Low-E Glass Capacity of Major Enterprises in China, 2015
Low-E Glass Capacity of China, 2006-2018E
Some Low-E Glass Production Lines Adopting Homemade Equipment in China
Capacity Structure of Low-E Glass in China (by Province/City), 2014
Output and Growth Rate of Low-E Glass in China, 2006-2018E
Competition Pattern in Chinese Low-E Glass Market, 2015
Revenue of Major Low-E Glass Enterprises in China, 2008-2015
Total Energy Consumption Structure in China
Residential Building Energy Consumption Structure in Northern China
Revenue of China Low-E glass Industry, 2006-2018E
Demand for Building Glass and Low-E Glass in China, 2006-2018E
6mm Low-E Glass Price in China, 2014-2015
Distribution of PPG Factories (by Region), 2015
Revenue and Net Income of PPG, 2008-2015
Revenue Structure of PPG (by Business), 2009-2015
Revenue Breakdown of PPG (by Region), 2011-2014
Low-E Glass Business Structure of PPG
Glass Revenue and Net Income of PPG, 2007-2015
Low-E Glass-related Cooperation of PPG in China
Global Productivity Distribution of NSG, 2015
Revenue and Net Income of NSG, FY2009-FY2016E
Development Plan of NSG, 2016E
Revenue Structure of NSG (by Business), FY2009-FY2016E
Revenue Structure of NSG (by Region), FY2013-FY2015
Revenue Structure of NSG’s Main Products (by Region), FY2015
Revenue and Operating Income of NSG’s Architectural Glass Business, FY2009-FY2016E
Distribution of NSG’s Major Subsidiaries in China, 2015
Glass Production Lines of AGC (by Region)
Revenue and Net Income of AGC, 2008-2015
AGC’s Productivity Distribution, 2015
Revenue Structure of AGC (by Product), 2010-2015
Revenue Structure of AGC (by Region), 2011-2014
Main Products and Services of AGC’s Glass Business
Revenue and Growth Rate of AGC’s Glass Business, 2009-2015
Revenue of AGC’s Glass Business (by Region), 2013-2015
Major Subsidiaries of AGC in China (by Product), 2015
Marketing Network of AGC in China
Staff Distribution of Saint-Gobain, 2014
Revenue and Net Income of Saint-Gobain, 2009-2015
Revenue Structure of Saint-Gobain (by Business), 2009-2015
Revenue Structure of Saint-Gobain (by Region), 2009-2015
Flat Glass Products of Saint-Gobain, 2015
Revenue and Operating Income of Saint-Gobain’s Flat Glass Business, 2009-2015
Sales and Growth Rate of Saint-Gobain’s Sales in China, 2002-2015
Major Glass Enterprises of Saint-Gobain in China, 2015
Equity Structure of CSG, 2015
Global Marketing Network of CSG
Revenue and Net Income of CSG, 2007-2015
Revenue Structure of CSG (by Product), 2008-2015
Revenue Structure of CSG (by Region), 2008-2015
Gross Margin of CSG (by Product), 2008-2015
Main Architectural Glass-related Projects of CSG, 2015
Revenue and Growth Rate of CSG’s Architectural Glass Business, 2008-2015
Revenue of CSG’s Major Architectural Glass Subsidiaries, 2012-2015
Low-E Glass Capacity of CSG (by Product/Region), 2015
Distribution of Production Bases of Taiwan Glass Group, 2015
Revenue and Net Income of Taiwan Glass Group, 2008-2015
Distribution of Flat Glass Production Bases of Taiwan Glass Group, 2015
Capacity of Low-E Glass Production Lines of Taiwan Glass Group (by Factory), 2015
Production Lines of TG Changjiang Glass, 2015
Production Lines of TG Anhui Glass
Equity Structure of Xinyi Group, 2015
Revenue and Net Income of Xinyi Group, 2007-2015
Revenue Structure of Xinyi Glass (by Product), 2007-2015
Revenue Structure of Xinyi Glass (by Region), 2007-2015
Gross Margin of Xinyi Glass (by Product), 2008-2015
Architectural Glass Sales Network of Xinyi Glass in China
Capacities of Major Low-E Glass Production Lines of Xinyi Glass, 2015
Marketing Network of SYP Group in China
Equity Structure of SYP Group, 2015
Revenue and Net Income of SYP Group, 2007-2015
Revenue Structure of SYP Group (by Product), 2008-2015
Revenue of SYP Group (by Region), 2006-2015
Gross Margin of SYP Group (by Product), 2006-2015
Proposed Projects of SYP Group, 2015
Low-E Glass Capacity of SYP Group, 2015
Equity Structure of China Glass, 2015
Revenue and Net Income of China Glass, 2007-2015
Revenue Structure of China Glass (by Product), 2010-2015
Revenue of China Glass (by Region), 2008-2014
Gross Margin of China Class (by Product), 2010-2014
Revenue of China Coated Glass, 2010-2015
Capacity of Low-E Glass Production Lines of China Glass, 2015
Equity Structure of AVIC Sanxin, 2015
Revenue and Net Income of AVIC Sanxin, 2007-2015
Revenue and Net Income of AVIC Sanxin’s Subsidiaries, 2014
Revenue Structure of AVIC Sanxin (by Product), 2008-2015
Revenue of AVIC Sanxin (by Region), 2008-2015
Gross Margin of AVIC Sanxin (by Product), 2008-2015
Revenue and Growth Rate of AVIC Sanxin’s Special Glass Business, 2008-2015
Low-E Glass Production Lines of AVIC Sanxin, 2015
Equity Structure of Kibing Group, 2015
Global Marketing Network of Kibing Group
Revenue and Net Income of Kibing Group, 2008-2015
Revenue Structure of Kibing Group (by Product), 2008-2015
Revenue of Kibing Group (by Region), 2008-2015
Gross Margin of Kibing Group (by Product), 2008-2015
Capacities of Low-E Glass Products of Kibing Group, 2015
Equity Structure of Shandong Jinjing Science & Technology, 2015
Revenue and Net Income of Shandong Jinjing Science & Technology, 2006-2015
Revenue and Percentage of Shandong Jinjing Science & Technology (by Product), 2008-2015
Revenue of Shandong Jinjing Science & Technology (by Region), 2008-2015
Gross Margin of Shandong Jinjing Science & Technology (by Product), 2008-2015
Capacities of Low-E Glass Products of Shandong Jinjing Science & Technology, 2015
Low-E Glass Projects under Construction of Shandong Jinjing Science & Technology, 2015
Equity Structure of Huadong Coating Glass, 2015
Revenue and Net Income of Blue Star Glass, 2007-2015
Equity Structure of China Yaohua Glass Group Corporation, 2015
Main Products and Subsidiaries of China Yaohua Glass Group Corporation
Global Marketing Network of Intex Glass
Global and China Low-E Glass Output, 2013-2018E
Capacity and Demand Growth Rate of Low-E Glass in China, 2007-2018E
Revenue Growth Rate of Major Worldwide Low-E Glass Manufacturers, 2008-2015
Top 10 Low-E Glass Manufacturers in China (by Capacity), 2015
如果这份报告不能满足您的要求,我们还可以为您定制报告,请 留言说明您的详细需求。
|