|
|
|
报告导航:研究报告—
制造业—汽车
|
|
2015-2018年中国商用车行业研究报告 |
 |
字数:2.8万 |
页数:111 |
图表数:143 |
|
中文电子版:8500元 |
中文纸版:4250元 |
中文(电子+纸)版:9000元 |
|
英文电子版:2300美元 |
英文纸版:2400美元 |
英文(电子+纸)版:2600美元 |
|
编号:ZLC-027
|
发布日期:2015-12 |
附件:下载 |
 |
|
|
2010-2014年,中国商用车销量整体下降,从4304.1千辆下降至4055千辆,占汽车总销量比重从23.8%下滑至19.7%。2015年1-9月,商用车销量为2508.7千辆,占比下降至14.7%,估计2015全年销量约3600千辆。
按车型来看,货车的销量相对最高,占比约65%左右;客车销量占比虽不高,约10%左右,但所占比重逐年升高。2015年1-9月,中国货车和客车销量分别为1649.9千辆和367.6千辆,占比分别为65.8%和14.7%。
中国是一个商用车出口大国,2015年1-9月,中国商用车出口量达257.1千辆,占汽车出口总量的43.1%。其中,货车和客车出口量分别达195.3千辆和45.8千辆。越南、阿尔及利亚、缅甸等亚洲、非洲国家为中国商用车主要出口地区。
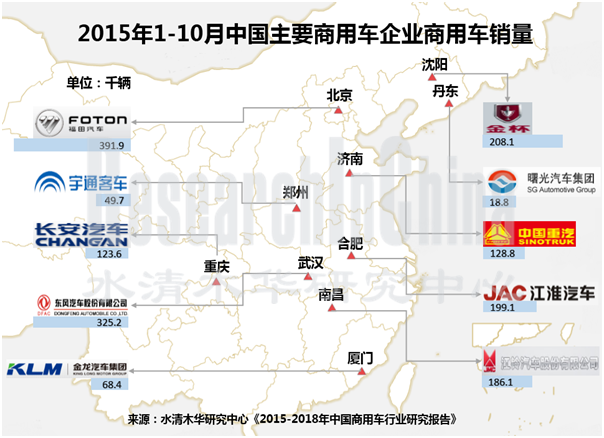
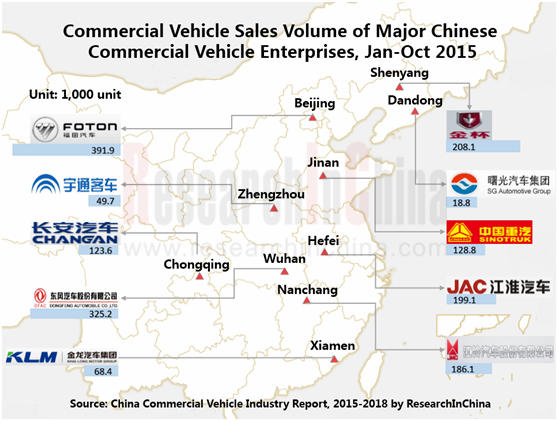
目前,中国市场上共有销售商用车企业74家,市场竞争类型属于高度竞争类型。其中,福田汽车、东风汽车、金杯汽车、江淮汽车、江铃汽车、宇通客车、金龙汽车等企业的竞争实力相对较强。
福田汽车是中国品种最全、规模最大的商用车企业。2014年,公司商用车销量达547.9千辆,占中国商用车总销量的14.5%,排名第一。近两年,公司加大了对新能源商用车的研发和投放。2014年,公司推出欧辉智蓝系列纯电动产品、奥铃CNG轻卡、全球首台LNG动力泵车等,全年新能源汽车(含天然气)实现销量11964辆。
东风汽车2014年商用车销量达500.2千辆,销量占比达13.2%,排名第二。公司自2005年开始着手新能源汽车产品的研发,是最早实现新能源商品化的企业,产品覆盖公交、公路、城市物流、环卫、专用车等多个细分市场。2015年6-11月,公司先后与上海北斗新能源、浙江时空、昆山广得源、浙江中电和北京中瑞蓝科等5家企业签订了共计17000辆新能源汽车的订单。
金龙汽车以大、中、轻型客车的制造与销售为主导产业。2014年,公司大型和中型客车销量分别达24385辆和15417辆,销量占比分别达29.9%和24.6%,均排名第二。同时,公司实现了中国客车历史上首次欧Ⅵ高端车型的大批量出口。此外,公司推出了一系列涵盖插电式混合动力、纯电动的新能源客车产品,2014年新能源客车销量3431辆,2015上半年达4150辆。
随着全国开始全面实行国四排放标准,中国商用车市场面临着结构调整期。而《中国制造2025战略》的发布,表明国家对智能汽车、节能与新能源汽车支持力度在不断加大,这为传统商用车企业提供了很好的发展机遇。目前,福田汽车、东风汽车、江淮汽车、宇通客车、金龙汽车等商用车企业已着力于新能源汽车技术的研发升级和产品的投放,初步占据了中国新能源商用车市场。
《2015-2018年中国商用车行业报告》主要包括以下内容:
 商用车行业概述,包括定义、分类及相关政策; 商用车行业概述,包括定义、分类及相关政策;
中国商用车行业发展概况,包括汽车行业发展现状、商用车产销量、预测与展望等;
中国商用车行业进出口分析;
中国商用车行业竞争情况,包括市场集中度、企业竞争格局等;
10家中国商用相关企业的经营情况、产能及产销情况、研发与投资情况等。
In 2010-2014, the sales volume of commercial vehicles in China fell from 4.3041 million units to 4.055 million units, seeing a share in total automobile sales down from 23.8% to 19.7%. During Jan.-Sept. 2015, the sales volume of commercial vehicles totaled 2.5087 million units, accounting for 14.7% of total auto sales. It is estimated that the full-year sales figure in 2015 will approximate 3.6 million units.
In terms of models, the truck sales occupied a higher portion, at around 65%; despite a low percentage of roughly 10%, the sales volume of buses embraced a rising proportion. In the first nine months of 2015, the sales volume of trucks and buses in China came to 1.6499 million units and 367,600 units, respectively, holding 65.8% and 14.7%.
In Jan.-Sept. 2015, China, a big exporter of commercial vehicle, exported 257,100 commercial vehicles, a figure that made up 43.1% of total auto exports. Among them, the export volume of buses and trucks totaled 195,300 units and 45,800 units, respectively. The commercial vehicles are mainly sold to the Asian and African counties such as Vietnam, Algeria, and Myanmar.
At present, there are a total of 74 auto makers that sell commercial vehicles, which formed a highly competitive market. Among them, Beiqi Foton, Dongfeng Motor, Jinbei Automotive, JAC, JMC, Yutong Bus, and King Long Motor enjoy higher competitiveness in a relative sense.
Beiqi Foton is China’s largest commercial vehicle enterprise that has the most extensive models. In 2014, the company sold 547,900 commercial vehicles, occupying 14.5% (ranking No.1) of total sales in China. In the past two years, the company has lavished more funds into development and release of new energy commercial vehicles. In 2014, Foton launched AUV series battery vehicle products, Aoling CNG light-duty trucks, and the world’s first LNG power-pump vehicle, etc., with the full-year sales volume of 11,964 new energy vehicles (including natural gas-powered ones).
In 2014, Dongfeng Motor sold 500,200 commercial vehicles, representing 13.2% of total sales, which enabled the company to rank second. Since 2005, the company has started the development of new energy vehicle products, a move that made the company the first to achieve the commercialization of new energy vehicles. The products cover many market segments including public transportation, highway, city logistics, sanitation, and special-purpose vehicles. In Jun.-Nov. 2015, the company signed orders of an aggregate 17,000 new energy vehicles with 5 companies -- Shanghai Beidou Neo-Energy Co., Ltd., Zhejiang SKIO Matrix Co., Ltd, Kunshan Guangdeyuan EV Leasing, Zhejiang Zhongdian Automobile, and SinoEV Tech.
King Long Motor is mainly engaged in the manufacturing and sales of large, medium and light-duty buses. In 2014, the company sold 24,385 large-sized buses and 15,417 medium-sized buses, making up 29.9% and 24.6%, respectively, in both of which the company ranked second. Meanwhile, the company was the first in China to massively export European Ⅵ high-end models. Additionally, the company released a series of plug-in hybrid electric vehicles and battery electric new energy buses. In 2014, the sales volume of new energy buses reached 3,431 units, and this figure went up to 4,150 units in the first half of 2015.
As the national IV emission standard is phased in nationwide, China's commercial vehicle market is facing structural adjustment. And the release of Made in China 2025 indicates that the State will step up the support for intelligent vehicles and energy-saving and new energy vehicles, which would provide a good development opportunity to traditional commercial vehicle enterprises. At present, Beiqi Foton, Dongfeng Motor, JAC, Yutong Bus, King Long Motor and other commercial vehicle makers have been dedicated to developing and upgrading new energy automotive technologies and launching the products, basically occupying China's new energy commercial vehicle market.
China Commercial Vehicle Industry Report, 2015-2018 highlights the followings:
 Overview of commercial vehicle industry, including definition, classification, and related policies; Overview of commercial vehicle industry, including definition, classification, and related policies;
Development of China’s commercial vehicle industry, including status quo of automobile industry, output and sales volume of commercial vehicles, and forecast and outlook, etc.;
Import and export of commercial vehicles in China;
Industry competition of commercial vehicles, including market concentration, competitive landscape, etc.;
Operation, capacity, production and sales, R&D and investment, etc. of 10 Chinese commercial vehicle-related companies.
第一章 概述
1.1 定义及分类
1.2 行业相关政策
第二章 中国商用车行业发展概况
2.1 汽车行业发展现状
2.2 商用车产量
2.2.1 总产量
2.2.2 货车
2.2.3 客车
2.3 商用车销量
2.3.1 总销量
2.3.2 货车
2.3.3 客车
2.4 预测与展望
第三章 中国商用车行业进出口分析
3.1 进口
3.2 出口
第四章 中国商用车行业竞争情况
4.1 市场集中度的概念和衡量
4.2 商用车市场集中度
4.2.1 货车市场集中度
4.2.2 客车市场集中度
4.3 竞争格局
第五章 主要企业
5.1 福田汽车
5.1.1 公司简介
5.1.2 经营情况
5.1.3 营收构成
5.1.4 毛利率
5.1.5 产能
5.1.6 产销情况
5.1.7 研发与投资
5.1.8 预测与展望
5.2 东风汽车
5.2.1 公司简介
5.2.2 经营情况
5.2.3 营收构成
5.2.4 毛利率
5.2.5 产能
5.2.6 产销情况
5.2.7 研发与投资
5.2.8 预测与展望
5.3 金杯汽车
5.3.1 公司简介
5.3.2 经营情况
5.3.3 营收构成
5.3.4 产销情况
5.3.5 预测与展望
5.4 江淮汽车
5.4.1 公司简介
5.4.2 经营情况
5.4.3 营收构成
5.4.4 产销情况
5.4.5 研发与投资
5.4.6 预测与展望
5.5 长安汽车
5.5.1 公司简介
5.5.2 经营情况
5.5.3 营收构成
5.5.4 产能
5.5.5 产销情况
5.5.6 研发与投资
5.5.7 预测与展望
5.6 江铃汽车
5.6.1 公司简介
5.6.2 经营情况
5.6.3 营收构成
5.6.4 产能
5.6.5 产销情况
5.6.6 研发与投资
5.6.7 预测与展望
5.7 金龙汽车
5.7.1 公司简介
5.7.2 经营情况
5.7.3 营收构成
5.7.4 产销情况
5.7.5 研发与投资
5.7.6 预测与展望
5.8 中国重汽
5.8.1 公司简介
5.8.2 经营情况
5.8.3 营收构成
5.8.4 产销情况
5.8.5 研发与投资
5.8.6 预测与展望
5.9 曙光汽车
5.9.1 公司简介
5.9.2 经营情况
5.9.3 营收构成
5.9.4 产销情况
5.9.5 研发与投资
5.9.6 预测与展望
5.10 宇通客车
5.10.1 公司简介
5.10.2 经营情况
5.10.3 营收构成
5.10.4 产销情况
5.10.5 研发与投资
5.10.6 预测与展望
1. Overview
1.1 Definition and Classification
1.2 Related Policies
2. Development of China Commercial Vehicle Industry
2.1 Status Quo of Auto Industry
2.2 Output of Commercial Vehicle
2.2.1 Total Output
2.2.2 Truck
2.2.3 Bus
2.3 Sales Volume of Commercial Vehicle
2.3.1 Total Sales Volume
2.3.2 Truck
2.3.3 Bus
2.4 Predictions and Outlook
3. Import and Export of China Commercial Vehicle Industry
3.1 Import
3.2 Export
4. Competition of China Commercial Vehicle Industry
4.1 Concept and Measurement of Market Concentration
4.2 Market Concentration of Commercial Vehicle
4.2.1 Truck
4.2.2 Bus
4.3 Competition Pattern
5. Key Companies
5.1 Beiqi Foton Motor Co., Ltd.
5.1.1 Profile
5.1.2 Operation
5.1.3 Revenue Structure
5.1.4 Gross Margin
5.1.5 Capacity
5.1.6 Production and Sales
5.1.7 R&D and Investment
5.1.8 Predictions and Outlook
5.2 Dongfeng Motor Corporation
5.2.1 Profile
5.2.2 Operation
5.2.3 Revenue Structure
5.2.4 Gross Margin
5.2.5 Capacity
5.2.6 Production and Sales
5.2.7 R&D and Investment
5.2.8 Predictions and Outlook
5.3 Shenyang Jinbei Automotive Company Limited
5.3.1 Profile
5.3.2 Operation
5.3.3 Revenue Structure
5.3.4 Production and Sales
5.3.5 Predictions and Outlook
5.4 Anhui Jianghuai Automobile Co., Ltd.
5.4.1 Profile
5.4.2 Operation
5.4.3 Revenue Structure
5.4.4 Production and Sales
5.4.5 R&D and Investment
5.4.6 Predictions and Outlook
5.5 Chongqing Changan Automobile Company Limited
5.5.1 Profile
5.5.2 Operation
5.5.3 Revenue Structure
5.5.4 Capacity
5.5.5 Production and Sales
5.5.6 R&D and Investment
5.5.7 Predictions and Outlook
5.6 Jiangling Motors Corporation, Ltd.
5.6.1 Profile
5.6.2 Operation
5.6.3 Revenue Structure
5.6.4 Capacity
5.6.5 Production and Sales
5.6.6 R&D and Investment
5.6.7 Predictions and Outlook
5.7 Xiamen King Long Motor Group Co., Ltd.
5.7.1 Profile
5.7.2 Operation
5.7.3 Revenue Structure
5.7.4 Production and Sales
5.7.5 R&D and Investment
5.7.6 Predictions and Outlook
5.8 China National Heavy Duty Truck Group Co., Ltd. (SINOTRUK)
5.8.1 Profile
5.8.2 Operation
5.8.3 Revenue Structure
5.8.4 Production and Sales
5.8.5 R&D and Investment
5.8.6 Predictions and Outlook
5.9 Liaoning SG Automotive Group Co., Ltd.
5.9.1 Profile
5.9.2 Operation
5.9.3 Revenue Structure
5.9.4 Production and Sales
5.9.5 R&D and Investment
5.9.6 Predictions and Outlook
5.10 Zhengzhou Yutong Bus Co., Ltd.
5.10.1 Profile
5.10.2 Operation
5.10.3 Revenue Structure
5.10.4 Production and Sales
5.10.5 R&D and Investment
5.10.6 Predictions and Outlook
表:中国商用车分类标准
图:2009-2015年中国汽车产量及同比增长率
图:2009-2015年中国汽车销量及同比增长率
图:2009-2014年中国商用车产量
图:2009-2015年中国商用车产量(分类型)
图:2009-2015年中国商用车产量占比(分类型)
图:2009-2015年中国商用车产量(分车型)
图:2009-2015年中国商用车产量占比(分车型)
图:2009-2015年中国货车产量(分类型)
图:2009-2015年中国货车产量占比(分类型)
图:2009-2015年中国客车产量(分类型)
图:2009-2015年中国客车产量占比(分类型)
图:2009-2014年中国商用车销量
图:2009-2015年中国商用车销量(分类型)
图:2009-2015年中国商用车销量占比(分类型)
图:2009-2015年中国商用车销量(分车型)
图:2009-2015年中国商用车销量占比(分车型)
图:2009-2015年中国货车销量(分类型)
图:2009-2015年中国货车销量占比(分类型)
图:2009-2015年中国客车销量(分类型)
图:2009-2015年中国客车销量占比(分类型)
图:2014-2018E中国商用车销量及新能源商用车销量占比
图:2010-2015年中国汽车进口量及金额
图:2010-2015年中国商用车进口量及金额
图:2010-2015年中国客车、货车进口量
图:2010-2015年中国客车、货车进口量占比
表:2015年1-8月中国商用车进口量前十的国家
表:2015年1-8月中国商用车进口数量及金额(分地区)
表:2015年1-8月中国客车、货车进口量(分地区)
图:2010-2015年中国汽车出口量及金额
图:2010-2015年中国商用车出口量及金额
图:2010-2015年中国客车及货车出口量
图:2015年中国客车、货车出口量占比
表:2015年1-8月中国商用车出口量前十的国家地区
表:2015年1-8月中国商用车出口量及出口金额(分地区)
表:2015年1-8月中国客车、货车出口量(分地区)
表:2014年中国商用车销量前十企业
表:2014年中国商用车产量前十企业
表:2014年中国重型货车销量前十企业
表:2014年中国重型货车产量前十企业
表:2014年中国中型货车销量前十企业
表:2014年中国中型货车产量前十企业
表:2014年中国轻型货车销量前十企业
表:2014年中国轻型货车产量前十企业
表:2014年中国微型货车销量前十企业
表:2014年中国微型货车产量前十企业
表:2014年中国大型客车销量前十企业
表:2014年中国大型客车产量前十企业
表:2014年中国中型客车销量前十企业
表:2014年中国中型客车产量前十企业
表:2014年中国轻型客车销量前十企业
表:2014年中国轻型客车产量前十企业
表:2014年中国商用车行业主要企业货车、客车销量(辆)
图:2011-2015年中国商用车行业主要企业营业收入
图:2012-2015年中国商用车行业主要企业研发支出
图:2011-2015年福田汽车营业收入及净利润
图:2012-2015年福田汽车营业收入(分地区)
图:2012-2015年福田汽车营业收入构成(分地区)
图:2012-2015年福田汽车营业收入(分产品)
图:2012-2015年福田汽车营业收入构成(分产品)
图:2012-2015年福田汽车毛利率(分产品)
表:2015年福田汽车产量
图:2012-2015年福田汽车商用车销量(按类型)
图:2012-2015年福田汽车前5名客户销售额及占总营收比重
表:2014-2015年福田汽车产销量(分类型)
图:2012-2015年福田汽车研发支出及占总营收比重
图:2014-2018E福田汽车营业收入及净利润
图:2011-2015年东风汽车营业收入及净利润
图:2011-2015年东风汽车营业收入(分产品)
图:2011-2015年东风汽车营业收入构成(分产品)
图:2012-2015年东风汽车营业收入(分地区)
图:2012-2015年东风汽车营业收入构成(分地区)
图:20012-2015年东风汽车毛利率(分产品)
表:2015年东风汽车产能
表:2013-2014年东风汽车产销量
表:2014-2015年东风汽车产销量
图:2012-2015年东风汽车研发支出及占总营收比重
表:截至2015上半年东风汽车在建项目
图:2014-2018E东风汽车营业收入及净利润
图:2011-2015年金杯汽车营业收入及净利润
表:2012-2015年金杯汽车营业收入(分产品)
图:2012-2015年金杯汽车营业收入(分地区)
图:2012-2015年金杯汽车营业收入构成(分地区)
表:2014-2015年金杯汽车产销量
表:截至2015上半年金杯汽车在建项目
图:2014-2018E金杯汽车营业收入及净利润
图:2011-2015年江淮汽车营业收入及净利润
图:2011-2015年江淮汽车营业收入(分产品)
图:2011-2015年江淮汽车营业收入构成(分产品)
图:2011-2015年江淮汽车营业收入(分地区)
图:2011-2015年江淮汽车营业收入构成(分地区)
表:2014-2015年江淮汽车产销量
图:2012-2015年江淮汽车研发支出及占总营收比重
表:截至2015上半年江淮汽车在建项目
表:2015年江淮汽车非公开发行A股股票预案募投项目
图:2014-2018E江淮汽车营业收入及净利润
图:2011-2015年长安汽车营业收入及净利润
表:2012-2015年长安汽车营业收入(分业务)
表:2015年长安汽车产能
表:2014-2015年长安汽车产销量
图:2011-2015年长安汽车研发支出及占总营收比重
图:2014-2018E长安汽车营业收入及净利润
图:2011-2015年江铃汽车营业收入及净利润
表:2013-2014年江铃汽车前五名客户营业收入及占总营收比重
表:2012-2015年江铃汽车营业收入(分产品)
图:2012-2015年江铃汽车营业收入(分地区)
图:2012-2015年江铃汽车营业收入构成(分地区)
表:2015年江铃汽车产能
表:2014-2015年江铃汽车产销量
图:2012-2015年江铃汽车研发支出及占总营收比重
表:2015年江铃汽车非募集资金投资的重大项目
图:2014-2018E江铃汽车营业收入及净利润
图:2011-2015年金龙汽车营业收入及净利润
图:2011-2015年金龙汽车营业收入(分地区)
图:2011-2015年金龙汽车营业收入构成(分地区)
表:2014-2015年金龙汽车产销量
图:2012-2015年金龙汽车研发支出及占总营收比重
表:2014年金龙汽车非公开发行A股股票预案募投项目
图:2014-2018E金龙汽车营业收入及净利润
图:2011-2015年中国重汽营业收入及净利润
图:2011-2015年中国重汽营业收入(分产品)
图:2011-2015年中国重汽营业收入构成(分产品)
图:2012-2015年中国重汽研发支出及占总营收比重
图:2014-2018E中国重汽营业收入及净利润
图:2011-2015年曙光汽车营业收入及净利润
图:2012-2015年曙光汽车营业收入(分产品)
图:2012-2015年曙光汽车营业收入构成(分产品)
图:2012-2015年曙光汽车营业收入(分地区)
图:2012-2015年曙光汽车营业收入构成(分地区)
表:2014-2015年曙光汽车产销量
表:2015年曙光汽车非公开发行股票预案认购情况
表:2015年曙光汽车非公开发行股票预案募投项目
图:2014-2018E曙光汽车营业收入及净利润
图:2011-2015年宇通客车营业收入及净利润
图:2012-2015年宇通客车营业收入(分业务)
图:2012-2015年宇通客车营业收入构成(分业务)
图:2012-2015年宇通客车营业收入(分地区)
图:2012-2015年宇通客车营业收入构成(分地区)
表:2014-2015年宇通客车产销量
图:2012-2015年宇通客车研发支出及占总营收比重
表:2015年宇通客车非募集资金项目情况
表:2014年宇通客车非公开发行股票发行结果
图:2014-2018E宇通客车营业收入及净利润
Chinese Classification Criterion for Commercial Vehicle
Output of Vehicles and YoY Growth in China, 2009-2015
Sales Volume of Vehicles and YoY Growth in China, 2009-2015
Output of Commercial Vehicles in China, 2009-2014
Output of Commercial Vehicles in China by Type, 2009-2015
Output Proportion of Commercial Vehicles in China by Type, 2009-2015
Output of Commercial Vehicles in China by Model, 2009-2015
Output Proportion of Commercial Vehicles in China by Model, 2009-2015
Output of Trucks in China by Type, 2009-2015
Output Proportion of Trucks in China by Type, 2009-2015
Output of Buses in China by Type, 2009-2015
Output Proportion of Buses in China by Type, 2009-2015
Sales Volume of Commercial Vehicles in China, 2009-2014
Sales Volume of Commercial Vehicles in China by Type, 2009-2015
Sales Volume Proportion of Commercial Vehicles in China by Type, 2009-2015
Sales Volume of Commercial Vehicles in China by Model, 2009-2015
Sales Volume Proportion of Commercial Vehicles in China by Model, 2009-2015
Sales Volume of Trucks in China by Type, 2009-2015
Sales Volume Proportion of Trucks in China by Type, 2009-2015
Sales Volume of Buses in China by Type, 2009-2015,
Sales Volume Proportion of Buses in China by Type, 2009-2015
Sales Volume of Commercial Vehicles and Sales Volume Proportion of New Energy Commercial Vehicles in China, 2014-2018E
Import Volume and Value of Vehicles in China, 2010-2015
Import Volume and Value of Commercial Vehicles in China, 2010-2015
Import Volume of Buses and Trucks in China, 2010-2015
Import Volume Proportion of Buses and Trucks in China, 2010-2015
Top 10 Import Origins of China’s Commercial Vehicles by Import Volume, Jan.-Aug. 2015
Import Volume and Value of Commercial Vehicles in China by Region, Jan.-Aug. 2015
Import Volume of Buses and Trucks in China by Region, Jan.-Aug. 2015
Export Volume and Value of Vehicles in China, 2010-2015
Export Volume and Value of Commercial Vehicles in China, 2010-2015
Export Volume of Buses and Trucks in China, 2010-2015
Export Volume Proportion of Buses and Trucks in China, 2015
Top 10 Export Destinations of China-made Commercial Vehicles by Export Volume, Jan.-Aug. 2015
Export Volume and Value of Vehicles in China by Region, Jan.-Aug. 2015
Export Volume of Buses and Trucks in China by Region, Jan.-Aug. 2015
Top 10 Commercial Vehicle Enterprises in China by Sales Volume, 2014
Top 10 Commercial Vehicle Manufacturers in China by Output, 2014
Top 10 Heavy-duty Truck Enterprises in China by Sales Volume, 2014
Top 10 Heavy-duty Truck Enterprises in China by Output, 2014
Top 10 Medium-duty Truck Enterprises in China by Sales Volume, 2014
Top 10 Medium-duty Truck Enterprises in China by Output, 2014
Top 10 Light-duty Truck Enterprises in China by Sales Volume, 2014
Top 10 Light-duty Truck Enterprises in China by Output, 2014
Top 10 Mini Truck Enterprises in China by Sales Volume, 2014
Top 10 Mini Truck Enterprises in China by Output, 2014
Top 10 Large-sized Bus Enterprises in China by Sales Volume, 2014
Top 10 Large-sized Bus Enterprises in China by Output, 2014
Top 10 Medium-sized Bus Enterprises in China by Sales Volume, 2014
Top 10 Medium-sized Bus Enterprises in China by Output, 2014
Top 10 Light-duty Bus Enterprises in China by Sales Volume, 2014
Top 10 Light-duty Bus Enterprises in China by Output, 2014
Sales Volume of Trucks and Buses of Major Enterprises in Commercial Vehicle Industry, 2014
Revenue of Major Enterprises in Commercial Vehicle Industry, 2011-2015
R&D Costs of Major Enterprises in Commercial Vehicle Industry, 2012-2015
Revenue and Net Income of Beiqi Foton, 2011-2015
Revenue of Beiqi Foton by Region, 2012-2015
Revenue Structure of Beiqi Foton by Region, 2012-2015
Revenue of Beiqi Foton by Product, 2012-2015
Revenue Structure of Beiqi Foton by Product, 2012-2015
Gross Margin of Beiqi Foton by Product, 2012-2015
Output of Beiqi Foton, 2015
Commercial Vehicle Sales Volume of Beiqi Foton by Type, 2012-2015
Beiqi Foton’s Revenue from Top 5 Customers and % of Total Revenue, 2012-2015
Vehicle Output and Sales Volume of Beiqi Foton by Type, 2014-2015
R&D Costs and % of Total Revenue of Beiqi Foton, 2012-2015
Revenue and Net Income of Beiqi Foton, 2014-2018E
Revenue and Net Income of Dongfeng Motor, 2011-2015
Revenue of Dongfeng Motor by Product, 2011-2015
Revenue Structure of Dongfeng Motor by Product, 2011-2015
Revenue of Dongfeng Motor by Region, 2012-2015
Revenue Structure of Dongfeng Motor by Region, 2012-2015
Gross Margin of Dongfeng Motor by Product, 20012-2015
Capacity of Dongfeng Motor, 2015
Output and Sales Volume of Dongfeng Motor, 2013-2014
Output and Sales Volume of Dongfeng Motor, 2014-2015
R&D Costs and % of Total Revenue of Dongfeng Motor, 2012-2015
Ongoing Projects of Dongfeng Motor as of 2015H1
Revenue and Net Income of Dongfeng Motor, 2014-2018E
Revenue and Net Income of Jinbei Automotive, 2011-2015
Revenue of Jinbei Automotive by Product, 2012-2015
Revenue of Jinbei Automotive by Region, 2012-2015
Revenue Structure of Jinbei Automotive by Region, 2012-2015
Output and Sales Volume of Jinbei Automotive, 2014-2015
Ongoing Projects of Jinbei Automotive as of 2015H1
Revenue and Net Income of Jinbei Automotive, 2014-2018E
Revenue and Net Income of JAC, 2011-2015
Revenue of JAC by Product, 2011-2015
Revenue Structure of JAC by Product, 2011-2015
Revenue of JAC by Region, 2011-2015
Revenue Structure of JAC by Region, 2011-2015
Output and Sales Volume of JAC, 2014-2015
R&D Costs and % of Total Revenue of JAC, 2012-2015
Ongoing Projects of JAC as of 2015H1
Investment Projects Funded by A-share Non-public Offering Plan of JAC, 2015
Revenue and Net Income of JAC, 2014-2018E
Revenue and Net Income of Changan Automobile, 2011-2015
Revenue of Changan Automobile by Business, 2012-2015
Capacity of Changan Automobile, 2015
Output and Sales Volume of Changan Automobile, 2014-2015
R&D Costs and % of Total Revenue of Changan Automobile, 2011-2015
Revenue and Net Income of Changan Automobile, 2014-2018E
Revenue and Net Income of JMC, 2011-2015
JMC’s Revenue from Top 5 Customers and % of Total Revenue, 2013-2014
Revenue of JMC by Product, 2012-2015
Revenue of JMC by Region, 2012-2015
Revenue Structure of JMC by Region, 2012-2015
Capacity of JMC, 2015
Output and Sales Volume of JMC, 2014-2015
R&D Costs and % of Total Revenue of JMC, 2012-2015
Non-Raised Capital's Projects of JMC, 2015
Revenue and Net Income of JMC, 2014-2018E
Revenue and Net Income of King Long Motor, 2011-2015
Revenue of King Long Motor by Region, 2011-2015
Revenue Structure of King Long Motor by Region, 2011-2015
Output and Sales Volume of King Long Motor, 2014-2015
R&D Costs and % of Total Revenue of King Long Motor, 2012-2015
Investment Projects Funded by A-share Non-public Offering Plan of King Long Motor, 2014
Revenue and Net Income of King Long Motor, 2014-2018E
Revenue and Net Income of SINOTRUK, 2011-2015
Revenue of SINOTRUK by Product, 2011-2015
Revenue Structure of SINOTRUK by Product, 2011-2015
R&D Costs and % of Total Revenue of SINOTRUK, 2012-2015
Revenue and Net Income of SINOTRUK, 2014-2018E
Revenue and Net Income of Liaoning SG, 2011-2015
Revenue of Liaoning SG by Product, 2012-2015
Revenue Structure of Liaoning SG by Product, 2012-2015
Revenue of Liaoning SG by Region, 2012-2015
Revenue Structure of Liaoning SG by Region, 2012-2015
Output and Sales Volume of Liaoning SG, 2014-2015
Subscription of Non-public Offering Plan of Liaoning SG, 2015
Investment Projects Funded by Non-public Offering Plan of Liaoning SG, 2015
Revenue and Net Income of Liaoning SG, 2014-2018E
Revenue and Net Income of Yutong Bus, 2011-2015
Revenue of Yutong Bus by Business, 2012-2015
Revenue Structure of Yutong Bus by Business, 2012-2015
Revenue of Yutong Bus by Region, 2012-2015
Revenue Structure of Yutong Bus by Region, 2012-2015
Output and Sales Volume of Yutong Bus, 2014-2015
R&D Costs and % of Total Revenue of Yutong Bus, 2012-2015
Non-Raised Capital's Projects of Yutong Bus, 2015
Non-public Offering of Yutong Bus, 2014
Revenue and Net Income of Yutong Bus, 2014-2018E
如果这份报告不能满足您的要求,我们还可以为您定制报告,请 留言说明您的详细需求。
|