|
|
|
报告导航:研究报告—
制造业—能源矿产
|
|
2015-2018年全球及中国风电运维行业研究报告 |
 |
字数:2.4万 |
页数:107 |
图表数:120 |
|
中文电子版:8000元 |
中文纸版:4000元 |
中文(电子+纸)版:8500元 |
|
英文电子版:2200美元 |
英文纸版:2400美元 |
英文(电子+纸)版:2500美元 |
|
编号:CYH042
|
发布日期:2015-12 |
附件:无 |
 |
|
|
2014年,全球风电运维市场规模92.5亿美元,同比增长25.8%,至2018年有望达137.8亿美元。陆上风电是当前主要风电运维市场,2014年占比90.2%,其余为海上风电运维市场。随着海上风电建设的加速推进, 2015-2018年全球海上风电运维市场规模有望保持20%以上的增长速度。
中国是全球风电运维市场规模最大的国家,2014年其值为21.8亿美元,占比23.6%。由于2009年建设的大批风电机组质保期临近,中国风电运维市场规模将会激增,至2018年有望达35.12亿美元。
当前,风电场开发商、风机制造商和第三方运维公司是中国风电运维市场的三大参与主体。其中,风电场开发商市场份额最大,2015年占比为74.6%;其次为风机制造商,占比14.8%;而受风机技术壁垒等限制,第三方运维公司规模相对尚小。
协合新能源:中国主要风电场开发商。其风电运维业务由旗下北京协合运维风电技术有限公司经营,设有五个检修基地; 2015上半年,公司完成风电运维项目39个,同时拥有11项定检服务合同和10个预防性服务合同。
金风科技:中国最大的风机制造商。风电运维业务由子公司天源科创运营,截至2015年8月底,已为1.7万台机组,500多个风电场提供运维等服务和技术支持。
东润环能:中国重点风电运维第三方。下设有智慧能源运维服务中心,可实现风场数据实时监控。2015上半年,公司运维业务收入达3735.8万元,同比增长3%。
水清木华研究中心《2015-2018年全球及中国风电运维行业研究报告》着重研究了以下内容:
 全球风电装机容量与分布、中国风电装机、地区结构、海上风电发展及企业格局等; 全球风电装机容量与分布、中国风电装机、地区结构、海上风电发展及企业格局等;
全球风电运维市场规模、地区分布及欧洲风电运维市场发展情况等;
中国风电运维市场规模、成本分析及竞争格局等;
全球5家风电运维企业经营情况及在华发展;
中国11家风电运维企业经营情况及发展战略等。
In 2014, the global wind farm O & M market size hit USD9.25 billion, representing a year-on-year growth rate of 25.8%; by 2018, the market size is expected to reach USD13.78 billion. The mainstream onshore wind farm O & M market seized the share of 90.2% in 2014, much higher than the rest offshore wind farm O & M market. With the accelerating construction of offshore wind power, the global offshore wind farm O & M market is expected to grow at above 20% in 2015-2018.
China ranks first worldwide in terms of wind farm O&M market size. In 2014, the country achieved USD2.18 billion, accounting for 23.6%. Since the warranty period of a large number of wind turbines made in 2009 is approaching, China’s wind farm O & M market size will surge to USD3.512 billion by 2018.
At present, players in the Chinese wind farm O&M market can be divided into three main types: wind turbine manufacturers, wind farm developers and third-party O&M companies. In 2015, wind farm developers enjoy the lion’s share --74.6%, followed by wind turbine manufacturers with 14.8%. Third-party O&M companies have a relatively small scale owing to technical barriers.
Concord New Energy is a major wind farm developer in China. Its wind farm O & M business is operated by its subsidiary Beijing Concord O & M Wind Power Technology Co., Ltd. with five maintenance bases. In the first half of 2015, the company completed 39 wind farm O & M projects, signed 11 scheduled inspection service contracts and 10 preventive service contracts.
Goldwind as China's largest wind turbine manufacturer assigns its subsidiary China Tianyuan New Energy Technology to conduct wind farm O & M business. As of the end of August 2015, it had provided O & M services and technical support for 17,000 wind turbines and more than 500 wind farms.
East Environment Energy, a key third-party O&M company, has set up an intelligent energy O & M service center to monitor wind farms in real time. In the first half of 2015, the company’s wind farm O & M revenue amounted to RMB37.358 million, up 3% year on year.
Global and China Wind Farm O&M Industry Report, 2015-2018 by ResearchInChina focuses on the followings:
 Global wind power installed capacity and distribution; China's wind power installed capacity, regional structure, offshore wind power development and corporate structure; Global wind power installed capacity and distribution; China's wind power installed capacity, regional structure, offshore wind power development and corporate structure;
Global wind farm O & M market size and geographical distribution; development of European wind farm O & M market;
Chinese wind farm O & M market size, cost analysis and competitive landscape;
Operation and development in China of 5 major global wind farm O & M companies;
Operation and development strategies of 11 major Chinese wind farm O & M companies.
第一章 风电运维简介
1.1 定义
1.2 分类
第二章 全球及中国风电市场分析
2.1 全球风电市场
2.1.1 风电装机及分布
2.1.2 德国
2.1.3 西班牙
2.1.4 美国
2.2 中国风电市场
2.2.1 概况
2.2.2 风电装机与并网
2.2.3 海上风电
2.2.4 上网电价
2.2.5 风电整机制造商企业格局
2.2.6 风电开发商企业格局
第三章 全球风电运维市场分析
3.1 市场规模
3.2 地区结构
3.3 成本分析
3.4 欧洲市场
3.4.1 市场规模
3.4.2 竞争格局
第四章 中国风电运维市场分析
4.1 发展概况
4.2 市场规模
4.3 成本分析
4.4 竞争格局
第五章 全球主要风电运维企业
5.1 Vestas
5.1.1 企业简介
5.1.2 经营情况
5.1.3 营收构成
5.1.4 在华业务
5.1.5 风电运维业务
5.2 Gamesa
5.2.1 企业简介
5.2.2 经营情况
5.2.3 营收构成
5.2.4 在华业务
5.2.5 风电运维业务
5.3 Suzlon
5.3.1 企业简介
5.3.2 经营情况
5.3.3 营收构成
5.3.4 在华业务
5.3.5 风电运维业务
5.4 GE
5.4.1 企业简介
5.4.2 经营情况
5.4.3 营收构成
5.4.4 在华业务
5.4.5 风电运维业务
5.5 Siemens
5.5.1 企业简介
5.5.2 经营情况
5.5.3 营收构成
5.5.4 在华业务
5.5.5 风电运维业务
第六章 中国风电运维企业
6.1 龙源电力
6.1.1 企业简介
6.1.2 经营情况
6.1.3 营收构成
6.1.4 毛利率
6.1.5 风电运维业务
6.1.6 发展前景
6.2 金风科技
6.2.1 企业简介
6.2.2 经营情况
6.2.3 营收构成
6.2.4 毛利率
6.2.5 客户与供应商
6.2.6 风电运维业务
6.2.7 发展前景
6.3 明阳风电
6.3.1 企业简介
6.3.2 经营情况
6.3.3 营收构成
6.3.4 客户与供应商
6.3.5 风电运维业务
6.3.6 发展前景
6.4 协合新能源
6.4.1 企业简介
6.4.2 经营情况
6.4.3 营收构成
6.4.4 客户与供应商
6.4.5 风电运维业务
6.4.6 发展前景
6.5 联合动力
6.5.1 企业简介
6.5.2 经营情况
6.5.3 风电运维业务
6.6 优利康达
6.6.1 企业简介
6.6.2 风电运维业务
6.7 新疆金达坂洁净能源技术有限公司
6.7.1 企业简介
6.7.2 风电运维业务
6.8 吉地安
6.8.1 企业简介
6.8.2 风电运维业务
6.9 锋电能源
6.9.1 企业简介
6.9.2 风电运维业务
6.10 东润环能
6.10.1 企业简介
6.10.2 经营情况
6.10.3 营收构成
6.10.4 风电运维业务
6.11 EUM风电技术服务(北京)有限公司
第七章 结论与预测
7.1 结论
7.2 预测
1. Overview of Wind Farm O&M
1.1 Definition
1.2 Classification
2. Global and Chinese Wind Power Market
2.1 Global Wind Power Market
2.1.1 Wind Power Installed Capacity and Distribution
2.1.2 Germany
2.1.3 Spain
2.1.4 USA
2.2 Chinese Wind Power Market
2.2.1 Overview
2.2.2 Installed Capacity and Grid Connection
2.2.3 Offshore Wind Power
2.2.4 Feed-In Tariff
2.2.5 Pattern of Wind Turbine Manufacturers
2.2.6 Pattern of Wind Farm Developers
3. Global Wind Farm O&M Market
3.1 Market Size
3.2 Regional Structure
3.3 Cost Analysis
3.4 European Market
3.4.1 Market Size
3.4.2 Competitive Landscape
4. Chinese Wind Farm O&M Market
4.1 Development
4.2 Market Size
4.3 Cost Analysis
4.4 Competitive Landscape
5. Major Global Wind Farm O&M Companies
5.1 Vestas
5.1.1 Profile
5.1.2 Operation
5.1.3 Revenue Structure
5.1.4 Business in China
5.1.5 Wind Farm O&M Business
5.2 Gamesa
5.2.1 Profile
5.2.2 Operation
5.2.3 Revenue Structure
5.2.4 Business in China
5.2.5 Wind Farm O&M Business
5.3 Suzlon
5.3.1 Profile
5.3.2 Operation
5.3.3 Revenue Structure
5.3.4 Business in China
5.3.5 Wind Farm O&M Business
5.4 GE
5.4.1 Profile
5.4.2 Operation
5.4.3 Revenue Structure
5.4.4 Business in China
5.4.5 Wind Farm O&M Business
5.5 Siemens
5.5.1 Profile
5.5.2 Operation
5.5.3 Revenue Structure
5.5.4 Business in China
5.5.5 Wind Farm O&M Business
6. Chinese Wind Farm O&M Companies
6.1 Longyuan Power
6.1.1 Profile
6.1.2 Operation
6.1.3 Revenue Structure
6.1.4 Gross Margin
6.1.5 Wind Farm O&M Business
6.1.6 Development Prospect
6.2 Goldwind
6.2.1 Profile
6.2.2 Operation
6.2.3 Revenue Structure
6.2.4 Gross Margin
6.2.5 Customers and Suppliers
6.2.6 Wind Farm O&M Business
6.2.7 Development Prospect
6.3 Ming Yang Wind Power
6.3.1 Profile
6.3.2 Operation
6.3.3 Revenue Structure
6.3.4 Customers and Suppliers
6.3.5 Wind Farm O&M Business
6.3.6 Development Prospect
6.4 Concord New Energy
6.4.1 Profile
6.4.2 Operation
6.4.3 Revenue Structure
6.4.4 Customers and Suppliers
6.4.5 Wind Farm O&M Business
6.4.6 Development Prospect
6.5 United Power
6.5.1 Profile
6.5.2 Operation
6.6.3 Wind Farm O&M Business
6.6 EULIKIND
6.6.1 Profile
6.6.2 Wind Farm O&M Business
6.7 Xinjiang Jindaban Clean Energy
6.7.1 Profile
6.7.2 Wind Farm O&M Business
6.8 Gideon
6.8.1 Profile
6.8.2 Wind Farm O&M Business
6.9 Sharpower
6.9.1 Profile
6.9.2 Wind Farm O&M Business
6.10 East Environment Energy
6.10.1 Profile
6.10.2 Operation
6.10.3 Revenue Structure
6.10.4 Wind Farm O&M Business
6.11 EUM Wind Power Technologies Service (Beijing)
7. Summary and Forecast
7.1 Summary
7.2 Forecast
图:风电服务行业主要业务板块
图:2013&2018年全球风电运维市场服务类型占比
图:2008-2018年全球风电新增装机容量
图:2008-2018年全球风电累计装机容量
表:2014年全球风电装机容量(分地区)
图:2011-2014年全球海上风电装机容量
图:1992-2014年德国新增及累计风电装机容量
表:2014年德国(分地区)风电装机容量
表:2015年德国在运行、在建及规划风电场
图:2005-2014年西班牙累计风电装机容量
图:2004-2014年美国累计风电装机容量
图:2014年美国(分地区)风电累计装机容量
图:2015年美国海上风电分布
图:1980-2015年中国风力发电机发展历程
图:2007-2015年中国风电装机容量
图:2009-2015年中国风电并网装机容量
图:2007-2015年中国海上风电新增装机容量及累计装机容量
表:中国首批海上风电特许权项目
表:截至2014年底中国风电制造商海上风电装机情况
表:2015年中国风力发电标杆上网电价
表:2014年中国风电整机制造商新增装机容量及市场份额
表:2014年中国风电整机制造商累计装机容量及市场份额
图:2014年中国风电开发商累计风电装机容量市场份额
图:2008-2018年全球风电运维市场规模
图:2008-2015年全球风电运维服务收益及风机销售收益
图:2014&2018年全球风电运维(分地区)市场规模构成
图:风电运维成本增长趋势
图:2014年风电服务成本构成
图:2005-2020年欧洲风电运维市场规模
图:2005-2020年欧洲(分国家)风电运维市场规模
图:2012-2020年欧洲(分国家)新增可运维风电装机容量
图:2011和2020年欧洲风电运维(分电厂类型)市场份额
图:2014年欧洲风电运维市场(分国家和服务商类型)市场份额
图:2011-2020年中国出质保期外风机数量
图:2008-2015年中国风电运维市场规模
表:50MW风电场年度运营成本
图:中国陆地风力发电运营成本结构
图:中国海上风力发电运营成本结构
图:2015年中国风电运维(分企业类型)市场份额
图:中国风电运维市场三类竞争者SOWT分析
表:2015年中国主要风电企业风电运维业务发展
图:2009-2015年Vestas营业收入与净利润
图:2012-2015年Vestas (分业务)营业收入构成
图:2014-2015年Vestas(分地区)风机出货量
图:2008-2015年维斯塔斯在华风机出货量
表:2015年Vestas在华子公司
图:2009-2015年维斯塔斯风电运维服务订单储备量
图:2010-2014年维斯塔斯风电运维营业收入
图:2013-2015年Vestas风电运维订单
图:2014年Vestas(分地区)服务的风机容量
图:2009-2015年Gamesa营业收入与净利润
图:2014-2015年Gamesa公司订单量
图:2013-2015年Gamesa(分产品)营业收入构成
表:2013-2014年Gamesa(分地区)营业收入及构成
图:2012-2015年Gamesa(分地区)风机销量构成
图:2014年Gamesa在中国经营情况
图:2008-2014年Gamesa在中国营业收入
图:2012-2015年Gamesa在中国风机销量占比
图:2010-2015年Gamesa公司风电运维业务营业收入
图:2010-2016财年Suzlon营业收入与净利润
图:2016上半财年Suzlon公司经营情况
图:2014-2015财年Suzlon(分地区)营业收入构成
图:2014-2015财年Suzlon在中国营业收入
图:2009-2013财年Suzlon公司OMS业务营业收入
图:2009-2015年GE营业收入与净利润
图:2010-2015年GE(分业务)主营业务收入构成
图:2011-2014年GE(分地区)主营业收入构成
图:通用电气灵活风电服务解决方案
图:2010-2015财年Siemens营业收入与净利润
图:2015年西门子在中国经营情况
图:2009-2015财年Siemens在中国营业收入
图:西门子中国战略
图:2011-2015财年Siemens风电部门营业收入
图:2011-2015财年Siemens风电部门在手订单额
图:西门子风电运维系统
图:2009-2015年龙源电力营业收入与与净利润
图:2013-2015年龙源电力(分业务)营业收入构成
图:2012-2015年龙源电力(分业务)毛利率
图:龙源电力六大风电基地
图:2013-2018年龙源电力营业收入与净利润
图:2009-2015年金风科技营业收入与净利润
图:2011-2015年金风科技风机(分类型)销量
图:2014-2015年金风科技(分产品)主营业务收入构成
图:2015上半年金风科技(分地区)主营业务收入构成
图:2011-2015年金风科技(分产品)毛利率
图:2008-2014年金风科技前五名供应商合计采购金额及占比
图:2008-2014年金风科技前五名客户合计营业收入及占比
图:2010-2015年金风科技风电服务营业收入
图:2010-2015年天源科创营业收入及净利润
图:2013-2018年金风科技营业收入与净利润
表:2014年底明阳风电主要生产基地及产能
图:2009-2015年明阳风电营业收入与净利润
图:2008-2014明阳风电风机出货量
图:2014-2015年明阳风电风机新签订单和未交货订单
图:2012-2014年明阳风电(分业务)营收占比
图:2012-2013年明阳风电(分地区)营收构成
图:2009-2014年明阳风电前五名供应商合计采购金额占比
图:2008-2014年明阳风电前五名客户合计营业收入占比
图:明阳风电风电运维业务系统
图:2009-2014年明阳风电风电运维营业收入
图:2013-2018年明阳风电营业收入及净利润
图:2009-2015年协合新能源营业收入与净利润
图:2013-2015年协合新能源(分业务)营业收入构成
图:2013-2015年协合新能源(分地区)营业收入构成
图:2010-2014年协合新能源前五名供应商合计采购金额占比
图:2010-2014年协合新能源前五名客户合计营业收入占比
图:2013-2015年协合新能源风电运维营业收入
图:2013-2018年协合新能源营业收入与净利润
图:2012-2014年联合动力营业收入及净利润
图:2011-2014年联合动力风机销量
图:联合动力风电场工程总包(EPC)建设流程
表:2006-2015年优利康达风电运维业务发展情况
表:2005-2010年金达坂风电运维业务发展情况
表:2006-2015年吉地安主要风电运维项目
图:2012-2015年东润环能营业收入与净利润
图:2012-2015年东润环能(分业务)主营业务收入构成
图:东润环能风电运维系统
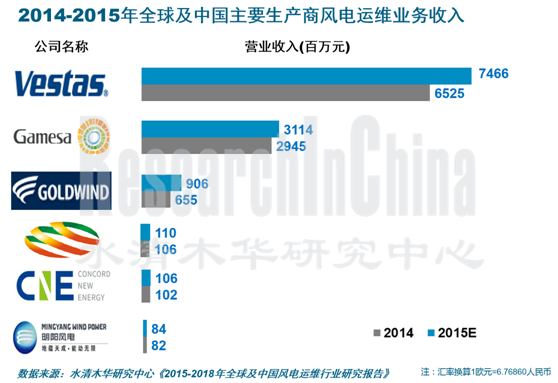
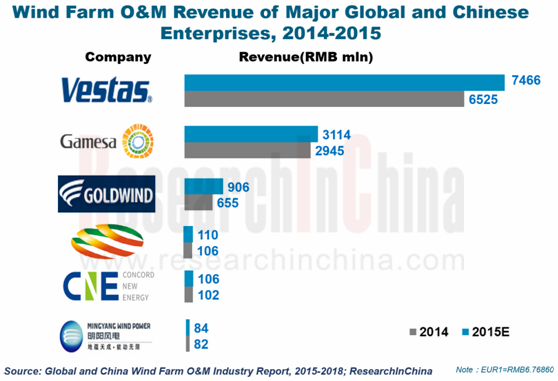
图:2014-2015年全球及中国主要生产商风电运维业务收入
图:2014-2018年全球风电运维市场规模
图:2014-2018年中国风电运维市场规模
Major Business Sectors in Wind Power Service Industry
Structure of Global Wind Farm O&M Market by Type of Service, 2013 vs 2018E
Global Newly-installed Wind Power Capacity, 2008-2018E
Global Cumulative Installed Wind Power Capacity, 2008-2018E
Global Wind Power Installed Capacity (by Region), 2014
Global Offshore Wind Power Installed Capacity, 2011-2014
Newly-installed and Cumulative Wind Power Capacity in Germany, 1992-2014
Installed Wind Power Capacity in Germany (by Region), 2014
Wind Farms in Operation, Under Construction and Planned in Germany, 2015
Cumulative Installed Wind Power Capacity in Spain, 2005-2014
Cumulative Installed Wind Power Capacity in USA, 2004-2014
Cumulative Installed Wind Power Capacity in USA (by Region), 2014
Offshore Wind Power Distribution in USA, 2015
Development Course of Chinese Wind Turbine Generators, 1980-2015
Installed Wind Power Capacity in China, 2007-2015
Grid-connected Installed Wind Power Capacity in China, 2009-2015
Newly-installed and Cumulative Offshore Wind Capacity in China, 2007-2015
China’s First Franchise Offshore Wind Projects
Offshore Wind Power Installed Capacity of Chinese Wind Power Manufacturers, by the end of 2014
Benchmark Feed-In Tariff for Wind Power in China, 2015
Newly-installed Capacity and Market Share of Chinese Wind Turbine Manufacturers, 2014
Cumulative Installed Capacity and Market Share of Chinese Wind Turbine Manufacturers, 2014
Cumulative Wind Power Installed Capacity and Market Share of Chinese Wind Farm Developers, 2014
Global Wind Farm O&M Market Size, 2008-2018E
Global Wind Farm O&M Service Revenue and Wind Turbine Revenue, 2008-2015
Global Wind Farm O&M Market Size Structure (by Region), 2014 vs 2018E
Cost Growth Trend of Wind Farm O&M
Cost Structure of Wind Power Service, 2014
European Wind Farm O&M Market Size, 2005-2020E
European Wind Farm O&M Market Size (by Country), 2005-2020E
Newly-added Installed Wind Power Capacity Coming into O&M in Europe (by Country), 2012-2020E
Share of European Wind Farm O&M Market (by Type of Farm), 2011&2020E
Share of European Wind Farm O&M Market (by Country and Type of Service Provider), 2014
Number of Wind Turbines Out of Warranty, 2011-2020E
Chinese Wind Farm O&M Market Size, 2008-2015
Annual Operating Costs of A 50MW Wind Farm
Operating Costs Structure of Onshore Wind Power in China
Operating Costs Structure of Offshore Wind Power in China
Wind Farm O&M Market Share (by Type of Companies) in China, 2015
SWOT Analysis of Three Types of Competitors in Chinese Wind Farm O&M Market
Wind Farm O&M Business of Major Wind Power Companies in China, 2015
Revenue and Net Income of Vestas, 2009-2015
Revenue Structure of Vestas (by Business), 2012-2015
Wind Turbine Shipment of Vestas (by Region), 2014-2015
Wind Turbine Shipment of Vestas in China, 2008-2015
Subsidiaries of Vestas in China, 2015
Vestas’ Wind Farm O&M Order Backlog, 2009-2015
Vestas’ Revenue from Wind Farm O&M Business, 2010-2014
Vestas’ Wind Farm O&M Order, 2013-2015
Wind Turbine Capacity Served by Vestas (by Region), 2014
Revenue and Net Income of Gamesa, 2009-2015
Orders of Gamesa, 2014-2015
Revenue Structure of Gamesa (by Product), 2013-2015
Revenue and Structure of Gamesa (by Region), 2013-2014
Wind Turbine Sales Volume Structure of Gamesa (by Region), 2012-2015
Operation of Gamesa in China, 2014
Gamesa’s Revenue in China, 2008-2014
Share of Gamesa by Wind Turbine Sales Volume in China, 2012-2015
Gamesa’s Revenue from Wind Farm O&M Business, 2010-2015
Revenue and Net Income of Suzlon, FY2010-FY2016
Operation of Suzlon, H1 FY2016
Revenue Structure of Suzlon (by Region), FY2014-FY2015
Revenue of Suzlon in China, FY2014-FY2015
OMS Revenue of Suzlon, FY2009- FY2013
Revenue and Net Income of GE, 2009-2015
Operating Revenue Structure of GE (by Business), 2010-2015
Operating Revenue Structure of GE (by Region), 2011-2014
GE’s Flexible Wind Power Service Solutions
Revenue and Net Income of Siemens, FY2010-FY2015
Operation of Siemens in China, 2015
Siemens’ Revenue in China, FY2009-FY2015
Strategy of Siemens in China
Siemens’ Revenue from Wind Power Division, FY2011-FY2015
Order Backlog of Siemens’ Wind Power Division, FY2011-FY2015
Wind Farm O&M System of Siemens
Revenue and Net Income of Longyuan Power, 2009-2015
Revenue Structure of Longyuan Power (by Business), 2013-2015
Gross Margin of Longyuan Power (by Business), 2012-2015
Six Wind Power Bases of Longyuan Power
Revenue and Net Income of Longyuan Power, 2013-2018E
Revenue and Net Income of Goldwind, 2009-2015
Wind Turbine Sales Volume of Goldwind (by Type), 2011-2015
Operating Revenue Structure of Goldwind (by Product), 2014-2015
Operating Revenue Structure of Goldwind (by Region), 2015H1
Gross Margin of Goldwind (by Product), 2011-2015
Goldwind’s Procurement from Top 5 Suppliers and % of Total Procurement, 2008-2014
Goldwind’s Revenue from Top 5 Customers and % of Total Revenue, 2008-2014
Goldwind’s Revenue from Wind Power Service Business, 2010-2015
Revenue and Net Income of China Tianyuan New Energy Technology, 2010-2015
Revenue and Net Income of Goldwind, 2013-2018E
Main Production Bases and Capacity of Ming Yang Wind Power, end of 2014
Revenue and Net Income of Ming Yang Wind Power, 2009-2015
Wind Turbine Shipment of Ming Yang Wind Power, 2008-2014
New Orders and Backlog of Ming Yang Wind Power, 2014-2015
Revenue Structure of Ming Yang Wind Power (by Business), 2012-2014
Revenue Structure of Ming Yang Wind Power (by Region), 2012-2013
Ming Yang Wind Power’s Procurement from Top 5 Suppliers and % of Total Procurement, 2009-2014
Ming Yang Wind Power’s Revenue from Top 5 Customers and % of Total Revenue, 2008-2014
Ming Yang Wind Power’s Wind Farm O&M Business System
Ming Yang Wind Power’s Revenue from Wind Farm O&M Business, 2009-2014
Revenue and Net Income of Ming Yang Wind Power, 2013-2018E
Revenue and Net Income of Concord New Energy, 2009-2015
Revenue Structure of Concord New Energy (by Business), 2013-2015
Revenue Structure of Concord New Energy (by Region), 2013-2015
Concord New Energy’s Procurement from Top 5 Suppliers and % of Total Procurement, 2010-2014
Concord New Energy’s Revenue from Top 5 Customers and % of Total Revenue, 2010-2014
Wind Farm O&M Revenue of Concord New Energy, 2013-2015
Revenue and Net Income of Concord New Energy, 2013-2018E
Revenue and Net Income of United Power, 2012-2014
Wind Turbine Sales Volume of United Power, 2011-2014
Construction Procedures for Wind Farm EPC of United Power
Development of EULIKIND’s Wind Farm O&M Business, 2006-2015
Development of Xinjiang Jindaban Clean Energy’s Wind Farm O&M Business, 2005-2010
Major Wind Farm O&M Projects of Gideon, 2006-2015
Revenue and Net Income of East Environment Energy, 2012-2015
Operating Revenue Structure of East Environment Energy (by Business), 2012-2015
Wind Farm O&M System of East Environment Energy
Wind Farm O&M Revenue of Major Global and Chinese Enterprises, 2014-2015
Global Wind Farm O&M Market Size, 2014-2018E
Chinese Wind Farm O&M Market Size, 2014-2018E
如果这份报告不能满足您的要求,我们还可以为您定制报告,请 留言说明您的详细需求。
|