|
|
|
报告导航:研究报告—
制造业—化工
|
|
2015-2018年中国聚醚单体产业链研究报告 |
 |
字数:3.3万 |
页数:101 |
图表数:122 |
|
中文电子版:8500元 |
中文纸版:4250元 |
中文(电子+纸)版:9000元 |
|
英文电子版:2250美元 |
英文纸版:2400美元 |
英文(电子+纸)版:2550美元 |
|
编号:HK065
|
发布日期:2015-12 |
附件:下载 |
 |
|
|
目前,中国市场聚醚单体主要包括聚乙二醇单甲醚(MPEG)、烯丙基聚氧乙烯醚(APEG)、甲基烯基聚氧乙烯醚(TPEG)和异丁烯醇聚氧乙烯醚(HPEG),下游最大的应用领域为聚羧酸减水剂,也有少部分应用于日用化学及医药化工中的添加剂等。
在中国聚羧酸减水剂发展初期,使用的聚醚单体以MPEG和APEG为主。从2009年开始,随着TPEG和HPEG的起始剂原料逐步国产化,价格大幅降低,TPEG和HPEG逐渐成为聚羧酸减水剂市场上的主流产品。2014年,中国市场上TPEG和HPEG在减水剂市场的应用量占比达95%左右。
近年来,中国聚羧酸减水剂市场发展迅速,其需求增长主要来源于下游需求的提升和对第二代减水剂的替代。2014年,中国聚羧酸减水剂需求量占减水剂总需求量的67.1%,已成为减水剂市场的主流产品。
2007-2014年,中国聚羧酸减水剂销量的年均复合增长率达到41.9%,2014年达480.1万吨,对聚醚单体的需求量在75万吨左右。未来几年,在中国经济和基建工程发展的带动下,聚羧酸减水剂的需求有望保持15%左右的增长速度,进而带动聚醚单体需求量的持续增长。
由于聚醚单体的主要原料环氧乙烷不能远距离运输,所以中国聚醚单体的生产主要集中在环氧乙烷主产区,即中国的华东、东北以及华北地区,其中华东地区生产企业最多。
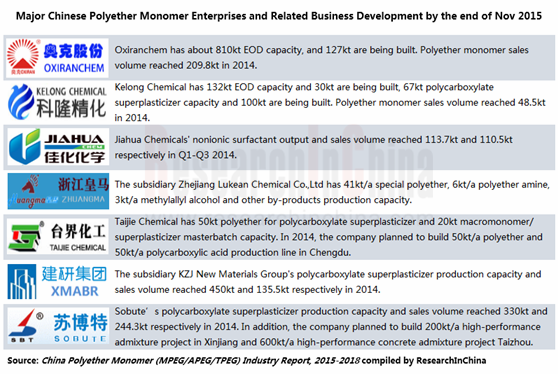
目前,中国规模较大的聚醚单体生产商主要有奥克股份、科隆精化、浙江皇马、上海台界、佳化化学等,2014年这5家企业聚醚单体市场占有率(在聚羧酸减水剂市场)达60%以上。其中奥克股份是全球最大的高性能混凝土减水剂聚醚生产商,2014年其聚醚单体销售达21万吨,并且公司还有12.7万吨环氧乙烷衍生物产能正在建设中。
在聚羧酸减水剂市场,目前中国生产企业超过1000 家,但大多数为小型的复配企业,而掌握系统、成熟的聚羧酸减水剂浓缩液及泵送剂合成技术的企业不足20家。2014年,中国聚羧酸减水剂前9名企业的市场占有率达17.1%,其中江苏苏博特和建研集团销量较大,分别为20.43万吨和13.55万吨。

水清木华研究中心《2015-2018年中国聚醚单体产业研究报告》主要包括以下几个内容:
 中国聚醚单体行业发展现状、市场供需、竞争格局及发展预测等; 中国聚醚单体行业发展现状、市场供需、竞争格局及发展预测等;
环氧乙烷、甲醇、丙烯酸等聚醚单体上游原材料的供需分析、竞争格局、价格分析等;
聚羧酸减水剂、表面活性剂等聚醚单体下游行业的供需分析、进出口分析、竞争格局、价格分析等;
国外3家、中国6家主要聚醚单体生产企业的经营情况、聚醚单体业务及发展前景等;
中国4家聚羧酸减水剂企业经营情况、减水剂业务分析及发展前景等。
Polyether monomer in the Chinese market mainly refers to methoxy polyethylene glycol (MPEG), allyloxy polyethylene glycol (APEG), tresylated polyethylene glycol (TPEG) and isobutylene alcohol polyoxyethylene ether (HPEG). The field in which polyether monomer finds most application comes to polycarboxylate superplasticizer, whilst a small amount of polyether monomer gets used in daily chemical and pharmaceutical chemical additives and the like. .
In the early development of Chinese polycarboxylate superplasticizer, polyether monomer was represented by MPEG and APEG. From 2009 onwards, the gradual localization of initiator materials reduces the prices of TPEG and HPEG significantly, so that TPEG and HPEG have become mainstream products on the polycarboxylate superplasticizer market. In 2014, TPEG and HPEG seized 95% share of the Chinese superplasticizer market in terms of application.
In the fast-growing Chinese polycarboxylate superplasticizer market, the growth in demand is mainly attributed to the jumping downstream demand and the substitution for the second-generation superplasticizer in recent years. In 2014, polycarboxylate superplasticizer has become a mainstream product in Chinese superplasticizer market, because it accounts for 67.1% of the total superplasticizer demand.
In 2007-2014, China’s polycarboxylate superplasticizer sales volume presented a CAGR of 41.9%, hitting 4.801 million tons in 2014; the demand for polyether monomer approximated 750,000 tons. Driven by the development of China’s economy and infrastructure construction, the demand for polycarboxylate superplasticizer is expected to maintain the growth rate of about 15% in the next few years, which will further propel the demand for polyether monomer.
As epoxy ethane, the main raw material of polyether monomer, cannot be transported over long distances, China’s polyether monomer production is concentrated in main epoxy ethane producing areas, namely East China, Northeast China and North China (particularly East China where most manufacturing enterprises are located).
Large Chinese polyether monomer manufacturers -- Liaoning Oxiranchem, Liaoning Kelong Fine Chemical, Zhejiang Huangma, Shanghai Taijie and Jiahua Chemical enjoyed a combined market share of over 60% (in the polycarboxylate superplasticizer market) in 2014. As the world's largest producer of high-performance concrete superplasticizer polyether, Liaoning Oxiranchem sold 210,000 tons of polyether monomer in 2014 and it is building the epoxy ethane derivative capacity of 127,000 tons.
In the polycarboxylate superplasticizer market, there are more than 1,000 manufacturers in China, but most of them are small enterprises focusing on compounding, whereas merely less than 20 ones of them master systematic and mature polycarboxylate superplasticizer concentrate and pumping agent synthesis technologies. In 2014, the top 9 Chinese polycarboxylate superplasticizer companies obtained the market share of 17.1%, especially Jiangsu Sobute and Xiamen Academy of Building Research Group witnessed the highest sales volume of 204,300 tons and 135,500 tons respectively.
China Polyether Monomer Industry Report, 2015-2018 by ResearchInChina contains the followings:
 Status quo, market supply & demand, competition pattern, prospects, etc. of Chinese polyether monomer industry; Status quo, market supply & demand, competition pattern, prospects, etc. of Chinese polyether monomer industry;
Supply & demand, competitive landscape and prices of upstream raw materials such as epoxy ethane, methanol, acrylic acid and the like;
Operation, polyether monomer business, prospects, etc. of 3 foreign polyether monomer companies and 6 Chinese counterparts;
Operation, superplasticizer business, prospects, etc. of 4 polycarboxylate superplasticizer companies in China.
第一章 聚醚单体概述
1.1分类及应用
1.2 产业链
第二章 中国聚醚单体发展概况
2.1 发展现状
2.2 竞争格局
2.3 市场价格
2.4 发展前景及预测
第三章 中国聚醚单体上游发展对其影响
3.1 环氧乙烷
3.1.1 市场供需
3.1.2 竞争格局
3.1.3 市场价格
3.2 甲醇
3.2.1 市场供需
3.2.2 市场价格
3.3 丙烯酸
3.3.1 市场需求
3.3.2 竞争格局
3.3.3 市场价格
3.4烯醇
第四章 中国聚醚单体下游发展对其影响
4.1 聚羧酸减水剂
4.1.1 市场供需
4.1.2 竞争格局
4.1.3 市场价格
4.2 表面活性剂
4.2.1 供给分析
4.2.2 需求分析
4.2.3 进出口
第五章 国外主要聚醚单体企业
5.1 陶氏化学(The Dow Chemical Company)
5.1.1 公司简介
5.1.2 经营情况
5.1.3 高性能材料及化学品部门经营情况
5.1.4 聚醚单体业务
5.1.5 在华发展
5.2科莱恩(Clariant International Ltd.)
5.2.1 公司简介
5.2.2 经营情况
5.2.3 聚醚单体业务
5.2.4 在华业务
5.3 韩国乐天化学(Lotte Chemical Corporation)
5.3.1 公司简介
5.3.2 经营情况
5.3.3 聚醚单体业务
5.3.4 在华业务
第六章 中国主要聚醚单体企业
6.1 奥克股份
6.1.1 公司简介
6.1.2 经营情况
6.1.3 营收构成
6.1.4 毛利率
6.1.5 研发
6.1.6 聚醚单体业务
6.1.7 预测与展望
6.2 科隆精化
6.2.1 公司简介
6.2.2 经营情况
6.2.3 营收构成
6.2.4 毛利率
6.2.5 研发
6.2.6 客户和供应商
6.2.7 聚醚单体和减水剂业务
6.2.8 预测与展望
6.3 浙江皇马
6.3.1 公司简介
6.3.2 聚醚单体业务
6.3.3 研发
6.4 上海台界
6.4.1 公司简介
6.4.2 聚醚单体业务
6.5 佳化化学
6.5.1 公司简介
6.5.2 经营状况
6.5.3 营收构成
6.5.4 毛利率
6.5.5 研发
6.5.6 主要客户
6.5.7 聚醚单体业务
6.6 南京威尔
6.6.1 公司简介
6.6.2 聚醚单体业务
第七章 中国主要聚羧酸系减水剂企业
7.1 江苏苏博特
7.1.1 公司简介
7.1.2 研发
7.1.3 减水剂业务
7.2 建研集团
7.2.1 公司简介
7.2.2 经营状况
7.2.3 营收构成
7.2.4 毛利率
7.2.5 研发
7.2.6 减水剂业务
7.2.7 预测与展望
7.3 华伟银凯
7.3.1 公司简介
7.3.2 经营状况
7.3.3 营收构成
7.3.4 减水剂业务
7.4 山西凯迪
7.4.1 公司简介
7.4.2 减水剂业务
1. Overview of Polyether Monomer
1.1 Classification and Application
1.2 Industry Chain
2. Development of Polyether Monomer in China
2.1 Status Quo
2.2 Competition Pattern
2.3 Market Price
2.4 Outlook and Forecast
3. Development and Influence of Polyether Monomer Upstream in China
3.1 EO
3.1.1 Market Supply and Demand
3.1.2 Competition Pattern
3.1.3 Market Price
3.2 Methanol
3.2.1 Market Supply and Demand
3.2.2 Market Price
3.3 Acrylic Acid (AA)
3.3.1 Market Supply and Demand
3.3.2 Competition Pattern
3.3.3 Market Price
3.4 Enol
4. Development and Influence of Polyether Monomer Downstream in China
4.1 Polycarboxylate Superplasticizer
4.1.1 Market Supply and Demand
4.1.2 Competition Pattern
4.1.3 Market Price
4.2 Surfactant
4.2.1 Supply
4.2.2 Demand
4.2.3 Import and Export
5. Major Foreign Polyether Monomer Enterprises
5.1 The DOW Chemical Company
5.1.1 Profile
5.1.2 Operation
5.1.3 Operation of High-Performance Materials and Chemicals Division
5.1.4 Polyether Monomer Business
5.1.5 Development in China
5.2 Clariant International Ltd.
5.2.1 Profile
5.2.2 Operation
5.2.3 Polyether Monomer Business
5.2.4 Business in China
5.3 Lotte Chemical Corporation
5.3.1 Profile
5.3.2 Operation
5.3.3 Polyether Monomer Business
5.3.4 Business in China
6. Major Chinese Polyether Monomer Enterprises
6.1 Liaoning Oxiranchem,Inc.
6.1.1 Profile
6.1.2 Operation
6.1.3 Revenue Structure
6.1.4 Gross Margin
6.1.5 R&D
6.1.6 Polyether Monomer Business
6.1.7 Outlook and Forecast
6.2 Liaoning Kelong Fine Chemical Co., Ltd.
6.2.1 Profile
6.2.2 Operation
6.2.3 Revenue Structure
6.2.4 Gross Margin
6.2.5 R&D
6.2.6 Clients and Suppliers
6.2.7 Polyether Monomer and Superplasticizer Business
6.2.8 Prospects
6.3 Zhejiang Huangma Technology Co., Ltd.
6.3.1 Profile
6.3.2 Polyether Monomer Business
6.3.3 R&D
6.4 Shanghai Taijie Chemical Co., Ltd.
6.4.1 Profile
6.4.2 Polyether Monomer Business
6.5 Jiahua Chemicals Inc.
6.5.1 Profile
6.5.2 Operation
6.5.3 Revenue Structure
6.5.4 Gross Margin
6.5.5 R&D
6.5.6 Major Clients
6.5.7 Polyether Monomer Business
6.6 Nanjing Well Chemical Corp., Ltd.
6.6.1 Profile
6.6.2 Polyether Monomer Business
7. Major Chinese Polycarboxylate Superplasticizer Enterprises
7.1 Jiangsu Sobute New Materials Co., Ltd.
7.1.1 Profile
7.1.2 R&D
7.1.3 Superplasticizer Business
7.2 Xiamen Academy of Building Research Group Co., Ltd.
7.2.1 Profile
7.2.2 Operation
7.2.3 Revenue Structure
7.2.4 Gross Margin
7.2.5 R&D
7.2.6 Superplasticizer Business
7.2.7 Prospects
7.3 Shandong HuaweiJiancai Building Materials Co., Ltd.
7.3.1 Profile
7.3.2 Operation
7.3.3 Revenue Structure
7.3.4 Superplasticizer Business
7.4 Shanxi Kaidi Building Materials Co., Ltd.
7.4.1 Profile
7.4.2 Superplasticizer Business
表:各类聚醚单体在减水剂领域的优劣比较
图:聚醚单体(MPEG/TPEG/APEG)产业链
图:2010-2014年中国三大聚醚单体在聚羧酸减水剂市场占比
图:2008-2015年中国减水剂用聚醚单体量
表:2014-2015年中国主要企业聚醚单体相关产能及扩张情况
图:2011-2015年中国聚醚单体价格走势
图:2014-2018年中国减水剂用聚醚单体量
表:截至2015年11月底中国环氧乙烷和商品环氧乙烷(分企业/分地区)产能
图:2006-2015年中国环氧乙烷表观消费量
图:2014年中国环氧乙烷(分产品)消费结构
图:截至2015年11月底中国环氧乙烷(分企业)产能占比
图:截至2015年11月底中国环氧乙烷(分地区)产能占比
表:截至2015年11月底中国环氧乙烷前10名企业产能及占比
图:2007-2015年中国环氧乙烷(工业一级)市场平均价格
图:2007-2015年中国甲醇产能
图:2007-2015年中国精甲醇产量
图:2014年中国精甲醇(分地区)产量占比
图:2008-2015年中国甲醇进出口量及对外依存度
图:2006-2015年中国甲醇(一级,净水)市场平均价格
表:2008-2015年中国丙烯酸及酯供需分析
表:截止2015年11月底中国丙烯酸及酯(分企业/分产品)产能
图:2011-2015年中国丙烯酸及酯(分产品)市场价格
图:2007-2015年中国聚羧酸减水剂销售量及增长率
表:2014年中国前9名聚羧酸减水剂生产企业销量和市场占有率
图:2014年中国前9名企业聚羧酸减水剂销售额及单价
图:2006-2015年中国AEO产量及增长率
图:2008-2015年中国AEO表面活性剂表观消费量及自给率
图:2008-2015年中国洗衣粉和洗涤剂产量
图:2008-2015年中国非离子表面活性剂进出口量
图:2008-2015年中国非离子表面活性剂进出口单价
图:2015年1-10月中国非离子表面活性剂进口来源分布(按进口量)
图:2015年1-10月中国非离子表面活性剂出口目的地分布(按出口量)
图:2011-2015年陶氏化学销售收入与净利润
图:2014-2015年美国陶氏化学(分部门)销售额占比
图:2012-2015年陶氏化学高性能材料及化学品部门销售额及EBITDA
图:2014年陶氏化学高性能材料及化学品部门(分产品)销售额占比
图:2011-2015年克莱恩销售收入与净利润
表:克莱恩分部业务简介
图:2013-2015年克莱恩(分业务)营业收入占比
图:2012-2015年克莱恩Care Chemicals销售收入及EBITDA
图:2012-2015年克莱恩Natural Resources销售收入及EBITDA
表:2014年克莱恩在华主要子公司
表:2014年克莱恩在华主要子公司业务
图:2011-2015年Lotte销售收入与净利润
表:Lotte业务部门及主要产品
图:2014年Lotte(分业务)销售收入占比 56
图:2014年Lotte主营产品及产能
表:2015年Lotte拟在建项目情况
表:2014年Lotte在华主要子公司销售收入与净利润
图:2011-2015年奥克股份营业收入与净利润
表:2013-2015年奥克股份(分产品)营业收入
表:2013-2015年奥克股份(分产品)营业收入占比
表:2012-2014年奥克股份(分地区)营业收入
表:2012-2014年奥克股份(分地区)营业收入占比
表:2011-2015年奥克股份(分产品)毛利率
图:2013-2015年奥克股份研发支出及占营业收入的比例
表:2014年奥克股份主要技术研发项目
图:奥克股份业务定位图
图:2011-2014年奥克股份聚醚单体产销量
表:2014年奥克股份环氧乙烷深加工业务相关子公司介绍
表:2014年奥克股份环氧乙烷深加工业务相关子公司营业收入及净利润
表:截止2015年6月30日奥克股份重大建设项目进展情况
表:截至2015年11月底奥克股份环氧乙烷衍生物产品产能
图:2015-2018年奥克股份营业收入与净利润预测
图:2011-2015年科隆精化营业收入和净利润
表:2013-2015年科隆精化(分产品)营业收入
表:2013-2015年科隆精化(分产品)营业收入占比
表:2013-2015年科隆精化(分地区)营业收入
表:2013-2015年科隆精化(分地区)营业收入
表:2013-2015年科隆精化(分产品)毛利率
图:2013-2015年科隆精化研发支出及其占营业收入的比例
图:2012-2014年科隆精化前五名客户贡献收入及占比
表:2014H1科隆精化前五名客户名称、收入及营收占比
图:2012-2014年科隆精化前五名供应商采购额及占比
表:2014H1科隆精化前五名供应商名称、采购金额及占比
表:2011-2014年科隆精化环氧乙烷衍生物产品产量、产能和产能利用率
图:2011-2014年科隆精化聚醚单体产销量
图:2011-2014年科隆精化晶硅切割液产销量
表:2011-2014年科隆精化聚羧酸减水剂产品产量、产能和产能利用率
图:2011-2014年科隆精化聚羧酸减水剂浓缩液产销量
图:2011-2014年科隆精化聚羧酸减水剂泵送剂产销量
表:2011-2014年科隆精化主营产品平均销售价格
表:2014年科隆精化募投项目
图:2015-2018年科隆精化营业收入与净利润预测
表:浙江皇马聚乙二醇单甲醚MPEG系列产品
表:浙江皇马烯丙基聚氧乙烯APEG系列产品
表:浙江皇马甲氧基聚乙二醇甲基丙烯酸酯产品
表:上海台界聚乙二醇单甲醚MPEG系列产品
表:上海台界烯丙基聚氧乙烯APEG系列产品
图:2011-2014年佳化化学营业收入与净利润
表:2011-2014年佳化化学(分产品)营业收入
表:2011-2014年佳化化学(分产品)营业收入占比
表:2011-2014年佳化化学(分地区)营业收入
表:2011-2014年佳化化学(分地区)营业收入占比
表:2011-2014年佳化化学主营业务及分产品毛利率
图:2011-2014年佳化化学研发支出及其占营业收入的比例
图:2011-2014年佳化化学前五名客户贡献收入及占营业收入的比例
表:2014年1-9月佳化化学前五名客户名称、收入贡献及占比
图:2011-2014年佳化化学前五名供应商采购金额及占采购总额的比例
表:2014年1-9月佳化化学前五名供应商名称、采购金额及占比
图:2011-2014年佳化化学非离子表面活性剂业务产能及利用率
图:2011-2014年佳化化学非离子表面活性剂销量及单价
表:威尔化工万吨封端醚项目相关产品及产能
表:威尔化工MPEG系列产品
表:威尔化工丙烯醇醚系列产品
表:江苏苏博特产品应用范例
图:2011-2015年建研集团营业收入与净利润
表:2013-2015年建研集团(分产品)营业收入
图:2013-2015年建研集团(分产品)营业收入占比
表:2013-2015年建研集团(分地区)营业收入
图:2013-2015年建研集团(分地区)营业收入占比
表:2013-2015年建研集团(分产品)毛利率
图:2013-2015年建研集团研发支出及占营业收入的比例
图:2011-2014年建研集团外加剂业务收入及净利润
图:2010-2014年建研集团外加剂销量
表:2015H1建研集团外加剂产品子公司及其营业收入、净利润
图:2015-2018年建研集团营业收入与净利润预测
图:2010-2014年华伟银凯营业收入与营业利润
表:2010-2014年华伟银凯(分产品)营业收入
图:2010-2014年华伟银凯(分产品)营业收入占比
表:2011-2013年华伟银凯(分地区)营业收入
图:2010-2014年华伟银凯聚羧酸减水剂营业收入与毛利率
Comparison between Advantages and Disadvantages of Various Polyether Monomers in Superplasticizer Field
Polyether Monomer (MPEG/TPEG/APEG) Industry Chain
Share of Three Polyether Monomers in Chinese Polycarboxylate Superplasticizer Market, 2010-2014
China's Volume of Polyether Monomer Used in Superplasticizer, 2008-2015
Polyether Monomer Related Capacity and Expansion of Major Chinese Enterprises, 2014-2015
Price Trend of Polyether Monomer in China, 2011-2015
China's Volume of Polyether Monomer Used in Superplasticizer, 2014-2018E
China's EO and Commercial EO Capacity (by Company/Region), as of End Nov. 2015
China's EO Apparent Consumption, 2006-2015
China's EO Consumption Structure (by Product), 2014
China's EO Capacity Distribution (by Enterprise), as of Nov. 2015
China's EO Capacity Distribution (by Region), as of end of Nov. 2015
Top Ten EO Enterprises’ Capacity and Proportion in China, as of End of Nov. 2015
Average Market Price of EO (Industrial First-grade) in China, 2007-2015
China's Methanol Capacity, 2007-2015
China's Refined Methanol Output, 2007-2015
China's Refined Methanol Output Structure (by Region), 2014
China's Methanol Import/Export Volume and Foreign-trade Dependence, 2008-2015
Average Market Price of Methanol (First Grade) in China, 2006-2015
Supply & Demand of AA&AE in China, 2008-2015
China's AA&AE Capacity (by Enterprise/Product), as of End of Nov. 2015
Market Price of AA&AE (by Product) in China, 2011-2015
China's Polycarboxylate Superplasticizer Consumption, 2007-2015
Sales Volume and Market Share of Top 9 Polycarboxylate Superplasticizer Manufacturers in China, 2014
Sales and Unit Price of Top 9 Polycarboxylate Superplasticizer Manufacturers in China, 2014
China's AEO Output and Growth Rate, 2006-2015
China's Apparent Consumption and Self-sufficiency Rate of Surfactant AEO, 2008-2015
China's Output of Synthetic Washing Powder and Detergent, 2008-2015
China's Import/Export Volume of Non-ionic Surfactant, 2008-2015
China's Import/Export Unit Price of Non-ionic Surfactant, 2008-2015
Distribution of China's Non-ionic Surfactant Import Sources (by Import Volume), Jan.-Oct. 2015
Distribution of China's Non-ionic Surfactant Export Destinations (by Export Volume), Jan.-Oct. 2015
Revenue and Net Income of Dow, 2011-2015
Sales Structure of Dow (by Division), 2014-2015
Sales and EBITDA of Dow's High Performance Materials & Chemicals Division, 2012-2015
Sales Structure of Dow's High Performance Materials & Chemicals Division (by Product), 2014
Revenue and Net Income of Clariant, 2011-2015
Business Introduction of Clariant by Division
Revenue Structure of Clariant (by Business), 2013-2015
Revenue and EBITDA of Clariant - Care Chemicals, 2012-2015
Revenue and EBITDA of Clariant - Natural Resources, 2012-2015
Main Subsidiaries of Clariant in China, 2014
Business of Clariant's Main Subsidiaries in China, 2014
Revenue and Net Income of LOTTE, 2011-2015
Business Segments and Main Products of LOTTE
Revenue Structure of LOTTE (by Business), 2014
Main Products and Capacity of LOTTE as of 2014
LOTTE's Projects Planned and Under Construction, 2015
Sales and Net Income of LOTTE's Main Subsidiaries in China, 2014
Revenue and Net Income of Liaoning Oxiranchem, 2011-2015
Revenue Breakdown of Liaoning Oxiranchem (by Product), 2013-2015
Revenue Structure of Liaoning Oxiranchem (by Product), 2013-2015
Revenue Breakdwon of Liaoning Oxiranchem (by Region), 2012-2014
Revenue Structure of Liaoning Oxiranchem (by Region), 2012-2014
Gross Margin of Liaoning Oxiranchem (by Product), 2011-2015
R&D Costs and % of Total Revenue of Liaoning Oxiranchem, 2013-2015
R&D Projects of Liaoning Oxiranchem, 2014
Business Positioning Map of Liaoning Oxiranchem
Output and Sales Volume of Liaoning Oxiranchem's Polyether Monomer, 2011-2014
Introduction to EO Deep Processing Related Subsidiaries of Liaoning Oxiranchem, 2014
Revenue and Net Income of EO Deep Processing Related Subsidiaries of Liaoning Oxiranchem, 2014
Progress of Liaoning Oxiranchem's Key Construction Projects as of June. 30, 2015
Capacity of Liaoning Oxiranchem's EO Derivatives, as of Nov.2015
Revenue and Net Income of Liaoning Oxiranchem, 2015-2018E
Revenue and Net Income of Kelong Fine Chemical, 2011-2015
Revenue Breakdown of Kelong Fine Chemical (by Product), 2013-2015
Revenue Structure of Kelong Fine Chemical (by Product), 2013-2015
Revenue Breakdown of Kelong Fine Chemical (by Region), 2013-2015
Revenue Structure of Kelong Fine Chemical (by Region), 2013-2015
Gross Margin of Kelong Fine Chemical (by Product), 2013-2015
R&D Costs and % of Total Revenue of Kelong Fine Chemical, 2013-2015
Kelong Fine Chemical's Revenue from Top 5 Clients and % of Total Revenue, 2012-2014
Name List and Revenue Contribution of Kelong Fine Chemical's Top 5 Clients, 2014H1
Kelong Fine Chemical's Procurement from Top 5 Suppliers and % of Total Procurement, 2012-2014
Name List and Procurement Contribution of Kelong Fine Chemical's Top 5 Suppliers, 2014H1
Output, Capacity and Capacity Utilization of Kelong Fine Chemical's EO Derivatives, 2011-2014
Output and Sales Volume of Kelong Fine Chemical's Polyether Monomer, 2011-2014
Crystalline Silicon Cutting Fluid Output and Sales Volume of Kelong Fine Chemical, 2011-2014
Output, Capacity and Capacity Utilization of Kelong Fine Chemical's Polycarboxylate Superplasticizer Products, 2011-2014
Output and Sales Volume of Kelong Fine Chemical's Polycarboxylate Superplasticizer Concentrates, 2011-2014
Polycarboxylate Superplasticizer Output and Sales Volume of Kelong Fine Chemical, 2011-2014
Average Selling Price of Kelong Fine Chemical's Main Products, 2011-2014
Fundraising Projects of Kelong Fine Chemical, 2014
Revenue and Net Income of Kelong Fine Chemical, 2015-2018E
MPEG Products of Huangma Chemical
APEG Products of Huangma Chemical
MPEGMA Products of Huangma Chemical
MPEG Products of Taijie Chemical
APEG Products of Taijie Chemical
Revenue and Net Income of Jiahua Chemicals, 2011-2014
Revenue Breakdown of Jiahua Chemicals (by Product), 2011-2014
Revenue Structure of Jiahua Chemicals (by Product), 2011-2014
Revenue Breakdown of Jiahua Chemicals (by Region), 2011-2014
Revenue Structure of Jiahua Chemicals (by Region), 2011-2014
Main Business and Gross Margin (by Product) of Jiahua Chemicals, 2011-2014
R&D Costs and % of Total Revenue of Jiahua Chemicals, 2011-2014
Jiahua Chemicals' Revenue from Top 5 Clients and % of Total Revenue, 2011-2014
Name List and Revenue Contribution of Jiahua Chemicals' Top 5 Clients, Jan.-Sep.2014
Jiahua Chemical’s Procurement from Top 5 Suppliers and % of Total Procurement, 2011-2014
Name List and Procurement Contribution of Jiahua Chemicals’ Top 5 Suppliers, Jan.-Sep. 2014
Capacity and Capacity Utilization of Jiahua Chemicals' Non-ionic Surfactant, 2011-2014
Sales Volume and Unit Price of Jiahua Chemicals' Non-ionic Surfactant, 2011-2014
Related Products and Capacity of WELL Chemical's 10KT Terminated Ether Project
MPEG Products of WELL Chemical
Allyl Alcohol Ether Products of WELL Chemical
Product Application of Sobute New Materials (Model)
Revenue and Net Income of Xiamen Academy of Building Research Group, 2011-2015
Revenue Breakdown of Xiamen Academy of Building Research Group (by Product), 2013-2015
Revenue Structure of Xiamen Academy of Building Research Group (by Product), 2013-2015
Revenue Breakdown of Xiamen Academy of Building Research Group (by Region), 2013-2015
Revenue Structure of Xiamen Academy of Building Research Group (by Region), 2013-2015
Gross Margin of Xiamen Academy of Building Research Group (by Product), 2013-2015
R&D Costs and % of Total Revenue of Xiamen Academy of Building Research Group, 2013-2015
Revenue and Gross Margin of Xiamen Academy of Building Research Group 's Admixtures, 2011-2014
Sales Volume of Xiamen Academy of Building Research Group 's Admixtures, 2010-2014
Revenue and Net Income of Xiamen Academy of Building Research Group 's Admixture Subsidiaries, 2015H1
Revenue and Net Income of Xiamen Academy of Building Research Group, 2015-2018E
Revenue and Operating Income of Huawei Yinkai, 2010-2014
Revenue Breakdown of Huawei Yinkai (by Product), 2010-2014
Revenue Structure of Huawei Yinkai (by Product), 2010-2014
Revenue Breakdown of Huawei Yinkai (by Region), 2011-2013
Revenue and Gross Margin of Huawei Yinkai's Polycarboxylate Superplasticizer, 2010-2014
如果这份报告不能满足您的要求,我们还可以为您定制报告,请 留言说明您的详细需求。
|