|
|
|
报告导航:研究报告—
生命科学—制药医疗
|
|
2015-2018年中国肝素行业研究报告 |
 |
字数:3.8万 |
页数:104 |
图表数:105 |
|
中文电子版:8500元 |
中文纸版:4250元 |
中文(电子+纸)版:9000元 |
|
英文电子版:2250美元 |
英文纸版:2400美元 |
英文(电子+纸)版:2550美元 |
|
编号:ZYM072
|
发布日期:2015-12 |
附件:下载 |
 |
|
|
中国是全球最大的肝素原料药生产与出口国,在全球肝素原料药市场份额占比约达80%。经历了2008-2010年的“井喷”式增长后,由于国际市场低迷,加之出口肝素标准的提高,2011-2013年中国肝素原料出口量连续下降。2014年开始,中国肝素及盐出口回暖。2015年1-10月,中国肝素及盐出口量达123.2吨,高于14全年的106.7吨;不过出口均价下降至3945.6美元/吨,同比下降30.7%。
海普瑞、南京健友、东诚药业、千红制药是全球及中国肝素原料药主要供应商,2014年产能合计20万亿单位以上;并且连续多年位居中国肝素出口前四,合占中国肝素出口总额70%以上份额。
在肝素原料药供应能力及产品等级日益提高的同时,中国肝素制剂市场规模也在不断增,2014年中国肝素制剂市场规模已达50亿元左右。2015年4月,国家人社保发布的《关于对国家基本医疗保险、工伤保险和生育保险药品目录中部分药品进行调整规范的通知》将 “依诺肝素钠注射液”、“达肝素钠注射液”、“那屈肝素钙注射液”归入了医保目录(此前只有在部分省市是进入地方医保)。这无疑将促进中国肝素制剂特别是低分子肝素制剂的消费,预计2015年中国肝素制剂市场规模可达63.8亿元,同比增长27.9%。
基于公司发展和对肝素产品前景看好等综合考虑,海普瑞、南京健友、东诚药业、千红制药、常州生化药业等多家企业近年不断布局或完善低分子肝素原料药及制剂产业。
南京健友近年一直稳居中国肝素原料药出口第二,也是国内低分子肝素产品最为丰富的企业。2014年,公司肝素原料药产销约为4万亿单位。2014年,公司依诺肝素钠原料药及制剂、达肝素钠原料药及制剂均获得新药产品证书;而那曲肝素钙原料药及制剂也于2015年5月13日获批。此外,南京健友还有合计3000kg/a的低分子肝素(分别是1000kg/a依诺肝素钠、1000kg/a达肝素钠、1000kg/a那曲肝素钙)在建生产线项目,预计2017年12月竣工投产。
千红制药是中国主要肝素原料药供应商之一,近年出口排名第四。2014年,公司肝素原料药产能5.5万亿单位,不过基于市场考虑,全年产销仅在2万亿单位左右。2015年,公司获得依诺肝素钠原料药及制剂的药品注册批件;达肝素通过了CFDA的现场检查;同年12月,那屈肝素钙原料及制剂通过了新药审评,将进入生产现场检查阶段。此外,公司的肝素钠制剂扩产在建项目,预计2016年3月即可完工。
《2015-2018年中国肝素行业研究报告》主要内容如下:
 全球肝素市场供需、竞争格局及发展预测等; 全球肝素市场供需、竞争格局及发展预测等;
中国肝素行业政策、市场现状、竞争格局、进出口及发展预测等;
中国7家主要肝素企业的经营情况、肝素业务及发展前景等。
As the world's largest heparin API producer and exporter, China seizes about 80% share of the global heparin API market. After the explosive growth in 2008-2010, the stagnant international market and the improved standards for heparin export pulled down the export volume of China's heparin API during 2011-2013. From 2014 onwards, China has seen the export of heparin and its salts warm up. From January to October of 2015, China exported 123.2 tons of heparin and its salts, higher than 106.7 tons in the whole 2014; however, the average export price fell 30.7% year on year to USD3,945.6 / ton.
The major global heparin API suppliers, including Hepalink, Nanjing King-friend, Dongcheng Biochemicals and Qianhong Bio-pharma generated the combined capacity of over 20 trillion units in 2014; also, they have been among the top 4 heparin exporters in China for many years, together accounting for over 70% of China’s total heparin exports.
Along with the intensified heparin API supply capacity and raised product grades, Chinese heparin preparation market size is constantly expanding, reaching about RMB5 billion in 2014. In April 2015, Ministry of Human Resources and Social Security of the People's Republic of China issued Circular on Adjusting and Standardizing Some Drugs Listed in Drug Catalog of National Basic Medical Insurance, Industrial Injury Insurance and Maternity Insurance to contain "enoxaparin sodium injection", "dalteparin sodium injection" and "nadroparin calcium injection" in the aforementioned catalog (previously only included in the medical insurance of some provinces and cities). This move will undoubtedly stimulate the consumption of heparin preparations in China, especially low molecular weight heparin preparations. Chinese heparin preparation market size is expected to jump 27.9% year on year to RMB6.38 billion in 2015.
Based on the corporate development and positive prospects of heparin products, Hepalink, Nanjing King-friend, Dongcheng Biochemicals, Qianhong Bio-pharma, Changshan Biochemical Pharmaceutical and other companies have been either deploying or improving low molecular weight heparin API and preparation industries in recent years.
Nanjing King-friend has consistently ranked second in Chinese heparin API export market in recent years, and boasts the most diversified low molecular weight heparin products. In 2014, the company produced and sold about 4 trillion units of heparin API. Meanwhile, it received new drug certifications on enoxaparin sodium API and preparations, dalteparin sodium API and preparations. It obtained an approval on nadroparin calcium API and preparations on May 13, 2015. In addition, Nanjing King-friend has a production line involved with 3000kg/a low molecular weight heparin (1000kg/a enoxaparin sodium, 1000kg/a dalteparin, 1000kg/a nadroparin calcium) under construction; the project is expected to be completed and put into operation in December 2017.
As one of the main suppliers of heparin API in China, Qianhong Bio-pharma has ranked fourth in exports in recent years. In 2014, the company's heparin API capacity amounted to 5.5 trillion units, but the annual output and sales volume only reached about 2 trillion units based on market considerations. In 2015, the company was granted with a drug registration approval on enoxaparin sodium API and preparations; its dalteparin passed the inspection by CFDA; its nadroparin API and preparations were recognized by new drug review in December, and will go into the production inspection stage. Besides, the company’s ongoing heparin sodium preparation expansion project is expected to be completed in March 2016.

China Heparin Industry Report, 2015-2018 mainly deals with the followings:
 Global heparin supply & demand, competitive landscape and forecast, etc.; Global heparin supply & demand, competitive landscape and forecast, etc.;
Policies, market situation, competitive landscape, import & export, and development forecast, etc. of China heparin industry;
Operation, Heparin Business, development prospect, etc. of 7 heparin enterprises in China.
第一章 肝素行业概述
1.1 定义和分类
1.2 产业链
第二章 中国肝素行业运行环境分析
2.1 进入壁垒
2.1.1 相关政策
2.1.2 技术要求
2.1.3 资金壁垒
2.2 全球市场供需
2.3 全球市场竞争
2.4 全球市场预测
第三章 中国肝素原料药行业发展概况
3.1 市场现状
3.2 市场供给
3.3 竞争格局
3.4 进出口
3.4.1 出口
3.4.2 进口
3.5 发展前景及预测
第四章 中国肝素制剂行业发展概况
4.1 市场规模
4.2 低分子肝素制剂
4.2.1 低分子肝素钙制剂
4.2.2 低分子肝素钠制剂
4.3普通肝素制剂
4.4 发展前景及预测
第五章 中国主要肝素企业分析
5.1 海普瑞
5.1.1 公司简介
5.1.2 经营状况
5.1.3 营收构成
5.1.4 毛利率
5.1.5 研发及投资
5.1.6 主要客户
5.1.7 肝素业务
5.1.8 发展前景及预测
5.2 千红制药
5.2.1 公司简介
5.2.2 经营状况
5.2.3 营收构成
5.2.4 毛利率
5.2.5 研发及投资
5.2.6客户与供应商
5.2.7 肝素业务
5.2.8 发展前景及预测
5.3 东诚药业
5.3.1 公司简介
5.3.2 经营状况
5.3.3 营收构成
5.3.4 毛利率
5.3.5 研发及投资
5.3.6 主要客户
5.3.7 肝素业务
5.3.8 发展前景及预测
5.4 常山药业
5.4.1 公司简介
5.4.2 经营状况
5.4.3 营收构成
5.4.4 毛利率
5.4.5 研发及投资
5.4.6 主要客户
5.4.6 肝素业务
5.4.7 发展前景及预测
5.5 红日药业
5.5.1 公司简介
5.5.2 经营状况
5.5.3 营收构成
5.5.4 毛利率
5.5.5 研发及投资
5.5.6 主要客户
5.5.7 肝素业务
5.5.8 发展前景及预测
5.6 南京健友
5.6.1 公司简介
5.6.2 经营状况及发展前景
5.7 江苏万邦
5.7.1 公司简介
5.7.2 发展情况
5.7.3 经营状况
5.7.4 肝素业务
1. Overview of Heparin Industry
1.1 Definition and Classification
1.2 Industry Chain
2. Operating Environment of Heparin Industry in China
2.1 Access Barriers
2.1.1 Related Policies
2.1.2 Technical Requirements
2.1.3 Capital Barrier
2.2 Global Market Supply & Demand
2.3 Global Market Competition
2.4 Global Market Forecast
3. Development of Heparin API Industry in China
3.1 Status quo
3.2 Supply & Demand
3.3 Competitive Landscape
3.4 Import & Export
3.4.1 Export
3.4.2 Import
3.5 Prospect and Forecast
4. Development of Heparin Preparation Industry in China
4.1 Market Size
4.2 Low Molecular Heparin Preparation
4.2.1 Low Molecular Weight Heparin Calcium Preparation
4.2.2 Low Molecular Weight Heparin Sodium Preparation
4.3 Unfractionated Heparin Preparation
4.4 Prospect and Forecast
5. Key Heparin Enterprises in China
5.1 Hepalink
5.1.1 Profile
5.1.2 Operation
5.1.3 Revenue Structure
5.1.4 Gross Margin
5.1.5 R&D and Investment
5.1.6 Major Clients
5.1.7 Heparin Business
5.1.8 Prospect and Forecast
5.2 Qianhong Bio-pharma
5.2.1 Profile
5.2.2 Operation
5.2.3 Revenue Structure
5.2.4 Gross Margin
5.2.5 R&D and Investment
5.2.6 Clients and Suppliers
5.2.7 Heparin Business
5.2.8 Prospect and Forecast
5.3 Dongcheng Biochemicals
5.3.1 Profile
5.3.2 Operation
5.3.3 Revenue Structure
5.3.4 Gross Margin
5.3.5 R&D and Investment
5.3.6 Major Clients
5.3.7 Heparin Business
5.3.8 Prospect and Forecast
5.4 Changshan Biochemical Pharmaceutical
5.4.1 Profile
5.4.2 Operation
5.4.3 Revenue Structure
5.4.4 Gross Margin
5.4.5 R&D and Investment
5.4.6 Major Clients
5.4.7 Heparin Business
5.4.8 Prospect and Forecast
5.5 Tianjin Chase Sun Pharmaceutical
5.5.1 Profile
5.5.2 Operation
5.5.3 Revenue Structure
5.5.4 Gross Margin
5.5.5 R&D and Investment
5.5.6 Major Clients
5.5.7 Heparin Business
5.5.8 Prospect and Forecast
5.6 Nanjing King-friend Biochemical Pharmaceutical
5.6.1 Profile
5.6.2 Operation and Prospect
5.7 Wanbang Biopharmaceuticals
5.7.1 Profile
5.7.2 Development
5.7.3 Operation
5.7.4 Heparin Business
表:肝素制剂的用途
表:低分子量肝素制剂和普通肝素制剂的性能比较
图:肝素行业产业链
表:中国肝素钠原料药与肝素规范要求
图:2007-2014年全球肝素制剂市场规模及同比增速
图:2010-2014年全球肝素制剂(分产品)市场规模
图:2014年肝素类药物全球消费分布
图:2007-2014年全球肝素原料药市场需求及同比增速
表:全球肝素主要厂商
表:2010-2014年全球主要肝素制剂品牌及销售额
图:2014-2018年全球肝素原料市场需求预测
图:2014-2018年全球肝素制剂市场规模预测
表:2008-2015年中国肝素原料药主要厂商毛利率
表:2014-2015年中国本土注册的肝素原料药及其企业
图:2006-2015年中国生猪出栏量及同比增速
表:2008-2015年中国肝素粗品理论产能
图:2008-2015年中国肝素钠原料药理论产能
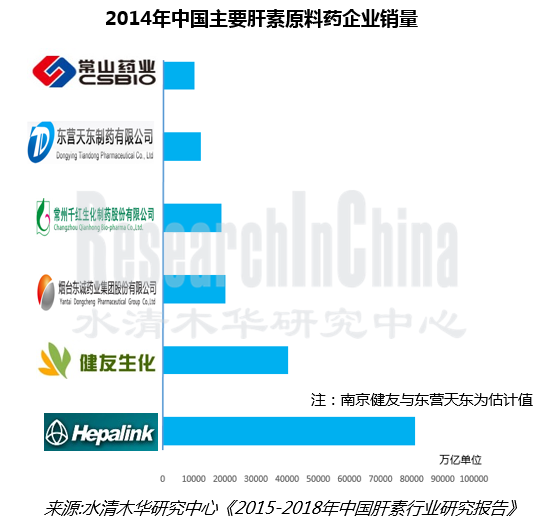
表:2014年中国肝素原料药主要企业产能及销量(亿单位)
图:2009-2015年中国肝素及盐出口量和出口金额
图:2009-2015年中国肝素及盐出口均价及同比增长
图:2015年1-10月中国肝素及其盐出口国家和地区(按出口量)
表:2012-2015年中国肝素及其盐出口前10国家和地区(按金额)
表:2014年中国肝素及盐出口企业top20(按出口金额)
图:2009-2015年中国肝素及其盐进口量、进口金额及单价
表:截止2015年10月中国拟/在建肝素钠原料药项目
图:2007-2015年中国肝素制剂市场规模及同比增长
图:2013年中国肝素制剂类产品市场份额
表:2014-2015年中国本土注册的肝素制剂及其企业
图:2007-2013年中国低分子肝素制剂市场规模及同比增长
图:2014年中国低分子肝素钙制剂市场份额
表:2014-2015年中国主要低分子肝素钙制剂企业价格
图:2014年中国低分子肝素钠制剂市场份额
图:2014年中国低分子肝素钠制剂市场份额
图:2014-2018年中国肝素制剂市场规模及同比增长
图:2009-2015年海普瑞营业收与利润
图:2009-2015年海普瑞(分地区)营业收入
图:2009-2015年海普瑞(分地区)主营收入占比
表:2009-2015年海普瑞(分产品)营业收入
表:2009-2015年海普瑞(分产品)主营收入占比
图:2009-2015年海普瑞综合毛利率
表:2012-2015年海普瑞(分地区)毛利率
表:2010-2015年海普瑞(分产品)毛利率
图:2009-2015年海普瑞研发投入及占营业收入的比重
图:2009-2014年海普瑞前五客户收入贡献及占比
表:2014年海普瑞主要子公司资产、收入及利润
图:2011-2014年海普瑞肝素钠原料产销量及库存
图:2008-2014年海普瑞主要肝素产品毛利率
图:2014-2018年海普瑞营业收入和净利润预测
图:2009-2015年千红制药营业收入和利润
图:2009-2015年千红制药(分地区)主营收入占比
图:2009-2015年千红制药(分地区)营业收入
图:2008-2013年千红制药(分产品)主营收入占比
图:2014-2015千红制药(分产品)主营收入占比
图:2008-2013年千红制药(分产品)营业收入
表:2009-2015年千红制药(分产品)毛利率
图:2009-2015年千红制药研发投入及占营业收入的比重
表:截止2015年6月千红制药拟/在建项目进展
图:2009-2014年千红制药前五名客户收入贡献及占比
图:2009-2014年千红制药前五名供应商采购金额及占比
表:2015上半年千红制药子公司资产、营业收入及净利润
图:2014-2018年千红制药营业收入和净利润预测
表:2015上半年年东城药业子公司资产、营收及净利润
图:2009-2015年东城药业营业收入和利润
图:2009-2015年东城药业(分地区)主营收入占比
图:2009-2015年东城药业(分地区)营业收入
表:2009-2015年东城药业(分产品)主营收入占比
表:2009-2015年东城药业(分产品)营业收入
图:2009-2015年东城药业综合毛利率
表:2008-2015年东城药业(分产品)毛利率
图:2009-2015年东城药业(分地区)毛利率
图:2010-2015年东城药业研发投入及占公司营业收入的比重
表:截止2014年底东城药业在研项目进度
图:2009-2014年东城药业前五名客户收入贡献及占比
表:2011-2014年东城药业肝素钠产销量及库存
图:2009-2015年东城药业肝素钠营业收入与净利润
图:2014-2018年东城药业营业收入和净利润预测
表:截至2014年底常山药业子公司经营情况(百万元)
图:2009-2015年常山药业营业收入和利润
图:2009-2015年常山药业(分地区)主营收入占比
图:2009-2015年常山药业(分地区)营业收入
表:2009-2015年常山药业(分产品)营业收入
图:2009-2015年常山药业综合毛利率
图:2009-2015年常山药业(分地区)毛利率
表:2009-2015年常山药业(分产品)毛利率
图:2009-2015年常山药业研发投入及占营业收入的比重
表:截止2015年6月常山药业在研产品进度
图:2009-2014年常山药业前五名客户收入贡献及占比
表:2011-2015年常山药业肝素钠原料药及其制剂产销量和库存
图:2014-2018年常山药业营业收入和净利润预测
图:2009-2015年红日药业营业收入和利润
表:2011-2014年红日药业成品药产销量及库存量
表:2009-2014年红日药业(分地区)主营收入占比
表:2009-2014年红日药业(分地区)营业收入
表:2009-2014年红日药业(分产品)主营收入占比
表:2009-2014年红日药业(分产品)营业收入
图:2009-2015年红日药业综合毛利率
表:2009-2014年红日药业(分地区)毛利率
表:2009-2014年红日药业(分产品)毛利率
图:2009-2015年红日药业研发投入及占营业收入的比重
表:截至2015年6月底红日药业主要研发产品及进度
表:2009-2014年红日药业前五名客户收入贡献及占比
图:2009-2014年红日药业肝素业务营业收入及毛利率
图:2014-2018年红日药业营业收入和净利润预测
表:截至2015年10月南京健友新老厂区肝素原料药和制剂项目情况
图:2012-2015年江苏万邦营业收入与利润
Application of Heparin Preparation
Performance Comparison between Low Molecular Weight Heparin Preparation and Unfractionated Heparin Preparation
Heparin Industry Chain
Standard Requirements of Heparin Sodium API and Heparin in China
Global Heparin Preparation Market Size and YoY Growth, 2007-2014
Global Heparin Preparation Market Size by Product, 2010-2014
Regional Distribution of Global Heparin Preparations Consumed, 2014
Global Heparin API Demand and YoY Growth, 2007-2014
World’s Major Heparin Producers
Revenue of Major Global Heparin Preparation Brands, 2010-2014
Global Demand for Heparin API, 2014-2018E
Global Heparin Preparations Market Size, 2014-2018E
Gross Margin of Major Heparin API Producers in China, 2008-2015
Heparin API and Related Companies Registered in China, 2014-2015
Pig Slaughter Capacity and YoY Growth in China, 2006-2015
China’s Theoretical Capacity of Heparin Crude Products, 2008-2015
China’s Theoretical Capacity of Heparin Sodium API, 2008-2015
Capacity and Sales Volume of Major Heparin API Manufacturers in China, 2014
Export Volume and Export Value of Heparin and Its Salts in China, 2009-2015
Average Export Prices of China’s Heparin and Its Salts and YoY Growth, 2009-2015
Export Destinations of China’s Heparin and Its Salts by Export Volume, Jan-Oct 2015
Top 10 Export Destinations of China’s Heparin and Its Salts by Export Value, 2012-2015
China’s Top 20 Heparin and Its Salts Exporters by Export Value, 2014
Import Volume, Import Value and Unit Price of Heparin and Its Salts in China, 2009-2015
Heparin Sodium API Projects Proposed/Under Construction in China, by the end of Oct 2015
Chinese Heparin Preparations Market Size and YoY Growth, 2007-2015
Market Share of Heparin Preparations in China by Product, 2013
Heparin Preparations and Related Companies Registered in China, 2014-2015
Chinese Low Molecular Weight Heparin Preparation Market Size and YoY Growth, 2007-2013
Market Share of Low Molecular Weight Heparin Calcium in China, 2014
Prices Offered by Major Low Molecular Weight Heparin Calcium Enterprises in China, 2014-2015
Market Share of Low Molecular Weight Heparin Sodium Preparations in China, 2014
Chinese Heparin Preparation Market Size and YoY Growth, 2014-2018E
Revenue and Profit of Hepalink, 2009-2015
Revenue of Hepalink by Region, 2009-2015
Operating Revenue Structure of Hepalink by Region, 2009-2015
Revenue of Hepalink by Product, 2009-2015
Operating Revenue Structure of Hepalink by Product, 2009-2015
Consolidated Gross Margin of Hepalink, 2009-2015
Gross Margin of Hepalink by Region, 2012-2015
Gross Margin of Hepalink by Product, 2010-2015
R&D Costs and % of Total Revenue of Hepalink, 2009-2015
Hepalink’s Revenue from Top 5 Clients and % of Total Revenue, 2009-2014
Assets, Revenue and Profit of Hepalink’s Major Subsidiaries, 2014
Output, Sales Volume and Inventory of Hepalink’s Heparin Sodium API, 2011-2014
Gross Margin of Hepalink’s Main Heparin Products, 2008-2014
Revenue and Net Income of Hepalink, 2014-2018E
Revenue and Profit of Qianhong Bio-pharma, 2009-2015
Operating Revenue Structure of Qianhong Bio-pharma by Region, 2009-2015
Revenue of Qianhong Bio-pharma by Region, 2009-2015
Operating Revenue Structure of Qianhong Bio-pharma by Product, 2008-2013
Operating Revenue Structure of Qianhong Bio-pharma by Product, 2014-2015
Revenue of Qianhong Bio-pharma by Product, 2008-2014
Gross Margin of Qianhong Bio-pharma by Product, 2009-2015
R&D Costs and % of Total Revenue of Qianhong Bio-pharma, 2009-2015
Progress of Qianhong Bio-pharma’s Projects Proposed/Under Construction, by the end of Jun. 2015
Qianhong Bio-pharma’s Revenue from Top 5 Clients and % of Total Revenue, 2009-2014
Qianhong Bio-pharma’s Procurement from Top 5 Suppliers and % of Total Procurement, 2009-2014
Assets, Revenue and Net Income of Qianhong Bio-pharma’s Subsidiaries, 2015H1
Revenue and Net Income of Qianhong Bio-pharma, 2014-2018E
Assets, Revenue and Net Income of Dongcheng Biochemicals’ Subsidiaries, 2015H1
Revenue and Profit of Dongcheng Biochemicals, 2009-2015
Operating Revenue Structure of Dongcheng Biochemicals by Region, 2009-2015
Revenue of Dongcheng Biochemicals by Region, 2009-2015
Operating Revenue Structure of Dongcheng Biochemicals by Product, 2009-2015
Revenue of Dongcheng Biochemicals by Product, 2009-2015
Consolidated Gross Margin of Dongcheng Biochemicals, 2009-2015
Gross Margin of Dongcheng Biochemicals by Product, 2008-2015
Gross Margin of Dongcheng Biochemicals by Region, 2009-2015
R&D Costs and % of Total Revenue of Dongcheng Biochemicals, 2010-2015
Progress of Dongcheng Biochemicals’ Projects under Research, by the end of 2014
Dongcheng Biochemicals’ Revenue from Top 5 Clients and % of Total Revenue, 2009-2014
Output, Sales Volume and Inventory of Dongcheng Biochemicals’ Heparin Sodium, 2011-2014
Revenue and Net Income of Dongcheng Biochemicals’ Heparin Sodium, 2009-2015
Revenue and Net Income of Dongcheng Biochemicals, 2014-2018E
Operation of Changshan Biochemical's Subsidiaries, by the end of 2014
Revenue and Profit of Changshan Biochemical, 2009-2015
Operating Revenue Structure of Changshan Biochemical Pharmaceutical by Region, 2009-2015
Revenue of Changshan Biochemical Pharmaceutical by Region, 2009-2015
Revenue of Changshan Biochemical Pharmaceutical by Product, 2009-2015
Consolidated Gross Margin of Changshan Biochemical Pharmaceutical, 2009-2015
Gross Margin of Changshan Biochemical Pharmaceutical by Region, 2009-2015
Gross Margin of Changshan Biochemical Pharmaceutical by Product, 2009-2015
R&D Costs and % of Total Revenue of Changshan Biochemical Pharmaceutical, 2009-2015
Progress of Changshan Biochemical Pharmaceutical’s Products under Research, by the end of Jun. 2015
Changshan Biochemical Pharmaceutical’s Revenue from Top 5 Clients and % of Total Revenue, 2009-2014
Output, Sales Volume and Inventory of Changshan Biochemical Pharmaceutical’s Heparin Sodium API and Its Preparations, 2011-2015
Revenue and Net Income of Changshan Biochemical Pharmaceutical, 2014-2018E
Revenue and Profit of Tianjin Chase Sun Pharmaceutical, 2009-2015
Output, Sales Volume and Inventory of Tianjin Chase Sun Pharmaceutical’s Finished Drug Products, 2011-2014
Operating Revenue Structure of Tianjin Chase Sun Pharmaceutical by Region, 2009-2014
Revenue of Tianjin Chase Sun Pharmaceutical by Region, 2009-2014
Operating Revenue Structure of Tianjin Chase Sun Pharmaceutical by Product, 2009-2014
Revenue of Tianjin Chase Sun Pharmaceutical by Product, 2009-2014
Consolidated Gross Margin of Tianjin Chase Sun Pharmaceutical, 2009-2015
Gross Margin of Tianjin Chase Sun Pharmaceutical by Region, 2009-2014
Gross Margin of Tianjin Chase Sun Pharmaceutical by Product, 2009-2014
R&D Costs and % of Total Revenue of Tianjin Chase Sun Pharmaceutical, 2009-2015
Main R & D Products and Progress of Tianjin Chase Sun Pharmaceutical, by the end of Jun 2015
Tianjin Chase Sun Pharmaceutical’s Revenue from Top 5 Clients and % of Total Revenue, 2009-2014
Tianjin Chase Sun Pharmaceutical’s Revenue and Gross Margin from Heparin Business, 2009-2014
Revenue and Net Income of Tianjin Chase Sun Pharmaceutical, 2014-2018E
Heparin API and Preparation Projects of Nanjing King-friend’s Old and New Plants, by the end of Oct 2015
Revenue and Profit of Wanbang Biopharmaceuticals, 2012-2015
如果这份报告不能满足您的要求,我们还可以为您定制报告,请 留言说明您的详细需求。
|