|
|
|
报告导航:研究报告—
制造业—化工
|
|
2015-2018年全球及中国钛白粉行业研究报告 |
 |
字数:3.6万 |
页数:142 |
图表数:153 |
|
中文电子版:8000元 |
中文纸版:4000元 |
中文(电子+纸)版:8500元 |
|
英文电子版:2300美元 |
英文纸版:2500美元 |
英文(电子+纸)版:2600美元 |
|
编号:LMX074
|
发布日期:2015-12 |
附件:下载 |
 |
|
|
2014年以来,中国钛白粉行业供给不断扩大,需求并无实质性改善。2015年,从企业在建项目情况来看,新增产能有所趋缓,全年产能预计在358.4万吨,同比增长约4.1%。在产能不断增长的同时,中国钛白粉消费受下游行业产量增速放缓以及出口下滑影响持续低迷。2015年1-10月,中国涂料产量1394.6万吨,同比增长3.8%;中国塑料制品产量6119.2万吨,同比微增0.6%。
出口市场来看,2015年以来,杜邦、亨兹曼等国际企业接连下调旗下钛白粉产品价格,导致中国钛白粉立足世界市场的性价比优势不再明显,这是引起出口量有所下滑的主要因素。2015年1-10月,中国出口钛白粉44.3万吨,同比减少5.25%。
在产能过剩,下游需求疲软、环保日益趋严的叠加下,中国钛白粉企业从规模与技术上不断寻求突破。一方面,龙头企业依靠自身的资本、成本、规模、技术等优势,通过行业整合,不断扩大自己的市场份额与行业话语权;另一方面,积极发展氯化法钛白粉技术。
2014年10月,中核钛白公司通过旗下全资子公司安徽金星钛白有限公司4647万元收购无锡豪普钛业有限公司25%的股权,收购于2015年1月完成;2015年6月,佰利联宣布90亿元收购四川龙蟒钛业,强强联合后,硫酸法钛白粉总产能将达到56万吨,跻身中国第一,全球第四大钛白粉生产企业。
氯化法是中国钛白粉行业的未来发展方向。2014年,中国建成投产的氯化法工程有锦州钛业、云南新立和漯河兴茂,当年这三家企业的综合产量为43530吨,仅占全国钛白总产量的1.78%。2015年新增的氯化法产能是河南佰利联的6万吨/年项目。
在国内企业进行合并整合的同时,国外钛白粉生产企业资本运作频繁。2014 年10 月,享兹曼完成收购洛克伍德(Rockwood)旗下的莎哈利本(Sachtleben)钛白粉和特种添加剂业务(Performance Additives and Titanium Dioxide),并采取措施推动自身Pigments and Additives 部门进行IPO上市;2014年10月,科斯特宣布收购江西添光化工有限责任公司钛白粉业务,收购于2015 年1 月完成;2015年7月,杜邦完成钛白粉单元拆分工作,新成立的公司科慕独立上市。
《2015-2018年全球及中国钛白粉行业研究报告》主要涉及以下内容:
 全球钛白粉行业产能、产品结构、区域产能结构、生产企业产能及竞争格局分析; 全球钛白粉行业产能、产品结构、区域产能结构、生产企业产能及竞争格局分析;
中国钛白粉产业政策、产能、产量、消费量、进出口、价格走势及行业毛利率等;
中国钛白粉行业市场结构、市场格局及主要企业盈利分析;
钛白粉上游原材料产业分析,分别对钛矿和硫酸市场进行研究,进而分析钛白粉生产成本;
钛白粉下游应用领域分析,包括下游需求结构、涂料、塑料、造纸及脱硝催化剂行业对钛白粉的需求研究;
16家中国重点钛白粉生产企业及5家全球主要钛白粉生产企业分析,包含企业经营状况、钛白粉产销量、营收构成、毛利率、主要投资项目等;
中国钛白粉行业发展前景,包括产能、产量、进出口量及总需求量数据预测。
Since 2014, the supply of Chinese titanium dioxide industry has continued to expand, despite no substantial recovery in demand. In 2015, the ongoing projects of enterprises indicate that new capacity somewhat trends down; and the full-year capacity is expected to be 3.584 million tons, an increase of about 4.1% over last year. When the capacity is jumping, China’s consumption of titanium dioxide remains sluggish under the influence of the output slowdown of downstream industries and the decline in exports. From January to October of 2015, China’s coating output escalated by 3.8% year on year to 13.946 million tons; China produced 61.192 million tons of plastic products, up 0.6% year on year.
DuPont, Huntsman and other international peers have successively lowered their titanium dioxide prices since 2015, which weakens China’s price-performance superiority. As a result, China’s titanium dioxide export volume dropped 5.25% YoY to 443,000 tons during the period from January to October of 2015.
Given overcapacity, weak downstream demand and increasingly stricter environmental protection requirements, Chinese titanium dioxide companies have been seeking breakthroughs in scale and technology. On the one hand, leading companies make use of their advantages in capital, cost, scale, technology, etc to seize more market shares and negotiation power through industrial consolidation; on the other hand, they develop chlorination-method titanium dioxide technology vigorously.
In October 2014, CNNC Hua Yuan Titanium Dioxide announced to acquire 25% stake in Wuxi Haopu Titanium Co., Ltd. through its wholly-owned subsidiary Anhui Jinxing Titanium Dioxide Co., Ltd. for RMB46.47 million, and the purchase was completed in January 2015. In June 2015, Henan Billions Chemicals announced to take over Sichuan Lomon with RMB9 billion, which enabled it to rank first in China and fourth in the world with the titanium dioxide (sulfuric acid method) capacity of 560,000 tons.
Chlorination method is the future direction of China's titanium dioxide industry. In 2014, Jinzhou Titanium Industry, Yunnan Metallurgical Xinli Titanium Industry, and Luohe City Xingmao Titanium Industry put their chlorination-method titanium dioxide projects into production with the combined capacity of 43,530 tons which only accounted for 1.78% of the national total. In 2015, the new chlorination-method titanium dioxide capacity comes from the 60,000 tons / a project of Henan Billions Chemicals.
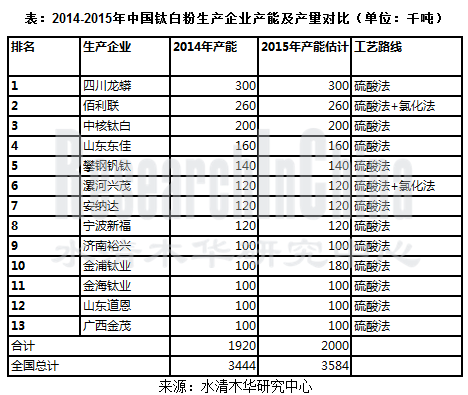
Capacity and Output of Titanium Dioxide Producers in China, 2014-2015
(Unit: kt)
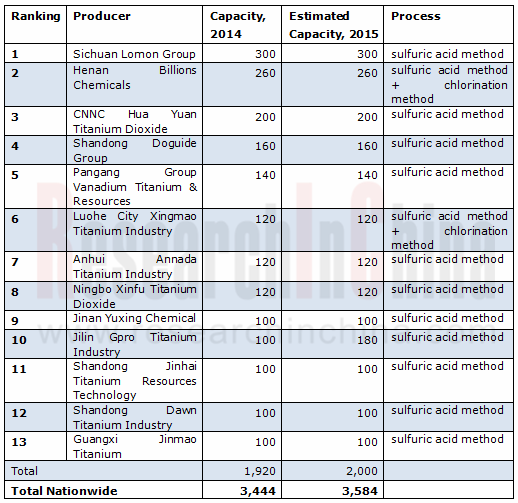
Source: ResearchInChina
When domestic enterprises are busy with M&A, foreign titanium dioxide manufacturers get involved in frequent capital operation. In October 2014, Huntsman acquired Rockwood’s Sachtleben Performance Additives and Titanium Dioxide, and took measures to advance IPO of its Pigments and Additives Division. Meanwhile, Cristal Global announced to purchase the titanium dioxide business of Jiangxi TIKON Titanium Co., Ltd in October 2014, and the acquisition was completed in January 2015. In July 2015, DuPont separated its titanium dioxide sector to establish an independent entity Chemour.
Global and China Titanium Dioxide Industry Report, 2015-2018, highlights the followings:
 Capacity, product structure, regional capacity structure, producers’ capacity and competitive landscape of global titanium dioxide industry; Capacity, product structure, regional capacity structure, producers’ capacity and competitive landscape of global titanium dioxide industry;
Policy, capacity, output, consumption, import & export, price trend, industrial gross margin, etc. of titanium dioxide industry in China;
Market structure, market pattern and major producers’ profitability in China titanium dioxide industry;
Upstream titanium dioxide raw material industry analysis from the perspective of titanium ore and sulfuric acid market, and cost analysis of titanium dioxide;
Downstream application of titanium dioxide, involving demand structure and the demand from sectors such as paint, plastic, papermaking and denitration catalyst;
Operation, output and sales volume of titanium dioxide, revenue structure, gross margin, major investment projects, etc. of 16 key Chinese titanium dioxide producers and 5 major titanium dioxide players in the world;
Development prospect of China’s titanium dioxide industry, covering forecast for capacity, output, import & export volume and total demand.
前言
第一章钛白粉行业概述
1.1 定义
1.2 分类
1.3 生产工艺
1.4 产业链
1.5 行业相关政策
1.5.1 产业政策
1.5.2 进出口相关政策
第二章 全球钛白粉行业发展状况
2.1 产品生产结构
2.2 产能
2.3 企业竞争格局
2.3.1 合并重组
2.3.2 市场格局
第三章 中国钛白粉行业发展状况
3.1 产能
3.1.1 整体分析
3.1.2 新增产能
3.1.3 产能数据
3.2 产量
3.3 消费量
3.4 进出口
3.4.1 进口
3.4.2 出口
3.5 价格走势
3.6 行业毛利率
第四章 中国钛白粉行业市场格局分析
4.1 市场结构
4.2 市场格局
4.3 区域结构
4.4 企业盈利分析
第五章 产业链分析——上游原材料
5.1 钛简介
5.2 钛矿
5.2.1 全球钛矿储量分布
5.2.2 全球钛矿产量分布
5.2.3 中国钛资源情况
5.2.4 中国钛矿进口情况
5.3 硫酸
5.4 钛白粉成本分析
第六章 产业链分析——下游应用行业
6.1 下游需求结构
6.2 涂料行业
6.2.1 市场分析
6.2.2 对钛白粉的需求
6.3 塑料行业
6.4 造纸行业
6.5 脱硝催化剂
6.5.1 市场分析
6.5.2 对钛白粉的需求
第七章 国内重点钛白粉企业分析
7.1 山东东佳
7.1.1 公司简介
7.1.2 钛白粉产销量
7.1.3 放弃IPO
7.2 佰利联
7.2.1 公司简介
7.2.2 钛白粉产销量
7.2.3 经营状况
7.2.4 营收构成
7.2.5 毛利率分析
7.2.6 研发及投资
7.2.7 收购龙蟒钛业
7.2.8 业绩预测
7.3 中核钛白
7.3.1 公司简介
7.3.3 钛白粉产销量
7.3.4 经营状况
7.3.5 营收构成
7.3.6 毛利率分析
7.3.7 研发与投资
7.3.8 公司收购
7.3.9 竞争优势
7.3.10 业绩预测
7.4 金浦钛业
7.4.1 公司简介
7.4.2 钛白粉产销量
7.4.3 经营状况
7.4.4 营收构成
7.4.5 毛利率分析
7.4.6 研发与投资
7.4.7 竞争优势
7.4.8 转型供应链管理和产业金融服务平台
7.4.9 业绩预测
7.5 安纳达
7.5.1 公司简介
7.5.2 钛白粉产销量
7.5.3 经营状况
7.5.4 营收构成
7.5.5 毛利率分析
7.5.6 研发与投资
7.5.7 竞争优势
7.5.8 业绩预测
7.6 龙蟒集团
7.6.1 公司简介
7.6.2 钛白粉产销量
7.6.3 经营状况
7.7 攀钢钒钛
7.7.1 公司简介
7.7.2 钛白粉业务
7.7.3 经营状况
7.7.4 营收构成
7.7.5 毛利率分析
7.7.6 研发与投资
7.7.7 竞争优势
7.7.8 剥离卡拉拉项目
7.7.9 业绩预测
7.8 云南大互通工贸有限公司
7.8.1 公司简介
7.8.2 发展历程
7.8.3 销售网络
7.9 漯河兴茂钛业股份有限公司
7.10 宁波新福钛白粉有限公司
7.11 山东金海钛业资源科技有限公司
7.12 山东道恩钛业有限公司
7.13 广西金茂钛业有限公司
7.13.1 公司简介
7.13.2 产品产能
7.13.3 营销网络
7.14 济南裕兴化工有限责任公司
7.15 江苏太白集团
7.16 蓝星化工广西分公司
第八章 国外重点钛白粉企业分析
8.1 科慕
8.1.1 公司简介
8.1.2 钛白粉业务
8.1.3 经营状况
8.1.4 发展计划
8.2 科斯特
8.2.1 公司简介
8.2.2 钛白粉业务
8.2.3 收购江西添光钛业
8.3 享兹曼
8.3.1 公司简介
8.3.2 钛白粉产销情况
8.3.3 经营状况
8.3.4 公司动态
8.3.5 发展战略
8.3.6 在华发展
8.4 康诺斯
8.4.1 公司简介
8.4.2 钛白粉产销量
8.4.3 经营状况
8.5 特诺
8.5.1 公司简介
8.5.2 钛白粉产销量
8.5.3 经营状况
8.5.4 在华发展
8.5.5 未来规划
第九章 市场总结与发展预测
9.1 市场总结
9.1.1 国内供应
9.1.2 国内需求
9.1.3 进出口
9.1.4 市场格局
9.2 发展预测
9.2.1 供给预测
9.2.2 需求预测
1. Overview of Titanium Dioxide Industry
1.1 Definition
1.2 Classification
1.3 Production Process
1.4 Industry Chain
1.5 Policies
1.5.1 Industrial Policies
1.5.2 Policies on Import and Export
2. Development of Global Titanium Dioxide Industry
2.1 Production Structure
2.2 Capacity
2.3 Competition among Enterprises
2.3.1 Merger and Reorganization
2.3.2 Market Pattern
3. Development of China Titanium Dioxide Industry
3.1 Capacity
3.1.1 Holistic Analysis
3.1.2 New Capacity
3.1.3 Capacity Figures
3.2 Output
3.3 Consumption
3.4 Import and Export
3.4.1 Import
3.4.2 Export
3.5 Price Trends
3.6 Gross Margin
4. Chinese Titanium Dioxide Market Pattern
4.1 Market Structure
4.2 Market Pattern
4.3 Regional Structure
4.4 Enterprises’ Profitability
5. Industry Chain -- Upstream
5.1 Introduction to Titanium
5.2 Titanium Ore
5.2.1 Global Reserves
5.2.2 Global Output
5.2.3 Titanium Resource in China
5.2.4 China’s Import of Titanium Ore
5.3 Sulfuric Acid
5.4 Cost of Titanium Dioxide
6. Industry Chain—Downstream
6.1 Demand Structure
6.2 Coating Industry
6.2.1 Market
6.2.2 Demand for Titanium Dioxide
6.3 Plastic Industry
6.4 Papermaking Industry
6.5 Denitration Catalyst
6.5.1 Market
6.5.2 Demand for Titanium Dioxide
7. Key Titanium Dioxide Enterprises in China
7.1 Shandong Doguide Group Co., Ltd.
7.1.1 Profile
7.1.2 Output and Sales Volume of Titanium Dioxide
7.1.3 Withdrawal of IPO
7.2 Henan Billions Chemicals Co., Ltd.
7.2.1 Profile
7.2.2 Output and Sales Volume of Titanium Dioxide
7.2.3 Operation
7.2.4 Revenue Structure
7.2.5 Gross Margin
7.2.6 R&D and Investment
7.2.7 Acquisition of Sichuan Lomon Titanium Industry Co., Ltd.
7.2.8 Performance Forecast
7.3 CNNC Hua Yuan Titanium Dioxide Co., Ltd.
7.3.1 Profile
7.3.3 Output and Sales Volume of Titanium Dioxide
7.3.4 Operation
7.3.5 Revenue Structure
7.3.6 Gross Margin
7.3.7 R&D and Investment
7.3.8 Acquisition
7.3.9 Competitive Advantage
7.3.10 Performance Forecast
7.4 Jilin Gpro Titanium Industry Co., Ltd.
7.4.1 Profile
7.4.2 Output and Sales Volume of Titanium Dioxide
7.4.3 Operation
7.4.4 Revenue Structure
7.4.5 Gross Margin
7.4.6 R&D and Investment
7.4.7 Competitive Advantage
7.4.8 Transformation to Supply Chain Management and Industrial Finance Service Platform
7.4.9 Performance Forecast
7.5 Anhui Annada Titanium Industry Co., Ltd.
7.5.1 Profile
7.5.2 Output and Sales Volume of Titanium Dioxide
7.5.3 Operation
7.5.4 Revenue Structure
7.5.5 Gross Margin
7.5.6 R&D and Investment
7.5.7 Competitive Advantage
7.5.8 Performance Forecast
7.6 Sichuan Lomon Group
7.6.1 Profile
7.6.2 Output and Sales Volume of Titanium Dioxide
7.6.3 Operation
7.7 Pangang Group Vanadium Titanium & Resources Co., Ltd.
7.7.1 Profile
7.7.2 Titanium Dioxide Business
7.7.3 Operation
7.7.4 Revenue Structure
7.7.5 Gross Margin
7.7.6 R&D and Investment
7.7.7 Competitive Advantage
7.7.8 Spin-off of Karara
7.7.9 Performance Forecast
7.8 Yunnan Dahutong Industry & Trading Co., Ltd.
7.8.1 Profile
7.8.2 Development Course
7.8.3 Sales Network
7.9 Luohe City Xingmao Titanium Industry Co., Ltd.
7.10 Ningbo Xinfu Titanium Dioxide Co., Ltd
7.11 Shandong Jinhai Titanium Resources Technology Co., Ltd.
7.12 Shandong DAWN Titanium Industry Co., Ltd.
7.13 Guangxi Jinmao Titanium Co., Ltd.
7.13.1 Profile
7.13.2 Capacity
7.13.3 Marketing Network
7.14 Jinan Yuxing Chemical Co, Ltd.
7.15 Jiangsu Taibai Group Co., Ltd.
7.16 Bluestar New Chemical Materials Co., Ltd. Guangxi Branch
8. Key Foreign Titanium Dioxide Enterprises
8.1 Chemours
8.1.1 Profile
8.1.2 Titanium Dioxide Business
8.1.3 Operation
8.1.4 Development Planning
8.2 Cristal
8.2.1 Profile
8.2.2 Titanium Dioxide Business
8.2.4 Acquisition of Jiangxi Tikon Titanium
8.3 Huntsman
8.3.1 Profile
8.3.2 Output and Sales Volume of Titanium Dioxide
8.3.3 Operation
8.3.4 Dynamics
8.3.5 Development Strategy
8.3.6 Development in China
8.4 Kronos
8.4.1 Profile
8.4.2 Output and Sales Volume of Titanium Dioxide
8.4.3 Operation
8.5 Tronox
8.5.1 Profile
8.5.2 Output and Sales Volume of Titanium Dioxide
8.5.3 Operation
8.5.4 Development in China
8.5.5 Development Planning
9. Market Overview and Development Forecast
9.1 Market Overview
9.1.1 Domestic Supply
9.1.2 Domestic Demand
9.1.3 Import and Export
9.1.4 Market Pattern
9.2 Development Forecast
9.2.1 Supply
9.2.2 Demand
图:钛白粉分类
图:硫酸法钛白粉生产工艺
图:氯化法钛白粉生产工艺
图:钛白粉行业产业链
表:2005-2015年中国钛白粉行业相关政策及标准
表:中国钛白粉进口涉及的政策和关税情况
图:全球钛白粉产能构成(按生产工艺)
图:2015年全球主要钛白粉生产商氯化法产能占比
图:2004-2015年全球钛白粉产能
图:2014年全球钛白粉产能分布
图:2014年全球钛白粉产能结构(按国家)
表:近20年全球钛白粉行业整合历程
图:2015年全球钛白粉市场份额(按企业产能)
图:2015年全球主要钛白粉生产企业产能
表:中国钛白粉企业产能规模演变
表:中国钛白粉在建项目一览(截止2015年9月底)
图:1999-2015年中国钛白粉产能及同比增速
图:1999-2015年中国钛白粉产量
图:2000-2015年中国金红石型钛白粉产量及占总产量的比重
图:2014年中国钛白粉产量结构
图:1999-2015年中国钛白粉消费量
图:1999-2015年中国钛白粉进口量
图:1999-2015年中国钛白粉出口量
表:2015年1-10月中国钛白粉出口(分国家)
图:2010-2015年中国市场钛白粉价格走势
图:2009-2015年佰利联和安纳达钛白粉产品毛利率
图:2015年中国钛白粉产能结构(按工艺)
表:中国氯化法钛白粉厂家生产情况(截至2015年11月)
表:2014-2015年中国钛白粉生产企业产能及产量对比
表:2014年中国各省钛白粉产能排名
表:2013-2015年中国主要钛白粉企业净利润
图:中国和国外原料钛加工结构对比
表:全球钛铁矿储量分布(按国家)
表:全球金红石储量分布(按国家)
表:2013-2014年全球钛铁矿产量分布
表:2013-2014年全球金红石产量分布
表:中国钛矿资源分布
图:2006-2015年中国钛矿砂及精矿进口量
图:2005-2015年中国硫酸产量
图:2014年金浦钛业钛白粉业务生产成本构成
图:2015年全球钛白粉消费结构
图:2015年中国钛白粉消费结构
图:2001-2015年中国涂料产量
表:涂料各细分领域对国产钛白粉和进口钛白粉的需求对比
图:2005-2015年中国塑料制品产量
图:2005-2015年中国机制纸及纸板产量
图:2011-2015中国纳米钛白粉需求量
表:山东东佳集团参股、控股企业情况
表:2007-2014年山东东佳钛白粉产能、产量及销量
表:山东东佳上市历程
图:佰利联产品线
表:佰利联产品产能
表:佰利联钛白粉产品介绍
表:2010-2015年佰利联钛白粉产量、销量及库存量
图:2009-2015年佰利联营业收入与净利润
表:2012-2015年佰利联营业收入(分产品)
图:2008-2015年佰利联营业收入(分区域)构成
表:2012-2015年佰利联毛利率(分产品)
表:2009-2015年佰利联研发收入及占比
表:佰利联主要在建项目
表:佰利6万吨氯化法钛白粉项目进展
图:佰利联收购龙蟒钛业前后的股权结构
表:龙蟒钛业控股和参股企业介绍
表:2015-2018年佰利联营业收入与净利润预测
图:2007-2015年中核钛白钛白粉产量
表:2012-2014年中核钛白公司钛白粉产品产量、销量及库存量
图:2009-2015年中核钛白营业收入与净利润
表:2012-2015年中核钛白营业收入(分产品)构成
图:2012-2015年中核钛白营业收入(分区域)构成
表:2012-2015年中核钛白毛利率
表:2012-2015年中核钛白研发费用及占营业收入的比例
表:中核钛白主要项目
表:2015-2018年中核钛白营业收入与净利润预测
表:2012-2015年金浦钛业钛白粉产量、销量及库存量
图:2011-2015年金浦钛业营业收入与净利润
表:2012-2015年金浦钛业营业收入(分产品)构成
图:2012-2015年金浦钛业营业收入(分区域)构成
表:2012-2015年金浦钛业主要产品毛利率
表:2012-2015年金浦太白研发费用及占公司营业收入的比重
表:金浦钛业主要项目介绍
表:金浦钛业非公开发行拟募集资金投向
表:2015-2018年金浦钛业营业收入与净利润预测
表:2011-2015年安纳达钛白粉产销量及库存量
图:2009-2015年安纳达营业收入与净利润
图:2009-2015年安纳达营业收入(分产品)构成
表:2015年上半年安纳达营业收入(分产品)构成
图:2009-2015年安纳达营业收入(分区域)构成
图:2009-2013年安纳达毛利率
表:2014-2015年安纳达毛利率
表:2009-2015年安纳达研发投入及占比
表:2015-2018年安纳达营业收入与净利润预测
图:四川龙蟒集团产业分布
图:2007-2015年四川龙蟒钛白粉产能及产量
表:2013-2014年龙蟒钛业主要财务指标
表:2011-2015年攀钢钒钛钛白粉产量、销量及库存量
图:2011-2015年攀钢钒钛钛白粉产品营业收入及同比变化
图:2009-2015年攀钢钒钛营业收入与净利润
图:2012-2015年攀钢钒钛营业收入(分产品)构成
图:2010-2015年攀钢钒钛营业收入(分区域)构成
表:2011-2015年攀钢钒钛主要产品毛利率
表:2012-2015年攀钢钒钛研发投入及占比
表:攀钢钒钛钛白粉项目
图:本次交易前攀钢钒钛股权结构
图:本次交易后攀钢钒钛股权结构
表:2013-2015年卡拉拉矿业有限公司主要营业指标
表:2015-2018年攀钢钒钛营业收入与净利润预测
表:云南大互通工贸有限公司发展历程
图:云南大互通工贸有限公司中国销售网络
图:云南大互通工贸有限公司国外销售网络
图:山东道恩钛业营销网络
表:广西金茂钛业有限公司基本信息
表:广西金茂钛业有限公司主要产品产能
图:广西金茂钛业中国销售网络
图:广西金茂钛业国外销售网络
图:广西金茂钛业销售办事处
图:科慕公司业务全球布局
图:科慕公司主要产品品牌
图:科慕公司钛白粉业务介绍
图:2012-2015年科慕公司营业收入与EBITDA(分业务)
图:2012-2014年科慕公司资产(分业务)
图:2015年前三季度科慕公司营业收入(分区域)构成
图:科斯特股权结构
图:科斯特业务全球布局
图:享兹曼全球业务分布
图:2015年享兹曼钛白粉营业收入构成
图:2009-2015年享兹曼钛白粉业务营业收入
图:2010-2015年享兹曼营业收入与净利润
图:2014-2015年享兹曼营业收入与EBITDA构成
图:2014年享兹曼营业收入(分应用领域)构成
图:享兹曼钛白粉业务发展计划
图:享兹曼在华钛白粉业务布局
表:2009-2014年Kronos在欧洲和北美钛白粉市场份额
图:康诺斯生产基地全球分布
表:康诺斯全球钛白粉工厂及产能
表:2007-2015年Kronos钛白粉产销量
图:2014年康诺斯钛白粉销售结构(按销量)
图:2015年公司钛白粉产能结构预测
图:2007-2015年康诺斯营业收入与净利润
图:2012-2014年康诺斯营业收入构成
图:特诺全球业务分布
表:特诺钛白粉产品介绍(按应用领域)
表:Tronox全球钛白粉工厂及产能
图:2014年特诺钛白粉销量构成
图:2014年特诺主要产品产量
图:2009-2015年特诺营业收入与净利润
图:2012-2014年特诺营业收入和净利润构成(分业务)
表:2015年前三季度特诺营业收入构成(分业务)
图:2012-2014年特诺营业收入(分区域)构成
表:中国钛白粉主要消费领域对比
图:2015-2018年中国钛白粉产能及产量预测
图:2015-2018年中国钛白粉进口量预测
图:2015-2018年中国钛白粉消费量预测
图:2015-2018年中国钛白粉出口量预测
Classification of Titanium Dioxide
Sulphate-process Titanium Dioxide Production Process
Chloride-process Titanium Dioxide Production Process
Titanium Dioxide Industry Chain
Policies and Standards on Titanium Dioxide Industry in China, 2005-2015
Policies on Imports of Titanium Dioxide in China
Global Titanium Dioxide Capacity Structure by Production Process
Proportion of Chloride-process Titanium Dioxide Capacity of Major Global Titanium Dioxide Producers, 2015
Global Titanium Dioxide Capacity, 2004-2015
Global Titanium Dioxide Capacity Distribution, 2014
Global Titanium Dioxide Capacity Structure by Country, 2014
Integration Course of Global Titanium Dioxide Industry in the Past Twenty Years
Global Titanium Dioxide Market Share by Enterprises’ Capacity, 2015
Capacity of Major Global Titanium Dioxide Producers, 2015
Capacity Development of Chinese Titanium Dioxide Producers
Ongoing Titanium Dioxide Projects in China as of the End of Sept 2015
Titanium Dioxide Capacity and YoY Growth in China, 1999-2015
Titanium Dioxide Output in China, 1999-2015
Output of Rutile Titanium Dioxide and % of Total Titanium Dioxide Output in China, 2000-2015
Titanium Dioxide Output Structure in China, 2014
Titanium Dioxide Consumption in China, 1999-2015
Import Volume of Titanium Dioxide in China, 1999-2015
Export Volume of Titanium Dioxide in China, 1999-2015
Exports of Titanium Dioxide in China by Destination, Jan-Oct, 2015
Price Trend of Titanium Dioxide in China, 2010-2015
Gross Margin of Titanium Dioxide Products of Henan Billions Chemicals and Anhui Annada, 2009-2015
Titanium Dioxide Capacity Structure in China by Production Process, 2015
Production of Major Chloride-process Titanium Dioxide Producers in China as of Nov 2015
Capacity and Output of Chinese Titanium Dioxide Producers, 2014-2015
Ranking of Provinces in China by Titanium Dioxide Capacity, 2014
Net Income of Major Titanium Dioxide Producers in China, 2013-2015
China vs. the World: Titanium Processing Structure
Global Ilmenite Reserves by Country
Global Rutile Reserves by Country
Global Ilmenite Output, 2013-2014
Global Rutile Output, 2013-2014
Distribution of Titanium Ore Resources in China
China’s Imports of Titanium Ores and Concentrates, 2006-2015
China’s Sulfuric Acid Output, 2005-2015
Production Cost Structure of Titanium Dioxide Business of Jilin Gpro Titanium Industry, 2014
Global Titanium Dioxide Consumption Structure, 2015
China’s Titanium Dioxide Consumption Structure, 2015
China’s Coating Output, 2001-2015
Demand for Home-made Titanium Dioxide and Imported Titanium Dioxide from Coating Segments
China’s Output of Plastic Products, 2005-2015
China’s Output of Machine-made Paper and Paperboard, 2005-2015
China’s Output of Nano Titanium Dioxide, 2011-2015
Holding and Joint-stock Companies of Shandong DOGUIDE Group
Titanium Dioxide Capacity, Output, and Sales Volume of Shandong DOGUIDE Group, 2007-2014
IPO Course of Shandong DOGUIDE Group
Product Line of Henan Billions Chemicals
Product Capacity of Henan Billions Chemicals
Henan Billions Chemicals’ Titanium Dioxide Products
Titanium Dioxide Output, Sales Volume and Inventory of Henan Billions Chemicals, 2010-2015
Revenue and Net Income of Henan Billions Chemicals, 2009-2015
Revenue Breakdown of Henan Billions Chemicals by Product, 2012-2015
Revenue Structure of Henan Billions Chemicals by Region, 2008-2015
Gross Margin of Henan Billions Chemicals by Product, 2012-2015
R&D Costs and % of Total Revenue of Henan Billions Chemicals, 2009-2015
Key Ongoing Projects of Henan Billions Chemicals
Progress of 60,000t Chloride-process Titanium Dioxide Project of Henan Billions Chemicals
Equity Structure of Henan Billions Chemicals before and after Acquisition of Sichuan Lomon Titanium Industry Co., Ltd
Holding and Joint-stock Companies of Sichuan Lomon Titanium Industry Co., Ltd
Revenue and Net Income of Henan Billions Chemicals, 2015-2018E
Titanium Dioxide Output of CNNC Hua Yuan Titanium Dioxide, 2007-2015
Titanium Dioxide Output, Sales Volume, and Inventory of CNNC Hua Yuan Titanium Dioxide, 2012-2014
Revenue and Net Income of CNNC Hua Yuan Titanium Dioxide, 2009-2015
Revenue Structure of CNNC Hua Yuan Titanium Dioxide by Product, 2012-2015
Revenue Structure of CNNC Hua Yuan Titanium Dioxide by Region, 2012-2015
Gross Margin of CNNC Hua Yuan Titanium Dioxide, 2012-2015
R&D Costs and % of Total Revenue of CNNC Hua Yuan Titanium Dioxide, 2012-2015
Major Projects of CNNC Hua Yuan Titanium Dioxide
Revenue and Net Income of CNNC Hua Yuan Titanium Dioxide, 2015-2018E
Revenue and Net Income of Jilin Gpro Titanium Industry, 2011-2015
Revenue Structure of Jilin Gpro Titanium Industry by Product, 2012-2015
Revenue Structure of Jilin Gpro Titanium Industry by Region, 2012-2015
Gross Margin of Jilin Gpro Titanium Industry’s Main Products, 2012-2015
R&D Costs and % of Total Revenue of Jilin Gpro Titanium Industry, 2012-2015
Major Projects of Jilin Gpro Titanium Industry
Jilin Gpro Titanium Industry’s Investment with Proposed Funds Raised via Private Placement
Revenue and Net Income of Jilin Gpro Titanium Industry, 2015-2018E
Titanium Dioxide Output, Sales Volume, and Inventory of Anhui Annada Titanium Industry, 2011-2015
Revenue and Net Income of Anhui Annada Titanium Industry, 2009-2015
Revenue Structure of Anhui Annada Titanium Industry by Product, 2009-2015
Revenue Structure of Anhui Annada Titanium Industry by Product, 2015H1
Revenue Structure of Anhui Annada Titanium Industry by Region, 2009-2015
Gross Margin of Anhui Annada Titanium Industry, 2009-2013
Gross Margin of Anhui Annada Titanium Industry, 2014-2015
R&D Costs and % of Total Revenue of Anhui Annada Titanium Industry, 2009-2015
Revenue and Net Income of Anhui Annada Titanium Industry, 2015-2018E
Industrial Distribution of Sichuan Lomon Group
Titanium Dioxide Capacity and Output of Sichuan Lomon, 2007-2015
Main Financial Indexes of Sichuan Lomon Titanium Industry, 2013-2014
Titanium Dioxide Output, Sales Volume, and Inventory of Pangang Group Vanadium Titanium & Resources, 2011-2015
Titanium Dioxide Business Revenue of Pangang Group Vanadium Titanium & Resources, 2011-2015
Revenue and Net Income of Pangang Group Vanadium Titanium & Resources, 2009-2015
Revenue Structure of Pangang Group Vanadium Titanium & Resources by Product, 2012-2015
Revenue Structure of Pangang Group Vanadium Titanium & Resources by Region, 2010-2015
Gross Margin of Pangang Group Vanadium Titanium & Resources’ Main Products, 2011-2015
R&D Costs and % of Total Revenue of Pangang Group Vanadium Titanium & Resources, 2012-2015
Titanium Dioxide Projects of Pangang Group Vanadium Titanium & Resources
Equity Structure of Pangang Group Vanadium Titanium & Resources before Spin-off of Karara
Equity Structure of Pangang Group Vanadium Titanium & Resources after Spin-off of Karara
Main Operational Targets of Karara Mining, 2013-2015
Revenue and Net Income of Pangang Group Vanadium Titanium & Resources, 2015-2018E
Development Course of Yunnan Dahutong Industry & Trading
Sales Network of Yunnan Dahutong Industry & Trading in China
Global Sales Network of Yunnan Dahutong Industry & Trading
Marketing Network of Shandong DAWN Titanium Industry
Profile of Guangxi Jinmao Titanium
Product Capacity of Guangxi Jinmao Titanium
Sales Network of Guangxi Jinmao Titanium in China
Overseas Sales Network of Guangxi Jinmao Titanium
Sales Offices of Guangxi Jinmao Titanium
Global Presence of Chemours
Major Product Brands of Chemours
Titanium Dioxide Business of Chemours
Revenue and EBITDA of Chemours by Business, 2012-2015
Assets of Chemours by Business, 2012-2014
Revenue Structure of Chemours by Region, Q1-Q3, 2015
Equity Structure of Cristal
Global Presence of Cristal
Global Presence of Huntsman
Titanium Dioxide Revenue Structure of Huntsman, 2015
Titanium Dioxide Revenue of Huntsman, 2009-2015
Revenue and Net Income of Huntsman, 2010-2015
Revenue and EBITDA of Huntsman, 2014-2015
Revenue Structure of Huntsman by Application, 2014
Huntsman’s Development Planning for Titanium Dioxide Business
Huntsman’s Titanium Dioxide Business Layout in China
Global Production Bases of Kronos
Titanium Dioxide Plants and Capacity of Kronos Worldwide
Titanium Dioxide Output and Sales Volume of Kronos, 2007-2015
Titanium Dioxide Sales Structure of Kronos by Sales Volume, 2014
Titanium Dioxide Capacity Structure of Kronos, 2015E
Revenue and Net Income of Kronos, 2007-2015
Revenue Structure of Kronos, 2012-2014
Global Presence of Tronox
Titanium Dioxide Products of Tronox by Application
Titanium Dioxide Plants and Capacity of Tronox Worldwide
Titanium Dioxide Sales Volume Structure of Tronox, 2014
Output of Tronox’s Main Products, 2014
Revenue and Net Income of Tronox, 2009-2015
Revenue and Net Income of Tronox by Business, 2011-2014
Revenue Structure of Tronox by Business, 1Q-3Q2015
Revenue Structure of Tronox by Region, 2012-2014
Main Applications of Titanium Dioxide in China
Titanium Dioxide Capacity and Output in China, 2015-2018E
China’s Titanium Dioxide Imports, 2015-2018E
China’s Consumption of Titanium Dioxide, 2015-2018E
China’s Titanium Dioxide Exports, 2015-2018E
如果这份报告不能满足您的要求,我们还可以为您定制报告,请 留言说明您的详细需求。
|