|
|
|
报告导航:研究报告—
TMT产业—电信
|
|
2015-2018年全球及中国射频同轴电缆行业研究报告 |
 |
字数:2.4万 |
页数:107 |
图表数:126 |
|
中文电子版:8500元 |
中文纸版:4250元 |
中文(电子+纸)版:9000元 |
|
|
|
|
|
编号:CYH043
|
发布日期:2015-12 |
附件:下载 |
 |
|
|
射频同轴电缆是无线电射频频率范围内传输电信号或能量的同轴电缆的总称。主要应用于通信设备、通信终端、航空航天、军用电子等行业。
受移动通信行业快速发展拉动,全球射频同轴电缆的市场规模不断增长,2014年约为47.1亿美元,同比增长9.8%。预计2015年全球射频同轴电缆市场规模将达到51.4亿美元。
近年来,中国移动通信产业也在加速升级。2010年工信部发放了3G牌照,2013年底又发放了TD-LTE制式的4G牌照和FDD-LTE制式的试验牌照,2015年2月FDD-LTE牌照正式落地。受此拉动,2015年中国射频同轴电缆市场规模预计可达521.8亿元,同比增长16.7%,高于同期全球增速。
根据工信部计划,到2018年中国4G网络全面覆盖城市和乡村,80%以上的行政村实现光纤到村。届时,中国4G用户将达到4.6亿,射频同轴电缆市场规模有望达到854亿元。
细分产品中,CATV电缆和半柔电缆是中国主要射频同轴电缆产品,2014年其产量占比分别为73.6%和11.0%。但受电信IPTV和OTT业务的挑战,有线电视将逐步被数字电视、网络电视、移动电视等取代,CATV电缆规模将逐年下滑。而受4G市场天线总量增多拉动,半柔电缆市场规模将快速增长,未来有望成为中国射频同轴电缆主导产品之一。
企业方面,中国射频同轴电缆行业的高端产品市场如低损、稳相和微细等领域主要被外资厂商占据;中国本土厂商当前主要占据在半柔电缆、轧纹电缆等中低端产品市场。目前中国本土具备规模实力的厂商有亨鑫科技、汉胜电缆、金信诺、俊知集团、中天科技、盛洋科技等。
金信诺:中国第一大半柔电缆生产商,2014年射频同轴电缆实现销量达33.31万公里,较2013年增长4倍。2015年公司通过并购PC Specialties-China,LLC、东莞瀚宇电子等进一步延伸其产业链。
盛洋科技:中国主要75欧姆射频同轴电缆生产企业,产能达42万公里/年,目前公司80%收入来自海外市场。2015年公司正在建设3G及4G移动通信用50欧姆射频同轴电缆生产线项目,投产后将新增产能1.5万公里/年。
水清木华研究中心《2015-2018年全球及中国射频同轴电缆行业研究报告》着重研究了以下内容:
 全球射频同轴电缆市场规模及发展情况; 全球射频同轴电缆市场规模及发展情况;
中国射频同轴电缆市场规模、市场需求、产品结构、企业竞争等发展情况;
中国半柔电缆、低损电缆、轧纹电缆、稳相电缆、漏泄电缆等细分市场发展情况;
全球9家射频同轴电缆企业经营情况及在华发展等;
中国9家射频同轴电缆企业经营情况及发展战略等。
RF coaxial cable, a general term for coaxial cables that transmit electrical signal or energy within radio frequency range, is mainly used in communications equipment, communications terminals, aerospace, and military electronics.
Driven by fast-growing mobile communications industry, global RF coaxial cable market size continues to expand, approximating USD4.71 billion in 2014, up 9.8% from a year ago, and is expected to reach USD5.14 billion in 2015.
The upgrading of mobile communications industry in China has paced up in recent years. The Ministry of Industry and Information Technology (MIIT) issued 3G license in 2010 and TD-LTE 4G license and FDD-LTE trial license at the end of 2013. FDD-LTE license was officially granted in Feb 2015. Buoyed by this, the Chinese RF coaxial cable market is expected to hit RMB52.18 billion in 2015, a year-on-year growth of 16.7%, higher than the global growth pace during the same period.
According to the plan of MIIT, by 2018 all cities and rural areas will be covered by 4G network and more than 80% of administrative village will gain access to optical fiber. By then China’s 4G users will total 460 million and the country’s RF coaxial cable market is expected to hit RMB85.4 billion.
CATV cable and semi-flexible cable are main RF coaxial cable products in China, accounting for 73.6% and 11.0% of the country’s total RF coaxial cable output in 2014, respectively. However, challenged by China Telecom’s IPTV and OTT, cable TV will be gradually replaced by digital TV, network TV, and mobile TV, and CATV cable market size will shrink year after year. Thanks to a rise in total quantity of antennas in 4G market, semi-flexible cable market size will grow rapidly and be expected to become one of mainstay RF coaxial cable products.
High-end products (low loss/phase-compensated/micro cable) market in RF coaxial cable industry in China is chiefly dominated by foreign players, while local Chinese companies operate mainly in mid- and low-end products (semi-flexible cable and corrugated cable) market. Large domestic Chinese producers include Hengxin Technology, Hansen Technology, Kingsignal Technology, Trigiant Group, Jiangsu Zhongtian Technology, Zhejiang Shengyang Science and Technology, etc.
Kingsignal Technology: China’s largest semi-flexible cable producer. The company sold 333,100km of RF coaxial cable in 2014, increasing by fourfold over the year-ago period. It extended its industry chain in 2015 by acquiring PC Specialties-China, L.L.C. and Dongguan HannStar Electronics.
Zhejiang Shengyang Science and Technology: a major producer of 75Ω RF coaxial cable in China with capacity of 420,000km/a. 80% of its revenue comes from overseas markets. The company is building the project of 50Ω RF coaxial cable for 3G and 4G mobile communications in 2015, and will see new capacity of 15,000km/a after the project goes into production.
Global and China RF Coaxial Cable Industry Report, 2015-2018 highlights the followings:
 Global RF coaxial cable market size and development; Global RF coaxial cable market size and development;
Chinese RF coaxial cable market size, market demand, product structure, competition among enterprises, etc.;
Development of market segments (semi-flexible cable, low loss cable, corrugated cable, phase-compensated cable, and leaky cable) in China;
Operation and development in China of nine global RF coaxial cable companies;
Operation and development strategy of nine Chinese RF coaxial cable companies.
第一章 行业概述
1.1 定义及分类
1.1.1 定义
1.1.2 分类
1.2 产业链
第二章 射频同轴电缆市场分析
2.1 全球市场概况
2.2 中国市场分析
2.2.1 市场概况
2.2.2 市场规模
2.2.3 需求
2.2.4 产品结构
2.2.5 市场竞争特点
第三章 细分市场
3.1 半柔电缆
3.1.1 市场需求
3.1.2 竞争格局
3.2 低损电缆
3.2.1 市场需求
3.2.2 竞争格局
3.3 轧纹电缆
3.3.1 市场需求
3.3.2 竞争格局
3.4 稳相电缆
3.4.1 市场需求
3.4.2 竞争格局
3.5 微细与极细同轴电缆
3.5.1 市场需求
3.5.2 竞争格局
3.6 漏泄电缆
第四章 全球主要射频同轴电缆企业
4.1 百通
4.1.1 企业简介
4.1.2 经营情况
4.1.3 营收构成
4.1.5 在华业务
4.2 戈尔
4.3 哈博
4.3.1 企业简介
4.3.2 经营情况
4.3.3 营收构成
4.3.4 在华业务
4.4 安费诺
4.4.1 企业简介
4.4.2 经营情况
4.4.3 营收构成
4.4.4 在华业务
4.4.5 安诺费时代微波
4.5 日本住友(Sumitomo)
4.5.1 企业简介
4.5.2 经营情况
4.5.3 营收构成
4.5.4 在华发展
4.6 康普
4.6.1 企业简介
4.6.2 经营情况
4.6.3 营收构成
4.6.4 安德鲁
4.7 耐克森
4.7.1 公司简介
4.7.2 经营情况
4.7.3 营收构成
4.7.4 在华业务
4.8 灏讯
4.8.1 企业简介
4.8.2 经营情况
4.8.3 营收构成
4.8.3 在华业务
4.9 日立金属(Hitachi)
4.9.1 企业简介
4.9.2 经营情况
4.9.3 营收构成
4.9.4 电缆相关业务
4.9.5 在华发展
第五章 中国主要射频同轴电缆企业
5.1深圳金信诺高新技术股份有限公司
5.1.1 企业简介
5.1.2 经营情况
5.1.3 营收构成
5.1.4 毛利率
5.1.5 客户与供应商
5.1.6 射频同轴电缆业务
5.1.7 发展前景
5.2 江苏亨鑫科技有限公司
5.2.1 企业简介
5.2.2 经营情况
5.2.3 营收构成
5.2.4 毛利率
5.2.5 客户及供应商
5.2.6 射频同轴电缆业务
5.3 俊知集团
5.3.1 企业简介
5.3.2 经营情况
5.3.3 营收构成
5.3.4 毛利率
5.3.5 客户与供应商
5.3.6 射频同轴电缆业务
5.4 浙江盛洋科技股份有限公司
5.4.1 企业简介
5.4.2 经营情况
5.4.3 营收构成
5.4.4 毛利率
5.4.5 客户与供应商
5.4.6 射频同轴电缆业务
5.5 中天日立射频电缆有限公司
5.5.1 企业简介
5.5.2 经营情况
5.5.3 射频同轴电缆业务
5.6 成都中菱无线通信电缆有限公司
5.6.1 企业简介
5.6.2 经营情况
5.7 珠海汉胜科技股份有限公司
5.7.1 企业简介
5.7.2 经营情况
5.8 其他企业
5.8.1 新泰爱克电缆有限公司
5.8.2 天津609电缆有限公司
第六章 总结与预测
6.1 总结
6.2 预测
1 Industry Overview
1.1 Definition and Classification
1.1.1 Definition
1.1.2 Classification
1.2 Industry Chain
2 RF Coaxial Cable Market
2.1 Global
2.2 China
2.2.1 Market Overview
2.2.2 Market Size
2.2.3 Demand
2.2.4 Product Structure
2.2.5 Characteristics of Market Competition
3 Market Segments
3.1 Semi-flexible Cable
3.1.1 Market Demand
3.1.2 Competitive Landscape
3.2 Low Loss Cable
3.2.1 Market Demand
3.2.2 Competitive Landscape
3.3 Corrugated Cable
3.3.1 Market Demand
3.3.2 Competitive Landscape
3.4 Phase-compensated Cable
3.4.1 Market Demand
3.4.2 Competitive Landscape
3.5 Micro Coaxial Cable
3.5.1 Market Demand
3.5.2 Competitive Landscape
3.6 Leaky Cable
4 Major Global RF Coaxial Cable Companies
4.1 Belden
4.1.1 Profile
4.1.2 Operation
4.1.3 Revenue Structure
4.1.5 Business in China
4.2 Gore
4.3 Habia
4.3.1 Profile
4.3.2 Operation
4.3.3 Revenue Structure
4.3.4 Business in China
4.4 Amphenol
4.4.1 Profile
4.4.2 Operation
4.4.3 Revenue Structure
4.4.4 Business in China
4.4.5 Amphenol Times Microwave
4.5 Sumitomo
4.5.1 Profile
4.5.2 Operation
4.5.3 Revenue Structure
4.5.4 Business in China
4.6 CommScope
4.6.1 Profile
4.6.2 Operation
4.6.3 Revenue Structure
4.6.4 Andrew
4.7 Nexans
4.7.1 Profile
4.7.2 Operation
4.7.3 Revenue Structure
4.7.4 Business in China
4.8 HUBER+SUHNER
4.8.1 Profile
4.8.2 Operation
4.8.3 Revenue Structure
4.8.3 Business in China
4.9 Hitachi Metals
4.9.1 Profile
4.9.2 Operation
4.9.3 Revenue Structure
4.9.4 Cable-related Business
4.9.5 Business in China
5 Major Chinese RF Coaxial Cable Companies
5.1 Kingsignal Technology Co., Ltd.
5.1.1 Profile
5.1.2 Operation
5.1.3 Revenue Structure
5.1.4 Gross Margin
5.1.5 Customers and Suppliers
5.1.6 RF Coaxial Cable Business
5.1.7 Development Prospects
5.2 Jiangsu Hengxin Technology Co., Ltd.
5.2.1 Profile
5.2.2 Operation
5.2.3 Revenue Structure
5.2.4 Gross Margin
5.2.5 Customers and Suppliers
5.2.6 RF Coaxial Cable Business
5.3 Trigiant Group
5.3.1 Profile
5.3.2 Operation
5.3.3 Revenue Structure
5.3.4 Gross Margin
5.3.5 Customers and Suppliers
5.3.6 RF Coaxial Cable Business
5.4 Zhejiang Shengyang Science and Technology Co., Ltd.
5.4.1 Profile
5.4.2 Operation
5.4.3 Revenue Structure
5.4.4 Gross Margin
5.4.5 Customers and Suppliers
5.4.6 RF Coaxial Cable Business
5.5 Zhongtian Hitachi RF Cable Co., Ltd.
5.5.1 Profile
5.5.2 Operation
5.5.3 RF Coaxial Cable Business
5.6 Chengdu Zhongling Radio Communications Co., Ltd.
5.6.1 Profile
5.6.2 Operation
5.7 Zhuhai Hansen Technology Co., Ltd.
5.7.1 Profile
5.7.2 Operation
5.8 Others
5.8.1 Acome Xintai Cables Co., Ltd.
5.8.2 Tianjin 609 Cable Co., Ltd.
6 Summary and Forecast
6.1 Summary
6.2 Forecast
图:射频同轴电缆结构图
表 :射频同轴电缆分类
图:2007-2015年全球射频同轴电缆市场规模
图:2012-2018年全球射频75Ω同轴电缆市场容量
图:2006-2015年全球2G用射频同轴电缆市场规模
图:2006-2015年全球3G用射频同轴电缆市场规模
图:2006-2015年印度射频同轴电缆需求量
图:2006-2015年巴西射频同轴电缆需求量
图:2006-2015年俄罗斯射频同轴电缆需求量
图:2007-2015年中国射频同轴电缆市场容量
表:2011-2014年中国射频同轴电缆销售收入及进出口情况
图:2011 -2015年中国移动通信用射频同轴电缆产量及需求量
图:2007-2015年中国手机及笔记本电脑产品射频同轴电缆需求规模
表:2014年中国射频同轴电缆(分产品)产量及产值
图:2007-2015年全球移动通信半柔电缆市场容量
图:2007-2015年中国移动通信半柔电缆市场容量
图:2015年中国半柔电缆市场主要企业市场份额
表:2015年中国主要半柔电缆生产企业产能
图:2007-2015年全球低损电缆市场容量
图:2007-2015年中国低损电缆市场容量
图:2015年中国低损电缆主要企业市场份额
图:2007-2015年中国轧纹电缆市场容量
图:2015年中国轧纹电缆主要企业市场份额
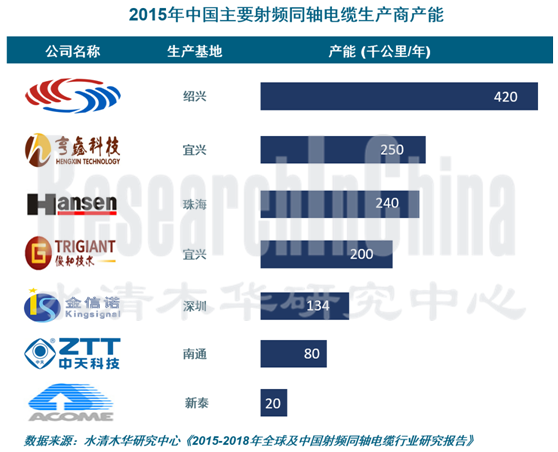
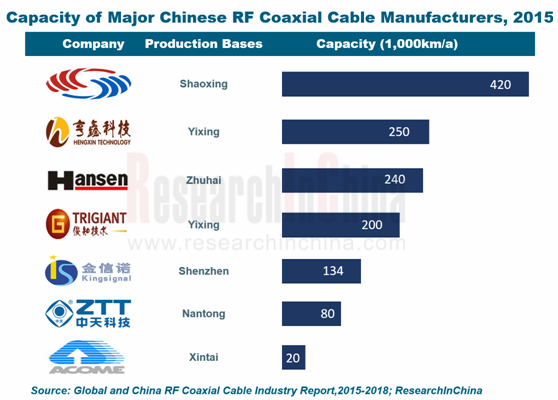
表:2015年中国主要轧纹电缆生产商产能
图 :2007-2015年全球稳相电缆市场容量
图:2007-2015年中国稳相电缆市场容量
图:2015年全球稳相电缆主要企业市场份额
图:2007-2015年全球微细同轴传输器件市场容量
图:2011-2015年中国移动通信终端用微细同轴电缆市场容量
图:2015年中国微细同轴电缆主要企业市场份额
表:2011-2020年中国漏泄电缆市场用量
图:2005-2015年Belden业务变革
图:2015年Belden五大业务解决方案
图:2014年Belden五大业务发展情况
图:2009-2015年百通营业收入及营业利润
图:2005-2014年Belden毛利率
表:截至2014年底Belden(分业务/分地区)工厂分布
图:2011-2015年百通(分产品)营业收入构成
图:2015年第三季度百通(分业务)收入及毛利率
图 :2011-2014年百通(分地区)营收占比
图:2011-2014年Belden在中国收入及同比增长
表:百通在华子公司
表:戈尔同轴和微波/射频电缆产品
表 :戈尔公司在华机构
图:2009-2015年哈博净收入及净利润
图:2009-2014年哈博公司营业利润率
图 :2013年哈博电缆产品(分行业)营收占比
图 :2013年哈博(分地区)营收占比
图:2009-2015年安费诺净收入及净利润
图: 2011-2015年安费诺(分产品)营收构成
图:2011-2014年安费诺(分地区)营收构成
图:2011-2014年安费诺在中国收入及同比增长
图:截至2015年3月底日本住友(分地区)子公司及工厂数量
图:2017年日本住友发展规划
图:2010-2015财年日本住友净销售额及净利润
图:2008-2015财年日本住友在日本以外地区销售额及占比
图:2014财年日本住友(分业务)净销售额及构成
图:2013-2015财年日本住友Automotive业务(分产品)销售额
图:2013-2015财年日本住友infocommunications业务(分产品)销售额
图:2013-2015财年日本住友Electronics(分产品)销售额
图:2013-2015财年日本住友Environment and Energy业务(分产品)销售额
图:2013-2015财年日本住友Industrial Materials and Others业务(分产品)销售额
图:2014财年日本住友(分国家/地区)销售额构成
图:2011-2014财年日本住友在中国销售额
图:日本住友在华子公司业务及分布
图:康普发展历程
图:2012-2015年康普(分业务)主营业务收入构成
图:2015年康普公司wireless业务
图:2012-2014年康普(分地区)营业收入构成
图:2014年耐克森业务
图:2009-2015年耐克森营业收入及净利润
图:2013-2015年耐克森(分业务)营收构成
图:2014年耐克森(分业务)营业收入
图:2015年耐克森(分地区)营收构成
图:耐克森在中国分布
表:耐克森在中国发展历程
图:2015年Huber+Suhner公司全球分布
图:2015上半年Huber+Suhner业务发展三维图
图:2009-2015年Huber+Suhner公司营业收入及净利润
图:2009-2014年Huber+Suhner在手订单
图 :2013-2015年Huber+Suhner(分产品)营收构成
图 :2013-2015年Huber+Suhner(分产品)在手订单占比
图:2014-2015年Huber+Suhner(分产品)营业收入及同比增长
图:2014-2015年Huber+Suhner(分市场)营业收入构成
图:2014-2015年Huber+Suhner(分地区)营收构成
图:2012-2015财年日本日立金属净销售额与净利润
图:2014-2015财年日本日立金属(分业务)销售额构成
图:2015财年日立金属各地区分业务销售额构成
图:2015年日本日立电缆相关业务
图:日本日立电缆相关业务生产基地及公司分布
图:2009-2015年金信诺营业收入及净利润
图:2009-2014年金信诺(分地区)营业收入构成
图:2009-2015年金信诺(分产品)主营业务收入构成
图:2009-2015年金信诺(分产品)毛利率
图:2009-2015年金信诺前五名供应商合计采购金额及占比
图:2008-2015年金信诺前五名客户合计营业收入及占比
图:2009-2014年金信诺射频同轴电缆销量
图:2009-2014年金信诺主要射频同轴电缆产品收入
图:2014-2018年金信诺营业收入与净利润
图:2009-2015年亨鑫科技营业收入及净利润
图:2009-2015年亨鑫科技(分产品)营业收入构成
图:2013-2015年亨鑫科技(分地区)营业收入构成
图:2009-2015年金信诺毛利率及净利率
图:2009-2014年亨鑫科技前五名客户合计营收占比
图:2010-2014年亨鑫科技前五名供应商合计采购金额占比
图:2013-2015年亨鑫科技射频同轴电缆业务收入
图:2009-2015年俊知集团营业收入及净利润
图:2010-2015年俊知集团(分产品)营业收入构成
图:2010-2015年俊知集团(分产品)毛利率
图:2010-2014年俊知集团前五名客户合计营收占比
图:2010-2014年俊知集团前五名供应商合计采购金额占比
表:2009-2014年俊知集团射频同轴电缆销量
表:2009-2015年俊知集团射频同轴电缆产能
图:2012-2015年盛洋科技营业收入与净利润
图:2012-2015年盛洋科技(分产品)主营业务收入构成
表:2012-2015年盛洋科技(分地区)主营业务收入构成
图:2012-2015年盛洋科技(分产品)毛利率
图:2012-2014年盛洋科技前五名客户营业收入及占比
图:2012-2014年盛洋科技前五名供应商合计采购金额及占比
表:2012-2014年盛洋科技射频同轴电缆(分产品)产销量与产销率
图:2009-2015年中天日立射频营业收入及净利润
图:2012-2014年中天日立射频产品产销量
图:2009-2015年中天日立射频产品毛利率
图:2013-2015年中菱无线营业收入与净利润
表:2014-2015年中国主要射频同轴电缆生产商产能、销量及营业收入
图:2013-2018年中国射频同轴电缆市场规模
Structure of RF Coaxial Cable
Classification of RF Coaxial Cable
Global RF Coaxial Cable Market Size, 2007-2015
Global RF 75Ω Coaxial Cable Market Capacity, 2012-2018E
Global Market Size of RF Coaxial Cable for 2G Network, 2006-2015
Global Market Size of RF Coaxial Cable for 3G Network, 2006-2015
India’s Demand for RF Coaxial Cable, 2006-2015
Brazil’s Demand for RF Coaxial Cable, 2006-2015
Russia’s Demand for RF Coaxial Cable, 2006-2015
Chinese RF Coaxial Cable Market Capacity, 2007-2015
RF Coaxial Cable Sales and Import & Export in China, 2011-2014
Output of and Demand for RF Coaxial Cable for Mobile Communications in China, 2011-2015
China’s Demand for RF Coaxial Cable for Mobile Phone and Notebook PC, 2007-2015
RF Coaxial Cable Output and Output Value in China by Product, 2014
Global Market Capacity of Semi-flexible Cable for Mobile Communications, 2007-2015
Market Capacity of Semi-flexible Cable for Mobile Communications in China, 2007-2015
Market Share of Major Semi-flexible Cable Companies in China, 2015
Capacity of Major Semi-flexible Cable Companies in China, 2015
Global Low Loss Cable Market Capacity, 2007-2015
Chinese Low Loss Cable Market Capacity, 2007-2015
Market Share of Major Low Loss Cable Companies in China, 2015
Chinese Corrugated Cable Market Capacity, 2007-2015
Market Share of Major Corrugated Cable Companies in China, 2015
Capacity of Major Corrugated Cable Companies in China, 2015
Global Phase-compensated Cable Market Capacity, 2007-2015
Chinese Phase-compensated Cable Market Capacity, 2007-2015
Market Share of Major Global Phase-compensated Cable Companies, 2015
Global Micro Coaxial Transmission Device Market Capacity, 2007-2015
Chinese Market Capacity of Micro Coaxial Cable for Mobile Communication Terminal, 2011-2015
Market Share of Major Micro Coaxial Cable Companies in China, 2015
Chinese Leaky Cable Market Capacity, 2011-2020E
Business Changes of Belden, 2005-2015
Five Business Solutions of Belden, 2015
Development of Belden’s Five Businesses, 2014
Revenue and Operating Profit of Belden, 2009-2015
Gross Margin of Belden, 2005-2014
Factories of Belden by Business/Region as of the End of 2014
Revenue Structure of Belden by Product, 2011-2015
Revenue and Gross Margin of Belden by Business, 2015Q3
Revenue Structure of Belden by Region, 2011-2014
Belden’s Revenue in China and YoY Growth, 2011-2014
Belden’s Subsidiaries in China
Coaxial and Microwave/RF Cable Products of Gore
Gore’s Organizations in China
Net Revenue and Net Income of Habia, 2009-2015
Operating Margin of Habia, 2009-2014
Cable Revenue Structure of Habia by Sector, 2013
Revenue Structure of Habia by Region, 2013
Net Revenue and Net Income of Amphenol, 2009-2015
Revenue Structure of Amphenol by Product, 2011-2015
Revenue Structure of Amphenol by Region, 2011-2014
Amphenol’s Revenue in China and YoY Growth, 2011-2014
Number of Subsidiaries and Plants of Sumitomo by Region by the end of Mar 2015
Development Planning of Sumitomo, 2017
Net Sales and Net Income of Sumitomo, FY2010-FY2015
Sumitomo’s Sales from Regions outside Japan and Proportion, FY2008-FY2015
Net Sales of Sumitomo by Business, FY2014
Sumitomo’s Sales from Automotive Business by Product, FY2013-FY2015
Sumitomo’s Sales from Infocommunications Business by Product, FY2013-FY2015
Sumitomo’s Sales from Electronics Business by Product, FY2013-FY2015
Sumitomo’s Sales from Environment and Energy Business by Product, FY2013-FY2015
Sumitomo’s Sales from Industrial Materials and Others Business by Product, FY2013-FY2015
Sales Structure of Sumitomo by Country/Region, FY2014
Sumitomo’s Sales in China, FY2011-FY2014
Business Presence of Sumitomo’s Subsidiaries in China
Development Course of CommScope
Operating Revenue Structure of CommScope by Business, 2012-2015
Wireless Solutions of CommScope, 2015
Revenue Structure of CommScope by Region, 2012-2014
Business of Nexans, 2014
Revenue and Net Income of Nexans, 2009-2015
Revenue Structure of Nexans by Business, 2013-2015
Revenue Breakdown of Nexans by Business, 2014
Revenue Structure of Nexans by Region, 2015
Nexans’ Presence in China
Nexans’ Development in China
Global Presence of HUBER+SUHNER, 2015
3D Diagram for Business Development of HUBER+SUHNER, 2015H1
Revenue and Net Income of HUBER+SUHNER, 2009-2015
Order Intake of HUBER+SUHNER, 2009-2014
Revenue Structure of HUBER+SUHNER by Product, 2013-2015
Order Intake Structure of HUBER+SUHNER by Product, 2013-2015
Revenue and YoY Growth of HUBER+SUHNER by Product, 2014-2015
Revenue Structure of HUBER+SUHNER by Market, 2014-2015
Revenue Breakdown of HUBER+SUHNER by Market, 2014-2015
Net Sales and Net Income of Hitachi Metals, FY2012-FY2015
Sales Structure of Hitachi Metals by Business, FY2014-FY2015
Sales Structure of Hitachi Metals in Different Regions by Business, FY2015
Cable-related Business of Hitachi Metals, 2015
Hitachi Metals’ Production Bases and Companies that Get Involved in Cable-related Business
Revenue and Net Income of Kingsignal, 2009-2015
Revenue Structure of Kingsignal by Region, 2009-2014
Operating Revenue Structure of Kingsignal by Product, 2009-2015
Gross Margin of Kingsignal by Product, 2009-2015
Kingsignal’s Procurement from Top5 Suppliers and % of Total Procurement, 2009-2015
Kingsignal’s Revenue from Top5 Customers and % of Total Revenue, 2008-2015
RF Coaxial Cable Sales Volume of Kingsignal, 2009-2014
Kingsignal’s Revenue from Main RF Coaxial Cable Products, 2009-2014
Revenue and Net Income of Kingsignal, 2014-2018E
Revenue and Net Income of Hengxin Technology, 2009-2015
Revenue Structure of Hengxin Technology by Product, 2009-2015
Revenue Structure of Hengxin Technology by Region, 2013-2015
Gross Margin and Net Profit Margin of Hengxin Technology, 2009-2015
Hengxin Technology’s Revenue Percentage from Top5 Customers, 2009-2014
Hengxin Technology’s Procurement Percentage from Top5 Suppliers, 2010-2014
RF Coaxial Cable Revenue of Hengxin Technology, 2013-2015
Revenue and Net Income of Trigiant Group, 2009-2015
Revenue Structure of Trigiant Group by Product, 2010-2015
Gross Margin of Trigiant Group by Product, 2010-2015
Trigiant Group’s Revenue Percentage from Top5 Customers, 2010-2014
Trigiant Group’s Procurement Percentage from Top5 Suppliers, 2010-2014
RF Coaxial Cable Sales Volume of Trigiant Group, 2009-2014
RF Coaxial Cable Capacity of Trigiant Group, 2009-2015
Revenue and Net Income of Shengyang Science and Technology, 2012-2015
Operating Revenue Structure of Shengyang Science and Technology by Product, 2012-2015
Operating Revenue Structure of Shengyang Science and Technology by Region, 2012-2015
Gross Margin of Shengyang Science and Technology by Product, 2012-2015
Shengyang Science and Technology’s Revenue from top 5 Customers and % of Total Revenue, 2012-2014
Shengyang Science and Technology’s Procurement from Top5 Suppliers and % of Total Procurement, 2012-2014
RF Coaxial Cable Output and Sales Volume and Sales/Output Ratio of Shengyang Science and Technology, 2012-2014
Revenue and Net Income of Zhongtian Hitachi RF Cable, 2009-2015
Output and Sales Volume of Zhongtian Hitachi RF Cable, 2012-2014
Gross Margin of Zhongtian Hitachi RF Cable, 2009-2015
Revenue and Net Income of Zhongling Radio Communications, 2013-2015
Capacity, Sales Volume, and Revenue of Major RF Coaxial Cable Producers in China, 2014-2015
Chinese RF Coaxial Cable Market Size, 2013-2018E
如果这份报告不能满足您的要求,我们还可以为您定制报告,请 留言说明您的详细需求。
|