|
|
|
报告导航:研究报告—
TMT产业—电子半导体
|
|
2015年全球及中国CMOS摄像模组(CCM)产业研究报告 |
 |
字数:2.7万 |
页数:201 |
图表数:227 |
|
中文电子版:9000元 |
中文纸版:4500元 |
中文(电子+纸)版:9500元 |
|
英文电子版:2600美元 |
英文纸版:0美元 |
英文(电子+纸)版:2900美元 |
|
编号:ZYW220
|
发布日期:2016-01 |
附件:下载 |
 |
|
|
《2015年全球及中国CMOS摄像模组(CCM)产业研究报告》包含以下内容:
1、CMOS摄像模组(CCM)简介
2、CMOS Image Sensor图像传感器市场与产业分析
3、光学镜头Lens产业与市场分析
4、CMOS摄像模组(CCM)技术趋势
5、7家CMOS Image Sensor研究
6、15家Lens厂家研究
7、23家CCM厂家研究
2015年全球CCM市场规模为162.47亿美元,比2014年增长3.8%,是自2010年以来最低的增速。预计2016年增速继续放缓,只有1.3%,2017年则略有反弹,增速为1.6%,市场规模为167.32亿美元。
增速放缓的原因有几点,首先是全球范围内通缩明显,日元、韩元和台币贬值明显。其次,手机市场增速放缓,几乎饱和,智能手机在2015年还能维持增长,2016年恐只能持平或已开始下滑。再次是竞争激烈,尤其中国大陆市场,尽管CCM像素持续升级,目前后(Rear)CCM以13M像素为主流,但是ASP并未提高,价格持续下滑。而随着越来越多的厂家进入有OIS或高性能AF的CCM领域,其价格大幅度下滑不可避免。
CMOS Image Sensor领域,预计2015年出货量为4196 million units,比2014年增长8.8%,而2014年增幅为11.5%,预计2016年为4390 million units,增幅4.6%,进一步放缓。预计2015年市场规模为91.6亿美元,比2014年增长4.6%,2014年增幅为10.7%,预计2016年增幅5.1%,达96.28亿美元。除On-Semi、索尼和夏普外,其余厂家全部下滑,索尼收购东芝的CMOS Image Sensor业务,将让索尼的霸主地位进一步稳固,在2016年继续高速增长,同时索尼性能第一的位置也更加稳固。On-Semi则是汽车用CMOS Image Sensor的霸主,市场占有率几乎为50%。On-Semi收购Aptina,整合非常顺利,加上车用摄像头市场爆发,On-Semi的CMOS Image Sensor业务飞速发展,预计2015年收入为7.2亿美元,汽车领域预计为4.0亿美元,汽车领域增幅超过100%。
Lens领域大立光电依然一枝独秀,继续高速增长,其余厂家几乎全部衰退,除了有车用Lens业务增长明显,但ASP很低,舜宇车用Lens继续保持全球第一的位置,夏普旗下的Kantatsu打进苹果供应链,业绩增长迅猛。
OIS领域,日系企业称雄,日本Alps和Mitsumi并列第一,都是苹果的主力供应商。Mitsumi还积极进军大陆市场,Mitsumi计划在未来两年投资250亿日元扩充产能,与Alps争夺全球第一的位置。
VCM领域,Bi-Direction和Close-Loop来势汹汹,日系厂家纷纷退出低端VCM领域,转攻OIS或Bi-Direction与Close-Loop,低端市场涌现出一大批大陆厂家,竞争异常激烈。
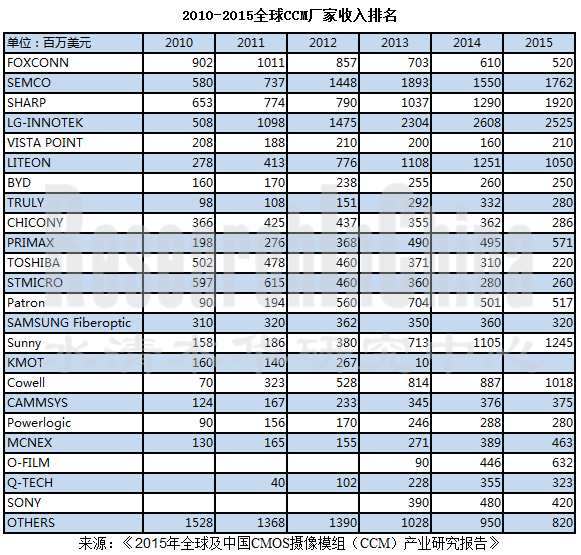
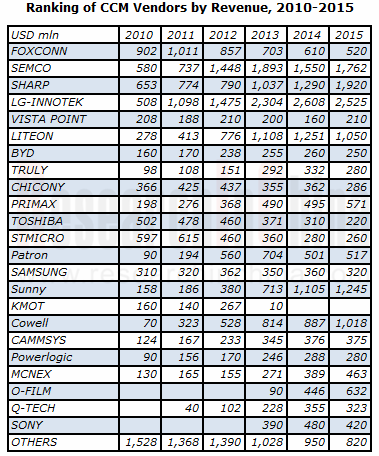
CCM领域竞争愈发激烈,大部分企业都陷入价格苦战中,市场集中度进一步提高,很多出货量增加,收入反而下滑,即使像素数提高也未能增加收入。表现最佳的夏普,夏普成为苹果的第二大供应商,苹果为了减少对LG-INNOTEK的依赖,将更多订单转移到夏普,但LG-INNOTEK依然是苹果第一大供应商,收入全球第一。苹果的第三大供应商,东莞Cowell也表现出色,是少见的毛利率提高的厂家。SEMCO也获得了来自三星的更多订单。大陆第一大厂家舜宇增长仍然强劲,但是毛利率已经无法提高,舜宇开始将重心更多地转向Lens领域,让企业的整体毛利率有所提高。LITEON则选择性地放弃了低端业务,同时大客户三星的订单也略有减少,导致其收入下滑明显。MCNEX则靠汽车领域,收入增加强劲。
Global and China CCM (CMOS Camera Module) Industry Report, 2015 highlights the followings:
1. Introduction to CMOS camera module (CCM)
2. CMOS Image Sensor (CIS) market and industry
3. Optical lens industry and market
4. Technological trends of CCM
5. 7 CIS vendors
6. 15 Lens vendors
7. 23 CCM vendors
Global CCM market size was worth USD16.247 billion in 2015, a year-on-year rise of 3.8% from 2014, the slowest rate since 2010. It is expected that growth rate will continue to decelerate in 2016, only 1.3%, but bounce back slightly to 1.6% in 2017 with a market size of USD16.732 billion.
There were several reasons for slowdown. First, the world was plagued by high deflation rates and currencies like Japanese yen, Korean won and NTD depreciated greatly. Second, the mobile phone market slowed and has become almost saturated. Smartphone market can still maintain the expansion in 2015 and may be afraid to be flat or start declining in 2016. Third, the competition, especially that in Chinese mainland market, was intense. Despite continued upgrading of CCM pixel (mostly 13M pixels for rear CCM), the ASP didn’t rise but slip down. As more and more vendors enter the CCM field with OIS and high-performance AF, a price plunge is inevitable.
In CIS field, shipments are expected to amount to 4,196 million units in 2015 and 4,390 million units in 2016, up 8.8% and 4.6% against the previous year, respectively, compared with annual growth of 11.5% in 2014, indicating a further slowdown. The market size is predicted to be USD9.16 billion in 2015 and USD9.628 billion in 2016, a year-on-year rise of 4.6% and 5.1%, respectively, compared with annual increase of 10.7% in 2014. Except for On-Semi, Sony and Sharp, all other vendors experienced declines. Sony acquired Toshiba’s CIS business, further consolidating its hegemony and its first place by performance, and will keep growing rapidly in 2016. On-Semi is a bellwether in automotive CIS field, seizing nearly 50% market share. As integration went well very after acquisition of Aptina by On-Semi, combined with explosive growth in automotive camera market, On-Semi embraced rapid development in its CIS business, and is expected to record revenue of USD720 million in 2015, including USD400 million from automotive field, a surge of more than 100%.
Largan Precision still outshined others in Lens field with high-speed growth, while the rest of vendors almost all suffered setback in Lens business, except for the vendors with automotive Lens business which witnessed significant growth in such field but with a low ASP. Sunny Optical still ranked first globally in automotive Lens; Kantatsu, a subsidiary of Sharp, made its way into the supply chain of Apple with considerable performance growth.
Japanese companies dominated OIS market with Alps and Mitsumi tied for the first place and both being major suppliers for Apple. In addition, Mitsumi also aggressively marched into Chinese mainland market, planning to invest JPY25 billion to expand capacity over the next two years with the aim of competing for the global champion with Alps.
Bi-Direction and Close-Loop have become two main technologies in VCM field. Japanese vendors exited from low-end VCM field and focused on OIS or Bi-Direction and Close-Loop. The emergence of mainland Chinese companies in low-end market resulted in fierce competition.
In an increasingly competitive CCM field, the majority of companies were caught in the price war and the market became more concentrated. Many vendors registered higher shipments but smaller revenue, even the number of pixel increased. Sharp, performing the best, became the second largest supplier for Apple that placed more orders with Sharp so as to reduce its reliance on LG-INNOTEK, but LG-INNOTECK was still the largest supplier for Apple and ranked first by revenue globally. Cowell, the third largest supplier for Apple, also did very well, and was one of few companies with improved gross margin. SEMCO won more orders from Samsung. Sunny Optical, the No. 1 mainland Chinese vendor, maintained the momentum of strong growth but with a stagnant gross margin, and started shifting its focus to Lens field in the hope of raising its overall growth margin. LITEON selectively gave up low-end business and saw a decline in orders from its major customer Samsung, leading to a collapse in revenue. MCNEX found strong growth in revenue by relying on automotive business.
第一章、CMOS相机模组产业
1.1、CMOS相机模组产业链
1.2、CMOS图像传感器行业CMOS Image Sensor Industry
1.3、CIS图像传感器市场
1.4、CMOS IMAGE SENSOR厂家市场占有率
1.5、中国CIS市场
1.6、光学镜头行业
1.7、CMOS相机模组行业
1.8、CMOS相机模组与品牌厂家供应关系
1.9、AFA(VCM)简介
1.10、AFA(VCM)行业格局
1.11、中国VCM产业研究
1.12、OIS简介
1.13、手机OIS市场
1.14、汽车摄像模组Automotive Camera 市场
1.15、主要汽车摄像模组厂家市场占有率
第二章、CMOS相机模组市场
2.1、全球手机市场
2.2、全球智能手机市场
2.3、中国手机市场
2.4、笔记本电脑市场
2.5、平板电脑市场
2.6、手机摄像发展趋势
2.6.1、提升对焦(Focusing)速度
2.6.2、提升暗光拍摄效果
2.6.3、4K
2.6.4、旋转、阵列、双摄像头
2.6.5、曲面CMOS Sensor
第三章、CMOS图像传感器厂家研究
3.1、三星电子
3.2、Omnivision
3.3、APTINA(ON-SEMI)
3.4、索尼
3.5、东芝
3.6、格科微电子
3.7、思比科微电子
第四章、光学镜头厂家研究
4.1、大立光电
4.2、玉晶光电
4.3、亚洲光学
4.4、新钜科技
4.5、先进光电
4.6、KANTATSU
4.7、日立万胜
4.8、DIOSTECH
4.9、SEKONIX
4.10、高丽光学
4.11、FUJINON
4.12、光耀光电GLORY
4.13、和光光学HOKUGANG
4.14、KMOT
4.15、Digital Optics
第五章、相机模组厂家研究
5.1、群光
5.2、Vista Point Technologies
5.3、鸿海
5.4、LG INNOTEK
5.5、三美电机
5.6、信利光电
5.7、比亚迪光电
5.8、光宝科技LITEON
5.9、致伸科技
5.10、SEMCO
5.11、Partron
5.12、Sunny Optical
5.13、CAMMSYS
5.14、Powerlogics
5.15、MCNEX
5.16、Cowell
5.17、欧菲光
5.18、昆山丘钛微电子Q-TECH
5.19、Globaloptics
5.20、深圳盛泰光电Shine Tech
5.21、夏普
5.22、STMicroelectronics
5.23、其他
5.23.1、深圳市金康光电KingCome
5.23.2、广州大凌实业Darling
第六章、AFA厂家研究
6.1、HYSONIC
6.2、韩国磁化电子JAHWA
1 CCM Industry
1.1 CCM Industry Chain
1.2 CMOS Image Sensor Industry
1.3 CMOS Image Sensor Market
1.4 Market Share of CMOS Image Sensor Vendors
1.5 Chinese CMOS Image Sensor Market
1.6 Optical Lens Industry
1.7 CCM Industry
1.8 Relationship between CCM and Brand Vendors
1.9 Introduction to AFA (VCM)
1.10 AFA (VCM) Industry Pattern
1.11 VCM Industry in China
1.12 Introduction to OIS
1.13 Mobile Phone OIS Market
1.14 Automotive Camera Module Market
1.15 Market Share of Major Automotive Camera Module Vendors
2 CCM Market
2.1 Global Mobile Phone Market
2.2 Global Smartphone Market
2.3 Chinese Mobile Phone Market
2.4 Laptop Computer Market
2.5 Tablet PC Market
2.6 Development Trend of Mobile Phone Camera
2.6.1 Improvement in Speed of Focusing
2.6.2 Shooting in Dim Light
2.6.3 4K
2.6.4 Rotary, Array, Dual Camera
2.6.5 Curved CMOS Sensor
3 CIS Vendors
3.1 Samsung Electronics
3.2 Omnivision
3.3 APTINA (ON-SEMI)
3.4 Sony
3.5 Toshiba
3.6 Galaxycore
3.7 SuperPix Micro Technology
4 Optical Lens Vendors
4.1 Largan
4.2 GSEO
4.3 Asia Optical
4.4 Newmax
4.5 Ability Opto-Electronics Technology
4.6 KANTATSU
4.7 Hitachi Maxell
4.8 DIOSTECH
4.9 SEKONIX
4.10 Korea Optical
4.11 FUJINON
4.12 GLORY
4.13 HOKUGANG
4.14 KMOT
4.15 Digital Optics
5 Camera Module Vendors
5.1 Chicony
5.2 Vista Point Technologies
5.3 Hon Hai
5.4 LG INNOTEK
5.5 Mitsumi Electric
5.6 Truly Opto-Electronics
5.7 BYD Optical
5.8 Lite-On
5.9 Primax
5.10 SEMCO
5.11 Partron
5.12 Sunny Optical
5.13 CAMMSYS
5.14 Powerlogics
5.15 MCNEX
5.16 Cowell
5.17 O-film
5.18 Q-TECH
5.19 Globaloptics
5.20 Shine Tech
5.21 Sharp
5.22 STMicroelectronics
5.23 Others
5.23.1 KingCome
5.23.2 Darling
6 AFA Vendors
6.1 HYSONIC
6.2 JAHWA Electronics
CMOS相机模组产业链
2009-2015年8MP CCM成本结构
2012-2015年13MP CCM成本结构
IMAGE SENSOR厂家供应链
2011-2013年主要CIS厂家出货量像素分布
2010-2017年CIS(CMOS IMAGE SENSOR)市场规模
2010-2016年CIS(CMOS IMAGE SENSOR)出货量
2010-2016 CIS(CMOS IMAGE SENSOR)出货量下游分布
2015、2017 CIS(CMOS IMAGE SENSOR)市场规模下游分布
2013-2014年GLOBAL CIS VENDOR MARKET SHARE BY VOLUME
2013-2015年GLOBAL CIS VENDOR MARKET SHARE BY REVENUE
2012年全球主要CMOS IMAGE SENSOR厂家市场占有率
2012年全球主要CMOS IMAGE SENSOR厂家市场占有率(量)
2012年PC领域全球主要CMOS IMAGE SENSOR厂家市场占有率(量)
2010-2018 GLOBAL AND CHINA CIS MARKET VOLUME FOR MOBILE PHONE
2010-2018 GLOBAL AND CHINA CIS MARKET BY PIXEL COUNT
2010-2013 CHINA CIS VENDOR MARKET SHARE BY VOLUME
2010-2013 CHINA CIS VENDOR MARKET SHARE BY REVENUE
2011-2015年全球主要CMOS相机光学镜头厂家收入排名
2010-2017年全球CMOS相机模组市场规模
2010-2015全球CCM厂家收入排名
2014年10月中国十大CCM厂家出货量
2013年诺基亚相机模组供应商分布
2013-2014年三星相机模组供应商分布
2013-2015年苹果相机模组供应商分布
2012年LG相机模组供应商分布
2013年ZTE相机模组供应商分布
2013-2014年华为相机模组供应商分布
2013-2014年联想相机模组供应商分布
2015年小米相机模组供应商分布
VCM直观图
VCM剖面图
AFA与相机模组厂家之间供应关系
2012年全球主要AFA厂家市场占有率
2015年全球主要AFA厂家市场占有率
2015年最具竞争力的国产VCM马达10强
OIS结构图
OIS原理图
2012-2017年采用OIS的手机出货量
2015年OIS主要厂家市场占有率(按收入)
2009-2016年全球AUTOMOTIVE CAMERA MODULE 出货量
2012年主要汽车摄像模组厂家市场占有率
2007-2016年全球手机出货量
WORLDWIDE MOBILE PHONE SALES TO END USERS BY VENDOR IN 2012-2013 (THOUSANDS OF UNITS)
2013-2015年全球十大手机厂家出货量
WORLDWIDE SMARTPHONE SALES TO END USERS BY VENDOR IN 2012-2015 (THOUSANDS OF UNITS)
WORLDWIDE SMARTPHONE SALES TO END USERS BY OPERATING SYSTEM IN 2012-2015 (THOUSANDS OF UNITS)
2014年中国智能手机市场主要厂家市场占有率
2014-2015 中国智能手机市场主要厂家市场占有率
2008-2015年笔记本电脑出货量
2010-2014年全球主要笔记本电脑ODM厂家出货量
2011-2016年全球平板电脑出货量
TOP FIVE TABLET VENDORS, SHIPMENTS FOURTH QUARTER 2014
TOP FIVE TABLET VENDORS, SHIPMENTS, MARKET SHARE, AND GROWTH, CALENDAR YEAR 2014
三星 8MP以上 CMOS IMAGE SENSOR产品一览
FY2009-FY2016 OMNIVISION收入与毛利率
FY2009-FY2016 OMNIVISION收入与运营利润率
FY2009-FY2015 OMNIVISION出货量
FY2009-FY2015 OMNIVISION收入地域分布
FY2009-FY2015OMNIVISION资产地域分布
FY2011-FY2014 OMNIVISION收入下游应用分布
FY2013-FY2014 OMNIVISION收入RESOLUTION分布
2014 OVT各领域市场占有率
OMNINVISION 供应链
2014年3季度-2015年3季度 ON SEMICONDUCTOR QUARTERLY SALES AND GROSS MARGIN
3Q14-3Q15 ON SEMICONDUCTOR QUARTERLY REVENUES SPLIT BY BUSINESS UNIT
3Q14-3Q15 ON SEMICONDUCTOR IMAGE SENSOR GROUP QUARTERLY REVENUES
索尼半导体事业部组织结构
索尼图像传感器产能扩展计划
IMAGE SENSOR应用分布
2011-2014年GALAXYCORE收入与毛利率
2011-2014年GALAXYCORE收入产品分布
2011-2014年GALAXYCORE收入像素分布BY PIXEL
2011-2014年GALAXYCORE产品出货量
2011-2014年GALAXYCORE资产、负债与现金流
2006-2015年大立光收入与毛利率
2006-2015年大立光收入与运营利润率
2013年1季度-2015年3季度大立光季度收入与净利率
2013年10月-2015年10月大立光月度收入
2014-2015年大立光出货量像素分布
2010-2014年大立光收入客户分布
2011-2014年大立光电出货量
大立光电大陆子公司2014年财务数据
2005-2015年玉晶光电收入与毛利率
2005-2015年玉晶光电收入与运营利润率
2013年10月-2015年10月玉晶光月度收入
2007-2015年亚光收入与毛利率
2007-2015年亚光收入与运营利润率
2013年10月-2015年10月亚洲光学月度收入
2007-2012年亚光收入产品分布
2007-2014年新钜科技收入与毛利率
2013年10月-2015年10月新钜科技月度收入
2006-2015年先进光电收入与毛利率
2013年10月-2015年10月先进光电每月收入
KANTATSU手机相机模组产品一览
2013年DIOSTECH收入业务分布
2013年DIOSTECH产能、产量、产能利用率
DIOSTECH组织结构
DIOSTECH生产线
DIOSTECH客户
2012年DIOSTECH收入像素分布
2002-2015年SEKONIX收入与运营利润率
2009-2015年SEKONIX收入产品分布
2009-2014年SEKONIX HANDSET LENS业务收入像素分布
2009-2014年SEKONIX HANDSET LENS出货量收入像素分布
2007-2015年高丽光学收入与运营利润率
高丽光学路线图
2006-2015年光耀科技收入与运营利润率
2013年10月-2015年10月光耀科技每月收入
2006-2015年和光光学收入毛利率
2013年10月-2015年10月和光光学每月收入
2011-2012财年 KMOT OPTICAL UNITS FOR CELL PHONES 收入
2007-2015年DIGITAL OPTICS收入与运营利润率
2010-2013年DIGITAL OPTICS收入像素分布
2009-2013年DIGITAL OPTICS出货量像素分布
2009-2013年DIGITAL OPTICS CAPEX
2011-2014年DIGITAL OPTICS原材料成本分布
2005-2015年群光收入与毛利率
2005-2015年群光收入与运营利润率
2013年10月-2015年10月群光月度收入
2011-2014年群光收入产品分布
2012年群光主要大陆子公司财务数据
鸿海光学领域主要子公司2010年财务数据
鸿海光学领域主要子公司2014年财务数据
2006-2015年LG INNOTEK收入与运营利润率
2013年1季度-2015年3季度LG INNOTEK收入与运营利润率
2013-2015年LG INNOTEK 收入业务分布
2011-2015年LG INNOTEK 运营利润业务分布
2011年1季度-2015年3季度LG INNOTEK OPTICAL季度收入
2012年3季度-2015年3季度LG INNOTEK CCM像素分布
2006-2016财年三美电机收入与运营利润率
2006-2016财年三美电机收入产品分布
2005-2015年信利国际收入与运营利润率
2013年1季度-2015年3季度信利国际季度收入与毛利率
2006-2011年信利国际LCD业务收入技术分布
2012-2015年信利半导体收入业务分布
2012-2015年信利半导体各项产品出货量
2012-2015年信利半导体各项产品ASP
信利手机LCD主要客户
信利汽车显示器产能
信利汽车显示器主要客户
信利触摸屏产能
信利CCM产能
信利CCM主要客户
光宝集团业务结构
2013年1季度-2015年3季度光宝季度收入部门分布
光宝广州科技园
2011年3季度-2013年4季度光宝CCM产能扩展计划
光宝CCM技术路线图
光宝的OIS CONCEPT
2005-2015年光宝收入与运营利润率
致伸科技KEY MILESTONE
2008-2015年致伸科技收入与营业利润率
2007-2015年致伸科技收入部门分布
2013年10月-2015年10月致伸科技每月收入
致伸全球分布
致伸科技产品范围
2011-2016年SEMCO收入与营业利润
2010-2015年SEMCO收入部门分布
2010-2015年SEMCO运营利润部门分布
2012年1季度-2015年3季度SEMCO CCM业务收入
2010-2014年SEMCO相机模组业务收入像素分布
2013-2015年SEMCO相机模组业务三星客户供应比例
2011年1季度-2016年4季度SEMCO CCM业务收入与营业利润率
2007-2015年PARTRON收入与运营利润率
2013年1季度-2015年3季度PARTRON收入产品分布
2013-2015年PARTRON CCM收入像素分布
2004-2015年舜宇收入与毛利率
2009-2015年财务概要 FINANCIAL SUMMARY
舜宇主要客户
2014年1月-2015年10月舜宇各项产品月度出货量
2013-2015舜宇各项产品出货量
2010-2015年舜宇收入部门分布
2010-2014年舜宇收入下游分布
SUNNY OPTICAL CAMERA MODULE SHIPMENT BREAKDOWN BY PIXEL 2012-2014
2010-2014年舜宇各部门毛利率
2012-2016年SUNNY OPTICAL毛利产品分布
2012-2016 年SUNNY OPTICAL HANDSET LENS SHIPMENT
2012-2016 年SUNNY OPTICAL AUTOMOTIVE LENS REVENUE
舜宇工厂分布
CAMMSYS组织结构图
2009-2015年CAMMSYS收入与营业利润率
2011-2014年CAMMSYS原材料价格
2009-2015年POWERLOGIC收入与营业利润
2012-2014年POWERLOGIC CCM ASP
2012-2014年POWERLOGIC CCM COMPONENT ASP
2012-2014年POWERLOGIC CCM产能
2012-2014年POWERLOGIC CCM产量
2009-2016年MCNEX收入与营业利润
2013年MCNEX收入客户分布
2010-2016年MCNEX收入应用分布
MCNEX 手机领域主要产品
MCNEX 产能地域分布
东莞高伟2005-2015年收入与毛利率
2011-2015 COWELL REVENUE BREAKDOWN BY SEGMENT
2011-2015 COWELL SHIPMENTS VS ASP
2014年10月31日COWELL 产能
2013-2014 COWELL成本结构
2007-2015年欧菲光收入与运营利润率
2009-2015年欧菲光收入产品分布
2012-2014年欧菲光客户结构
2011-2015年Q-TECH收入与毛利率
2011-2014年Q-TECH财务数据
2011-2014年Q-TECH现金流
2011-2014 Q-TECH出货量
2011-2015 Q-TECH收入BY PIXEL
2011-2015 Q-TECH出货量BY PIXEL
2011-2014 Q-TECH 产品 ASP
2011-2014 Q-TECH 产品毛利率%
2015年Q-TECH客户分布
FY2009-FY2015年GAI收入与营业利润
盛泰主要客户
FY2008-FY2016 SHARP 收入与营业利润率
FY2013-FY2016 SHARP收入业务分布
FY2013-FY2015 SHARP 各项业务营业利润率
夏普OIS路线图
FY2014 STMICRO REVENUE BY PRODUCT
3Q/2015 STMICRO REVENUE BY PRODUCT
HYSONIC结构
2006-2015年HYSONIC收入与运营利润
2014年3月底PERSONNEL ORGANIZATION OF HYSONIC
HYSONIC 主要产品
2012-2013年HYSONIC收入最终客户分布
2012-2013年HYSONIC收入客户分布
2005-2015年JAHWA收入与运营利润率
1Q13-4Q15 JAHWA季度收入产品分布
磁化电子海外子公司一览
CCM Industry Chain
Cost Structure of 8MP CCM, 2009-2015
Cost Structure of 13MP CCM, 2012-2015
Supply Chain of Image Sensor Vendors
Shipment of Major Global CIS Vendors by Pixel, 2011-2013
CIS Market Size, 2010-2017E
CIS Shipments, 2010-2016E
CIS Shipments by Application,2010-2016E
CIS Market Size by Application, 2015&2017E
Market Share of Global CIS Vendors by Volume, 2013-2014
Market Share of Global CIS Vendors by Revenue, 2013-2015
Market Share of Major Global CIS Vendors, 2012
Market Share of Major Global CIS Vendors by Volume, 2012
Market Share of Major Global CIS Vendors in PC Field by Volume, 2012
Global and China CIS Market Volume for Mobile Phone, 2010-2018E
Global and China CIS Market by Pixel Count, 2010-2018E
China CIS Vendor Market Share by Volume, 2010-2013
China CIS Vendor Market Share by Revenue, 2010-2013
Ranking of Major Global CMOS Camera Optical Lens Vendors by Revenue, 2011-2015
Global CCM Market Size, 2010-2017E
Ranking of Global CCM Vendors by Revenue, 2010-2015
Shipments of China’s Top10 CCM Vendors, Oct 2014
Suppliers of Camera Modules for Nokia, 2013
Suppliers of Camera Modules for Samsung, 2013-2014
Suppliers of Camera Modules for Apple, 2013-2015
Suppliers of Camera Modules for LG, 2012
Suppliers of Camera Modules for ZTE, 2013
Suppliers of Camera Modules for Huawei, 2013-2014
Suppliers of Camera Modules for Lenovo, 2013-2014
Suppliers of Camera Modules for Xiaomi, 2015
Pictorial Diagram of VCM
Profile Diagram of VCM
Supply Relationship between AFA and Camera Module Vendors
Market Share of Major Global AFA Vendors, 2012
Market Share of Major Global AFA Vendors, 2015
Top10 Most Competitive China-made VCM Motors, 2015
Structural Diagram of OIS
Schematic Diagram of OIS
Shipment of Mobile Phone with OIS, 2012-2017E
Market Share of Major OIS Vendors by Revenue, 2015
Global Shipments of Automotive Camera Modules, 2009-2016E
Market Share of Major Automotive Camera Module Vendors, 2012
Global Mobile Phone Shipments, 2007-2016E
Global Mobile Phone Sales to End Users by Vendor, 2012-2013
Shipments of Global Top10 Mobile Phone Vendors, 2013-2015
Global Smartphone Sales to End Users by Vendor, 2012-2015
Global Smartphone Sales to End Users by Operating System, 2012-2015
Market Share of Major Vendors in Chinese Smartphone Market, 2014
Market Share of Major Vendors in Chinese Smartphone Market, 2014-2015
Laptop Computer Shipments, 2008-2015
Shipments of Major Global Laptop Computer ODMs, 2010-2014
Global Tablet PC Shipments, 2011-2016E
Shipments of Top5 Tablet PC Vendors, 2014Q4
Shipments, Market Share, and Growth of Top5 Tablet PC Vendors, 2014
8MP-above CIS Products of Samsung
Revenue and Gross Margin of OMNIVISION, FY2009-FY2016
Revenue and Operating Margin of OMNIVISION, FY2009-FY2016
Shipments of OMNIVISION, FY2009-FY2015
Revenue of OMNIVISION by Region, FY2009-FY2015
Assets of OMNIVISION by Region, FY2009-FY2015
Revenue of OMNIVISION by Application, FY2011-FY2014
Revenue of OMNIVISION by Resolution, FY2013-FY2014
Market Share of OVT by Application, 2014
Supply Chain of OMNINVISION
Quarterly Sales and Gross Margin of ON Semiconductor, 2014Q3-2015Q3
Quarterly Reveue of ON Semiconductor by Business Unit, 2014Q3-2015Q3
Quartely Revenue of ON Semiconductor’s Image Sensor Group, 2014Q3-2015Q3
Organizational Structure of Sony's Semiconductor Division
Sony’s Image Sensor Capacity Expansion Plan
Applications of Sony’s Image Sensors
Revenue and Gross Margin of Galaxycore, 2011-2014
Revenue of Galaxycore by Product, 2011-2014
Revenue of Galaxycore by Pixel, 2011-2014
Shipment of Galaxycore, 2011-2014
Assets, Liabilities and Cash Flow of Galaxycore, 2011-2014
Revenue and Gross Margin of Largan, 2006-2015
Revenue and Operating Margin of Largan, 2006-2015
Quarterly Revenue and Net Profit Margin of Largan, 2013Q1-2015Q3
Monthly Revenue of Largan, Oct 2013-Oct 2015
Shipments of Largan by Pixel, 2014-2015
Revenue of Largan by Customer, 2010-2014
Shipments of Largan, 2011-2014
Financial Data of Largan’s Subsidiaries in Mainland China, 2014
Revenue and Gross Margin of GSEO, 2005-2015
Revenue and Operating Margin of GSEO, 2005-2015
Monthly Revenue of GSEO, Oct 2013-Oct 2015
Revenue and Gross Margin of Asia Optical, 2007-2015
Revenue and Operating Margin of Asia Optical, 2007-2015
Monthly Revenue of Asia Optical, Oct 2013-Oct 2015
Revenue of Asia Optical by Product, 2007-2012
Revenue and Gross Margin of Newmax, 2007-2014
Monthly Revenue of Newmax, Oct 2013-Oct 2015
Revenue and Gross Margin of Ability Opto-Electronics Technology, 2006-2015
Monthly Revenue of Ability Opto-Electronics Technology, Oct 2013-Oct 2015
Mobile Phone Camera Modules of KANTATSU
Revenue of DIOSTECH by Business, 2013
Capacity, Output, and Capacity Utilization of DIOSTECH, 2013
Organizational Structure of DIOSTECH
Production Lines of DIOSTECH
Customers of DIOSTECH
Revenue of DIOSTECH by Pixel, 2012
Revenue and Operating Margin of SEKONIX, 2002-2015
Revenue of SEKONIX by Product, 2009-2015
Handset Lens Revenue of SEKONIX by Pixel, 2009-2014
Handset Lens Shipment of SEKONIX by Pixel, 2009-2014
Revenue and Operating Margin of Korea Optical, 2007-2015
Roadmap of Korea Optical
Revenue and Operating Margin of GloryTek, 2006-2015
Monthly Revenue of GloryTek, Oct 2013-Oct 2015
Revenue and Gross Margin of Hokuang, 2006-2015
Monthly Revenue of Hokuang, Oct 2013-Oct 2015
Optical Units for Cell Phone Revenue of KMOT, FY2011-FY2012
Revenue and Operating Margin of DIGITAL OPTICS, 2007-2015
Revenue of DIGITAL OPTICS by Pixel, 2010-2013
Shipments of DIGITAL OPTICS by Pixel, 2009-2013
CAPEX of DIGITAL OPTICS, 2009-2013
Raw Materials Cost Structure of Digital Optics, 2011-2014
Revenue and Gross Margin of Chicony, 2005-2015
Revenue and Operating Margin of Chicony, 2005-2015
Monthly Revenue of Chicony, Oct 2013-Oct 2015
Revenue of Chicony by Product, 2011-2014
Financial Data of Chicony’s Major Subsidiaries in Mainland China, 2012
Financial Data of Hon Hai’s Major Optical Subsidiaries, 2010
Financial Data of Hon Hai’s Major Optical Subsidiaries, 2014
Revenue and Operating Margin of LG INNOTEK, 2006-2015
Revenue and Operating Margin of LG INNOTEK, 2013Q1-2015Q3
Revenue of LG INNOTEK by Business, 2013-2015
Operating Income of LG INNOTEK by Business, 2011-2015
Quarterly Revenue of LG INNOTEK OPTICAL, 2011Q1-2015Q3
CCM of LG INNOTEK by Pixel, 2012Q3-2015Q3
Revenue and Operating Margin of Mitsumi Electric, FY2006-FY2016
Revenue of Mitsumi Electric by Product, FY2006-FY2016
Revenue and Operating Margin of Truly International, 2005-2015
Quarterly Revenue and Gross Margin of Truly International, 2013Q1-2015Q3
Revenue of LCD Business of Truly International by Technology, 2006-2011
Revenue of Truly Semiconductors by Business, 2012-2015
Shipments Breakdown of Truly Semiconductors by Product, 2012-2015
ASP of Truly Semiconductors by Product, 2012-2015
Main Customers of Truly’s Mobile Phone LCD
Auto Display Capacity of Truly
Main Customers of Truly’s Auto Display
Touch Screen Capacity of Truly
CCM Capacity of Truly
Customers of Truly’s CCM
Business Structure of Lite-On
Quarterly Revenue of Lite-On by Busines, 2013Q1-2015Q3
Lite-On’s Guangzhou Science and Technology Park
CCM Capacity Expansion Plan of Lite-On, 2011Q3-2013Q4
CCM Technology Roadmap of Lite-On
OIS Concept of Lite-On
Revenue and Operating Margin of Lite-On, 2005-2015
Key Milestones of Primax
Revenue and Operating Margin of Primax, 2008-2015
Revenue of Primax by Division, 2007-2015
Monthly Revenue of Primax, Oct 2013-Oct 2015
Global Presence of Primax
Range of Products of Primax
Revenue and Operating Income of SEMCO, 2011-2016E
Revenue of SEMCO by Division, 2010-2015
Operating Income of SEMCO by Division, 2010-2015
CCM Revenue of SEMCO, 2012Q1-2015Q3
Camera Module Revenue of SEMCO by Pixel, 2010-2014
SEMCO’s Camera Module Supply Ratio for Samsung, 2013-2015
CCM Revenue and Operating Margin of SEMCO, 2011Q1-2016Q4E
Revenue and Operating Margin of PARTRON, 2007-2015
Revenue of PARTRON by Product, 2013Q1-2015Q3
CCM Revenue of PARTRON by Pixel, 2013-2015
Revenue and Gross Margin of Sunny Optical, 2004-2015
Financial Summary of Sunny Optical, 2009-2015
Main Customers of Sunny Optical
Monthly Shipments of Sunny Optical by Product, Jan 2014-Oct 2015
Shipments of Sunny Optical by Product, 2013-2015
Revenue of Sunny Optical by Division, 2010-2015
Revenue of Sunny Optical by Application, 2010-2014
Camera Module Shipments of Sunny Optical by Piexl, 2012-2014
Gross Margin of Sunny Optical by Division, 2010-2014
Gross Margin of Sunny Optical by Product, 2012-2016E
Shipments of Handset Lens of Sunny Optical, 2012-2016E
Automotive Lens Revenue of Sunny Optical, 2012-2016
Factories of Sunny Optical
Organizational Structure of CAMMSYS
Revenue and Operating Margin of CAMMSYS, 2009-2015
Raw Materials Price of CAMMSYS, 2011-2014
Revenue and Operating Income of POWERLOGIC, 2009-2015
CCM ASP of POWERLOGIC, 2012-2014
CCM Component ASP of POWERLOGIC, 2012-2014
CCM Capacity of POWERLOGIC, 2012-2014
CCM Output of POWERLOGIC, 2012-2014
Revenue and Operating Income of MCNEX, 2009-2016E
Revenue of MCNEX by Customer, 2013
Revenue of MCNEX by Application, 2010-2016E
MCNEX’s Main Products for Mobile Phone
MCNEX’s Capacity by Region
Revenue and Gross Margin of Cowell, 2005-2015
Revenue Breakdown of Cowell by Segment, 2011-2015
Shipments and ASP of Cowell, 2011-2015
Capacity of Cowell, Oct 31, 2014
Cost Structure of Cowell, 2013-2014
Revenue and Operating Margin of O-film, 2007-2015
Revenue of O-film by Product, 2009-2015
Customer Structure of O-film, 2012-2014
Revenue and Gross Margin of Q-TECH, 2011-2015
Financial Data of Q-TECH, 2011-2014
Cash Flow of Q-TECH, 2011-2014
Shipments of Q-TECH, 2011-2014
Revenue of Q-TECH by Pixel, 2011-2015
Shipments of Q-TECH by Pixel, 2011-2015
ASP of Q-TECH’s Products, 2011-2014
Gross Margin of Q-TECH’s Products, 2011-2014
Customers of Q-TECH, 2015
Revenue and Operating Income of GAI, FY2009-FY2015
Main Customers of Shine Tech
Revenue and Operating Margin of Sharp, FY2008-FY2016
Revenue of Sharp by Business, FY2013-FY2016
Operating Margin of Sharp by Business, FY2013-FY2015
OIS Roadmap of Sharp
Revenue of STMicroelectronics by Product, FY2014
Revenue of STMicroelectronics by Product, 2015Q3
Structure of HYSONIC
Revenue and Operating Income of HYSONIC, 2006-2015
Personnel Organization of Hysonic by the end of Mar 2014
Main Products of HYSONIC
Revenue of HYSONIC by End Customer, 2012-2013
Revenue of HYSONIC by Customer, 2012-2013
Revenue and Operating Margin of JAHWA, 2005-2015
Quaterly Revenue of JAHWA by Product, 2013Q1-2015Q4
Overseas Subsidiaries of JAHWA Electronics
如果这份报告不能满足您的要求,我们还可以为您定制报告,请 留言说明您的详细需求。
|