|
|
|
报告导航:研究报告—
TMT产业—电子半导体
|
|
2015年全球及中国FPCB产业研究报告 |
 |
字数:2.3万 |
页数:153 |
图表数:170 |
|
中文电子版:9000元 |
中文纸版:4500元 |
中文(电子+纸)版:9500元 |
|
英文电子版:2400美元 |
英文纸版:2600美元 |
英文(电子+纸)版:2700美元 |
|
编号:ZYW221
|
发布日期:2016-01 |
附件:下载 |
 |
|
|
《2015年全球及中国FPCB产业研究报告》包含以下内容:
1、FPCB简介
2、FPCB下游市场分析
3、FPCB产业分析
4、31家FPCB产业链厂家研究
2014年全球FPCB市场规模达129.52亿美元,比2013年增长14.4%。2015年FPCB市场规模约为133.86亿美元,比2014年增长3.4%,2016年市场规模预计为136.8亿美元,增速大幅放缓至2.2%。原因有以下几点:
下游市场低迷:手机市场低迷,智能手机增幅降到5%以下,平板电脑明显衰退,笔记本电脑持平,HDD出货量明显衰退;
日元大幅度贬值;
通缩导致上游原材料价格下降
未来FPCB仍然有成长空间,首先各种电子产品都追求超薄,FPCB是超薄的最佳选择,厚度只有RPCB的1/10,还可以3D布线,未来线径(line width)将朝40微米以下发展,FPCB的单价有望提高。其次是更多地FPCB表面贴装SMD Devices元件,这有助于FPCB的单价提高。
2015年FPCB约占汽车PCB市场的10%,大约5.28亿美元,预计2019年可达16%,大约11.23亿美元。汽车开关如Wiper、Lighting、Turn Signal、Cruise Control,以及Information Center display、Head up display、Instrument cluster都需要FPCB,并且汽车内的显示屏越来越大,FPCB的需求也将越来越大。
xEV领域的电池监测(Cell Voltage Monitoring)部分,Cell越多,需要的FPCB自然也越多。汽车Powertrain领域的transmission control units,档位越多,需要使用的FPCB面积越大。汽车照明部分,除了LED head-lamp可能不需要FPCB,其余如Daytime Running Light、Turn Signal Indicator、Parking Lights、Signature Lighting、Rear Lights都要用到FPCB,而汽车LED照明的增速很快。
汽车传感器也需要大量使用FPCB,如Camera Module、Pressure sensors for air conditioning systems、Pressure sensors for brake systems and transmissions、Keyless entry sensor、Electronic door handle,而随着ADAS的大量普及,传感器数量会爆发,FPCB也会爆发。
产业方面,日本和台湾企业依靠货币贬值取得强大的竞争力,同时日本企业还有明显的技术领先优势,而台湾企业依靠和苹果的良好关系,取得越来越多的订单,中国大陆和韩国企业明显缺乏竞争力,韩币的贬值程度远不及日元。汽车FPCB产业大多被日本厂家掌控,门槛很高。
Global and China FPCB Industry Report, 2015 covers the following contents:
1. Overview of FPCB
2. Downstream markets of FPCB
3. FPCB industry
4. 31 companies in FPCB industry chain
Global FPCB market size was up to USD12.952 billion in 2014 (up 14.4% from a year ago), grew by 3.4% YoY to about USD13.386 billion in 2015, and is expected to arrive at USD13.68 billion in 2016 at a slower annual growth rate of 2.2%, largely due to:
 Depressed downstream markets: mobile phone market took a downturn with shipment growth of smartphone below 5%; shipments of tablet PC contracted significantly; shipments of laptop computer remained flat; shipments of HDD dropped markedly; Depressed downstream markets: mobile phone market took a downturn with shipment growth of smartphone below 5%; shipments of tablet PC contracted significantly; shipments of laptop computer remained flat; shipments of HDD dropped markedly;
A sharp depreciation of the Japanese yen;
Decline in prices of upstream raw materials caused by deflation.
There is still growth space for FPCB. First, electronics now pursue for ultra-thinness, and FPCB is the best solution, as it is only 1/10 of the thickness of RPCB and makes 3D wiring a reality. Line width will be smaller than 40nm, so the unit price of FPCB is expected to rise. Second, the surface of more and more FPCB is mounted with SMD devices, which is also conducive to a rise in the unit price of FPCB.
FPCB makes up about 10% of automotive PCB market in 2015, about USD528 million, and is expected to reach 16% in 2019 or around USD1.123 billion. Automotive switches (wiper, lighting, turn signal, cruise control) and information center display, head up display, and instrument cluster all need FPCB. Moreover, as the automotive display becomes increasingly larger, the demand for FPCB will swell up.
For cell voltage monitoring in xEV field, the larger the number of cell is, the more FPCB will be needed. For transmission control units in automotive Powertrain field, the more the gears are, the larger the area of FPCB will be. For automotive lighting, except for LED head-lamp which may not need FPCB, others like daytime running light, turn signal indicator, parking lights, signature lighting, and rear lights all need FPCB. In addition, the automotive LED lighting market has been growing at a rapid pace.
A large amount of FPCB is needed for automotive sensors, such as the ones for camera module, pressure sensors for air conditioning systems, pressure sensors for brake systems and transmissions, keyless entry sensor, and electronic door handle. As ADAS becomes more universal, the number of sensors will explode, causing an exponential growth in the demand for FPCB.
From the perspective of the industry, Japanese and Taiwanese vendors achieve powerful competitiveness via currency depreciation. And not only that, Japanese companies also enjoy cutting-edge technologies, while Taiwanese players win more and more orders by relying on their good relationship with Apple. By contrast, the mainland Chinese companies and South Korean ones obviously lack competitiveness, as South Korean won doesn’t depreciate as violent as Japanese yen. Automotive FPCB industry is virtually dominated by Japanese companies, and the thresholds are much higher.
第一章 软板简介
1.1、软板简介
1.2、单面板
1.3、双面板、单铜双做、单+单、多层板
1.4、软板制造流程
第二章 FPCB市场
2.1、FPCB市场规模
2.2、HDD市场
2.3、全球手机市场
2.4、全球智能手机市场与产业
2.5、中国手机市场概况
2.6、笔记本电脑市场
2.7、平板电脑市场
2.8、触控屏产业链
2.9、触控屏产业规模
2.10、触控屏发展趋势
2.10.1、中尺寸触控屏发展趋势
2.10.2、笔记本电脑触控屏发展趋势
2.11、汽车FPCB市场规模
2.12、汽车FPCB使用实例
第三章 软板产业
3.1、软板产业链
3.2、FPCB厂家业务模式
3.3、FPC产业地域分布
3.4、FPCB客户供应关系
3.5、手机软板供应关系
3.6、FPCB厂家排名
第四章 FPCB厂家研究
4.1、FUJIKURA(藤仓)
4.1.1、藤仓电子(上海)有限公司
4.1.2、藤仓电子(无锡)有限公司
4.2、Nippon Mektron(旗胜)
4.2.1、珠海紫翔电子科技有限公司
4.2.2、苏州紫翔电子科技有限公司
4.3、日东电工NITTO DENKO
4.4、Dexerials索尼凯美高
4.5、M-FLEX
4.6、台郡科技FLEXIUM
4.7、嘉联益CAREER
4.8、旭软SUNFLEX
4.9、安捷利AKM
4.10、厦门弘信电子科技
4.11、Parlex
4.12、SI Flex
4.13、住友电工Sumitomo Electric Industries
4.14、DAEDUCK GDS
4.15、Interflex
4.16、深圳市精诚达电路科技
4.17、范桓BHflex
4.18、Newflex
4.19、FLEXCOM
4.20、MFS
4.21、毅嘉Ichia
4.22、臻鼎ZDT
4.23、景旺电子
第五章 FCCL厂家
5.1、台虹科技Taiflex
5.2、新扬科技ThinFlex
5.3、新日本制铁化学NIPPON STEEL CHEMICAL
5.4、有泽制造所Arisawa
5.5、律胜科技MICROCOSM
5.6、亚洲电材AEM
5.7、达迈科技TAIMIDE
5.8、INNOX
1 Overview of FPCB
1.1 Profile
1.2 Single-sided FPCB
1.3 Double-sided FPCB, “Single-sided FPCB + Single-sided FPCB” and Multilayer FPCB
1.4 FPCB Manufacturing Process
2 FPCB Market
2.1 FPCB Market Size
2.2 HDD Market
2.3 Global Mobile Phone Market
2.4 Global Smartphone Market and Industry
2.5 Overview of Chinese Mobile Phone Market
2.6 Laptop Computer Market
2.7 Tablet PC Market
2.8 Touch Screen Industry Chain
2.9 Touch Screen Industrial Scale
2.10 Touch Screen Development Trend
2.10.1 Medium-sized Touch Screen
2.10.2 Laptop Computer Touch Screen
2.11 Automotive FPCB Market Size
2.12 Automotive FPCB Application Case
3 FPCB Industry
3.1 FPCB Industry Chain
3.2 Business Models of FPCB Companies
3.3 Geographical Distribution of FPCB Industry
3.4 FPCB Supply
3.5 Mobile Phone FPCB Supply Relationship
3.6 Ranking of FPCB Companies
4 FPCB Companies
4.1 Fujikura
4.1.1 Fujikura Electronics Shanghai
4.1.2 Fujikura Electronics Wuxi
4.2 Nippon Mektron
4.2.1 Mektec Manufacturing Corporation (Zhuhai)
4.2.2 Mektec Manufacturing Corporation (Suzhou)
4.3 Nitto Denko
4.4 Dexerials
4.5 M-Flex
4.6 Flexium
4.7 Career
4.8 Sunflex
4.9 AKM
4.10 Xiamen Hongxin Electron-Tech Co, Ltd.
4.11 Parlex
4.12 SI Flex
4.13 Sumitomo Electric Industries
4.14 Daeduck GDS
4.15 Interflex
4.16 Shenzhen JCD Circuit Technology Co., Ltd.
4.17 BHflex
4.18 Newflex
4.19 Flexcom
4.20 MFS
4.21 Ichia
4.22 ZDT
4.23 Kinwong
5. FCCL Companies
5.1 Taiflex
5.2 ThinFlex
5.3 Nippon Steel Chemical
5.4 Arisawa
5.5 Microcosm
5.6 AEM
5.7 Taimide
5.8 INNOX
FPC单面板结构
双面板结构
单铜双做结构
单+单结构图
双层板结构图
COF构装图
软硬板示意图
软板制造流程
曝光机工作概念
显像冲洗
蚀刻冲洗
剥膜
热压和
2007-2016年全球FPCB市场规模
2013\2017年全球FPCB市场下游分布
2012年4季度-2015年3季度每季度HDD出货量
2009-2016年全球HDD出货量
2015年全球HDD主要厂家市场占有率
2007-2016年全球手机出货量
Worldwide Mobile Phone Sales to End Users by Vendor in 2012-2013
2013-2015年全球十大手机厂家出货量
Worldwide Smartphone Sales to End Users by Vendor in 2012-2015 (Thousands of Units)
Worldwide Smartphone Sales to End Users by Operating System in 2012-2015 (Thousands of Units)
2014年中国智能手机市场主要厂家市场占有率
2014-2015中国智能手机市场主要厂家市场占有率
2008-2015年全球笔记本电脑出货量
2010-2014年全球主要笔记本电脑ODM厂家出货量
2010-2016年全球平板电脑出货量
Top Five Tablet Vendors, Shipments Fourth Quarter 2014
Top Five Tablet Vendors, Shipments, Market Share, and Growth, Calendar Year 2014
触控屏产业链
Touch Industry Supply Chain and Eco-system
2010-2016年全球触控屏市场规模
2010-2016年全球触控屏市场规模(出货量)
2013-2017年全球智能手机触控技术发展趋势
2011-2015年全球中尺寸触控屏技术分布
2012-2016年全球笔记本电脑触控屏出货量技术分布
2011-2019 World Automotive PCB Market Size
2015、2020 Automotive PCB Market by Position
全球软板重要厂家
台湾软板产业链
2009-2015年全球FPCB产业收入地域分布
2010-2011年全球FPCB产业收入地域分布(按产出地)
FPCB供应关系硬盘领域
FPCB供应关系光驱领域
FPCB供应关系手机领域
2011-2013三星集团软板主要供应商供应比例(金额)
2011-2014苹果集团软板主要供应商供应比例(金额)
2010-2015年日本FPC厂家收入排名
2012-2015年韩国FPC厂家收入排名
2009-2015年韩国FPC厂家营业利润率排名
2010-2015年台湾FPC厂家收入排名
2009-2015年台湾FPC厂家营业利润率排名
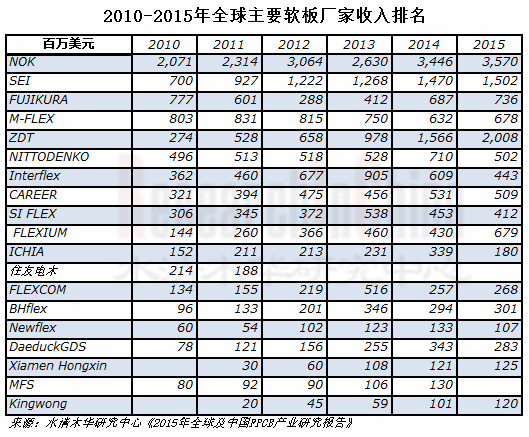
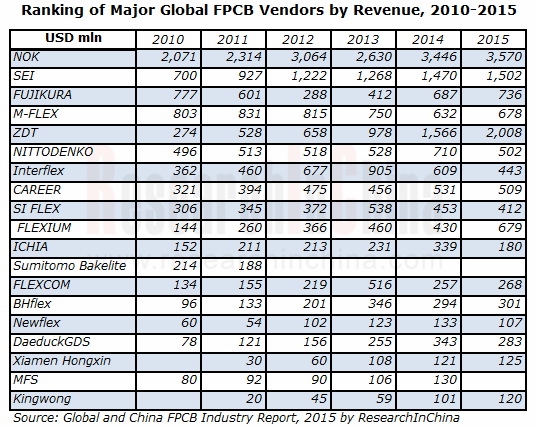
2010-2015年全球主要软板厂家收入排名
藤仓泰国基地一览
FY2006-FY2016藤仓收入与运营利润统计
2008-2013财年藤仓收入部门分布
FY2014-FY2016 Fujikura收入产品分布
FY2013-FY2016 Fujikura营业利润业务分布
FY2008-FY2016 FUJIKURA FPC SEGMENT REVENUE
FY2001-FY2016 NOK收入与营业利润率
Mektron组织结构
2006-2016财年NOK收入产品分布
2013-2016财年NOK营业利润产品分布
2010-2016财年NOK收入地域分布
2010-2016财年MEKTRON FPC事业部收入地域分布
Mektron全球分布
2004-2014年珠海紫翔电子科技有限公司收入与运营利润
FY2006-FY2016日东电工收入与运营利润率
FY2013-FY2015 日东电工收入业务分布
FY2013-FY2015 日东电工运营利润业务分布
2004-2010年索尼凯美高苏州公司部分财务数据
FY2004-FY2015 M-FLEX收入与运营利润
FY2010-FY2014 M-FLEX收入地域分布
FY2012-2014 M-FELX收入国别结构
2006-2013财年M-FELX运营利润地域分布
FY2006-FY2015 M-FLEX客户结构比例
2011年1季度-2015年2季度MFLEX收入下游分布
2009-2014年台郡科技产量与产能利用率
2005-2015年台郡收入与毛利率
2005-2015年台郡收入与运营利润率
2013年10月-2015年10月台郡月度收入与年增率
2013-2014 台郡收入下游应用分布
2015台郡收入下游应用分布
2009-2013年台郡FPC层数分布
2015年3季度台郡资产负债表
2015年3季度台郡现金流
嘉联益关联公司关系
嘉联益组织结构
2006-2015年嘉联益收入与运营利润率
2013年10月-2015年10月嘉联益收入与年增率
2014年3季度嘉联益资产负债表
2014年嘉联益收入客户分布
嘉联益各项产品产能
嘉联益各工厂主要业务
2014年嘉联益大陆三子公司财务数据
2009-2015年旭软收入与营业利润率
2013年1月-2015年1月旭软每月收入与增幅
2006-2015年安捷利实业收入与毛利率
2006-2015年安捷利实业收入与运营利润
2009-2015年安捷利实业收入业务分布
安捷利主要客户
厦门弘信电子科技股份有限公司近四年财务指标
2011-2014H1年厦门弘信电子产能与产量
2011-2014H1年厦门弘信电子销量与ASP
2013\2014H1年厦门弘信电子客户分布
2007-2015年SI FLEX收入与运营利润
SI FLEX组织结构
FY2008-FY2016住友电气收入与营业利润率
FY2009-FY2016住友电气收入产品分布
FY2008-FY2015住友电工FPC部门收入
DAECUCK集团
2008-2015年大德GDS收入与运营利润率
2010-2015年大德GDS收入业务分布
2005-2015年Interflex收入与运营利润率
2012年1季度-2015年4季度Interflex季度收入与营业利润率
2009年1季度-2014年4季度Interflex收入产品分布
2009-2015年Interflex收入客户分布
2009-2012年Interflex产能
深圳市精诚达电路组织结构
2005-2015年 BHflex收入与运营利润
范桓株式会社组织结构
2013-2015 BHflex收入下游分布
2013-2016年BHflex收入客户分布
2005-2015年Newflex收入与运营利润
2006-2015年FLEXCOM收入与运营利润率
2013-2016 Flexcom收入by technology
2006-2014年MFS收入与股东应得利润
2008-2011年MFS收入地域分布
毅嘉组织结构
2006-2015年毅嘉收入与运营利润率
2013年10月-2015年10月毅嘉月度收入
2014年1季度-2015年3季度毅嘉收入业务分布
2014年1季度-2015年3季度毅嘉季度毛利率
2015年毅嘉收入下游分布
ZDT Holding Structure
2008-2015年臻鼎收入与运营利润率
2008-2015年臻鼎收入与毛利率
2013年10月-2015年10月ZDT月度收入
ZDT Global Footprint
2006-2014 H1 ZDT Number of Employees
2014年臻鼎大陆子公司财务报表
2011-2015年景旺电子收入与营业利润
2011-2014年景旺电子FPC产能与产量
2011-2014年景旺电子FPC收入与ASP
2011-2014年景旺电子收入下游分布
2007-2015年台虹收入与运营利润率
2013年10月-2015年10月台虹科技月度收入与年增率
2008-2015年台虹科技收入业务分布
2009-2012年台虹FCCL产品收入结构
2011-2014年台虹资产负债表
2011-2014年台虹现金流
2009-2015年新扬科技收入与营业利润率
2013年10月-2015年10月新扬科技收入与年增率
2008-2015财年新日本制铁化学收入与运营利润
2006-2015财年新日本制铁化学收入产品分布
2006-2016财年有泽制造所收入与运营利润率
2006-2015财年有泽制造所收入产品分布
2003-2014年律胜科技收入与运营利润率
2013年10月-2015年10月律胜科技收入与年增率
2007-2015年亚洲电材收入与运营利润率
2013年10月-2015年10月亚洲电材月度收入与增幅
亚洲电材组织结构
2011年亚洲电材收入产品分布
2005-2015年达迈科技收入与运营利润率
2013年10月-2015年10月达迈科技每月收入与增幅
2011年全球主要PI厂家市场占有率
2005-2015年INNOX收入与运营利润率
2011-2015年INNOX收入产品分布
2014年INNO收入客户分布
Structure of Single-sided FPCB
Structure of Double-sided FPCB
Block Diagram of “Single-sided FPCB + Single-sided FPCB”
Block Diagram of Double-sided FPCB
Block Diagram of COF
Schematic Diagram of Rigid and Flex PCB
FPCB Manufacturing Process
Work Concept of Exposure Machine
Imaging
Etching
Film Stripping
Hot Pressing
FPCB Market Size, 2007-2016
FPCB Market by Application, 2013 & 2017E
Quarterly HDD Shipment, Q4 2012-Q3 2015
HDD Shipment, 2009-2016
Market Share of Global Major HDD Companies, 2015
Global Mobile Phone Shipment, 2007-2016
Worldwide Mobile Phone Sales to End Users by Vendor, 2012-2013
Shipment of Global Top 10 Mobile Phone Companies, 2013-2015
Worldwide Smartphone Sales to End Users by Vendor, 2012-2015
Worldwide Smartphone Sales to End Users by Operating System, 2012-2015
Monthly Shipment of Chinese Mobile Phone Market, Oct.2014-Oct.2015
Market Share of Major Companies in Chinese Smartphone Market, 2014
Market Share of Major Companies in Chinese Smartphone Market, 2014-2015
Laptop Computer Shipment, 2008-2015
Shipment of Global Major Laptop Computer ODM Companies, 2010-2014
Global Tablet PC Shipment, 2011-2016E
Shipment of Top Five Tablet PC Vendors, Q4 2014
Shipment, Market Share and Growth of Top Five Tablet PC Vendors, 2014
Touch Screen Industry Chain
Touch Industry Supply Chain and Eco-system
Global Touch Screen Market Size, 2010-2016E
Global Touch Screen Market Size (Shipment), 2010-2016E
Development Trends of Global Smartphone Touch Technology, 2013-2017E
Medium-sized Touch Screen by Technology, 2011-2015
Laptop Touch Screen Shipment by Technology, 2012-2016E
Global Automotive PCB Market Size, 2011-2019E
Automotive PCB Market by Position, 2015&2020E
Global Major FPCB Players
Taiwan's FPCB Industry Chain
Revenue of Global FPCB Industry by Region, 2009-2015E
Revenue of Global FPCB Industry by Region, 2010-2011
FPCB Supply Relationship in Hard Disk Field
FPCB Supply Relationship in CD Driver Field
FPCB Supply Relationship in Mobile Phone Field
Major FPCB Suppliers of Samsung by Value, 2011-2013
Major FPCB Suppliers of Apple by Value, 2011-2014
Ranking of Japanese FPC Companies by Revenue, 2010-2015
Ranking of South Korean FPC Companies by Revenue, 2012-2015
Ranking of South Korean FPC Companies by Operating Margin, 2009-2015
Ranking of Taiwanese FPC Companies by Revenue, 2010-2015
Ranking of Taiwanese FPC Companies by Operating Margin, 2009-2015
Ranking of Major Global FPCB Companies by Revenue, 2009-2015
Bases of Fujikura in Thailand
Revenue and Operating Profit of Fujikura, FY2006-FY2016
Revenue of Fujikura by Division, FY2008-FY2013
Revenue of Fujikura by Product, FY2014-FY2016
Operating Profit of Fujikura by Business, FY2013-FY2016
Revenue of Fujikura's FPC Segment, FY2008-FY2016
Revenue and Operating Margin of NOK, FY2001-FY2016
Organizational Structure of Mektron
Revenue of NOK by Product, FY2006-FY2016
Operating Profit of NOK by Product, FY2013-FY2016
Revenue of NOK by Region, FY2010-FY2016
Revenue of Mektron's FPC Division by Region, FY2010-FY2016
Global Presence of Mektron
Revenue and Operating Profit of Mektec Manufacturing Corporation (Zhuhai), 2004-2014
Revenue and Operating Margin of Nitto Denko, FY2006-FY2016
Revenue of Nitto Denko by Business, FY2013-FY2015
Operating Profit of Nitto Denko by Business, FY2013-FY2015
Finanial Data of Dexerials Suzhou, 2004-2010
Revenue and Operating Profit of M-Flex, FY2004-FY2015
Revenue of M-Flex by Region, FY2010-FY2014
Revenue of M-Flex by Country, FY2012-FY2014
Operating Profit of M-Flex by Region, FY2006-FY2013
Customer Structure of M-Flex, FY2006-FY2015
Revenue of M-Flex by Application, Q1 2011-Q2 2015
Output and Capacity Utilization of Flexium, 2009-2014
Revenue and Gross Margin of Flexium, 2005-2015
Revenue and Operating Margin of Flexium, 2005-2015
Monthly Revenue and Annual Growth Rate of Flexium, Oct.2013-Oct.2015
Revenue of Flexium by Application, 2013-2014
Revenue of Flexium by Application, 2015
FPC Layers of Flexium, 2009-2013
Cash Flow of Flexium, Q3 2015
Associated Companies of Career
Organizational Structure of Career
Divisions of Career
Revenue and Operating Margin of Career, 2006-2015
Revenue and Annual Growth Rate of Career, Oct.2013-Oct.2015
Balance Sheet of Career, Q3 2014
Revenue of Career by Client, 2014
Capacity of Career by Product
Major Business of Career by Plant
Financial Data of Three Mainland Chinese Subsidiaries of Career, 2014
Revenue and Operating Margin of Sunflex, 2009-2015
Monthly Revenue and Growth Rate of Sunflex, Oct.2013-Oct.2015
Revenue and Gross Margin of AKM, 2006-2015
Revenue and Operating Profit of AKM, 2006-2015
Revenue of AKM by Business, 2009-2015
Major Clients of AKM
Financial Indicators of Xiamen Hongxin Electron-Tech, 2011-2014
Capacity and Output of Xiamen Hongxin Electron-Tech, 2011-2014H1
Sales Volume and ASP of Xiamen Hongxin Electron-Tech, 2011-2014H1
Client Distribution of Xiamen Hongxin Electron-Tech, 2013-2014H1
Revenue and Operating Profit of SI Flex, 2007-2015
Organizational Structure of SI Flex
Revenue and Operating Margin of Sumitomo Electric Industries, FY2008-FY2016
Revenue of Sumitomo Electric Industries by Business, FY2009-FY2016
Operating Profit of Sumitomo Electric Industries by Business, FY2011-FY2015
Revenue of FPC Division of Sumitomo Electric Industries, FY2008-FY2015
Revenue and Operating Margin of Daeduck GDS, 2008-2015
Revenue of Daeduck GDS by Business, 2010-2015
Revenue and Operating Margin of Interflex, 2005-2015
Quarterly Revenue and Operating Margin of Interflex, Q1 2012-Q4 2015
Quarterly Revenue of Interflex by Product, Q1 2009-Q1 2014
Revenue of Interflex by Customer, 2009-2015
Capacity of Interflex, 2009-2012
Organizational Structure of Shenzhen JCD Circuit Technology
Revenue and Operating Profit of BHflex, 2005-2015
Organizational Structure of BHflex
Revenue of BHflex by Application, 2013-2015
Revenue of BHflex by Client, 2013-2016
Revenue and Operating Profit of Newflex, 2005-2015
Revenue and Operating Margin of Flexcom, 2006-2015
Revenue of Flexcom by Technology, 2013-2016
Revenue and Profit Attributable to Shareholders of MFS, 2006-2014
Revenue of MFS by Region, 2008-2011
Organizational Structure of Ichia
Revenue and Operating Margin of Ichia, 2006-2015
Monthly Revenue of Ichia, Oct.2013-Oct.2015
Quarterly Revenue of Ichia by Business, Q1 2014-Q3 2015
Quarterly Gross Margin of Ichia, Q1 2014-Q3 2015
Revenue of Ichia by Application, 2015
Holding Structure of ZDT
Revenue and Operating Margin of ZDT, 2008-2015
Revenue and Gross Margin of ZDT, 2008-2015
Monthly Revenue of ZDT, Oct.2013-Oct.2015
Global Footprint of ZDT
Number of Employees of ZDT, 2006-2014H1
Financial Statements of ZDT's Subsidiaries in Mainland China, 2014
Revenue and Operating Profit of Kinwong, 2011-2015
FPC Output and Capacity of Kinwong, 2011-2014
FPC Revenue and ASP of Kinwong, 2011-2014
Revenue of Kinwong by Application, 2011-2014
Revenue and Operating Margin of Taiflex, 2007-2015
Monthly Revenue and Annual Growth Rate of Taiflex, Oct.2013-Oct.2015
Revenue of Taiflex by Business, 2008-2015
FCCL Product Revenue Structure of Taiflex, 2009-2012
Balance Sheet of Taiflex, 2011-2014
Cash Flow of Taiflex, 2011-2014
Revenue and Operating Margin of ThinFlex, 2009-2015
Revenue and Annual Growth Rate of ThinFlex, Oct.2013-Oct.2015
Revenue and Operating Profit of Nippon Steel Chemical, FY2008-FY2015
Revenue Structure of Nippon Steel Chemical by Product, FY2006-FY2015
Revenue and Operating Margin of Arisawa, FY2006-FY2016
Revenue of Arisawa by Product, FY2006-FY2015
Revenue and Operating Margin of Microcosm, 2003-2014
Revenue and Annual Growth Rate of Microcosm, Oct.2013-Oct.2015
Revenue and Operating Margin of AEM, 2007-2015
Monthly Revenue and Growth Rate of AEM, Oct.2013-Oct.2015
Organizational Structure of AEM
Revenue of AEM by Product, 2011
Revenue and Operating Margin of Taimide, 2005-2015
Monthly Revenue and Growth Rate of Taimide, Oct.2013-Oct.2015
Market Share of Global Major PI Companies, 2011
Revenue and Operating Margin of INNOX, 2005-2015
Revenue of INNOX by Product, 2011-2015
Revenue of INNOX by Client, 2014
如果这份报告不能满足您的要求,我们还可以为您定制报告,请 留言说明您的详细需求。
|