|
|
|
报告导航:研究报告—
制造业—材料
|
|
2016-2020年全球及中国锂电池电解液行业研究报告 |
 |
字数:2.3万 |
页数:110 |
图表数:159 |
|
中文电子版:9000元 |
中文纸版:4500元 |
中文(电子+纸)版:9500元 |
|
英文电子版:2150美元 |
英文纸版:2300美元 |
英文(电子+纸)版:2450美元 |
|
编号:ZHP033
|
发布日期:2016-01 |
附件:下载 |
 |
|
|
在新能源汽车和工业储能等新兴应用市场发展的带动下,全球锂电池电解液市场稳步增长, 2015年销量达到11.7万吨,同比增长42.1%,预计2020年销量有望突破60万吨。
中国是全球最大的锂电池电解液消费国,2015年中国锂电池电解液销量为6.3万吨,同比增长48.9%;产值为28.6亿元,同比增长52.2%。产值增速大于销量增速主要因为:一、功能型电解液(价格高于常规性电解液)销量占比提升;二、原材料价格大幅上涨推动电解液价格止跌上扬,从2015年初的9万元/吨大幅上涨至年末的20万元/吨以上,预计2016年将继续呈上涨趋势。
从下游应用领域来看,电动汽车、储能将成为锂电池的主要增长点。2015年全球电动汽车动力锂电池出货量达20.8GWh,同比增长超过110%,预计2016-2020年出货量的年复合增长率将维持在50%以上。而以智能手机、平板电脑为代表的消费电子用小型锂电池出货量增速明显放缓,预计未来增速为5%-10%。
从发展趋势看,耐高压、耐高温的电解液将成为未来的发展重点,主要因为:一、消费电子领域,4.35V以上高压电解液的应用比例现已达到70%左右,未来还将进一步攀升;二、动力及储能电池领域,高电压正极材料发展迅速,而与之匹配的电解液则相对落后,仅日本和美国少数企业掌握了5V高压电解液的生产技术,中国大部分企业虽已着手进行高压电解液的研发,但整体水平与国际存在一定差异。
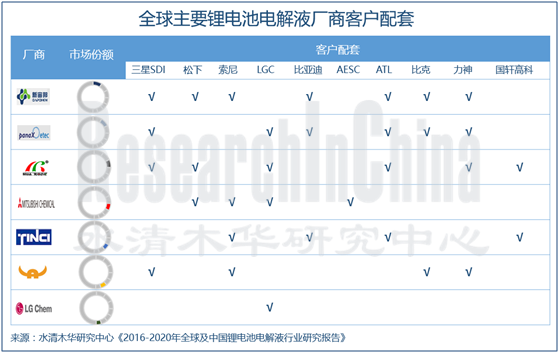
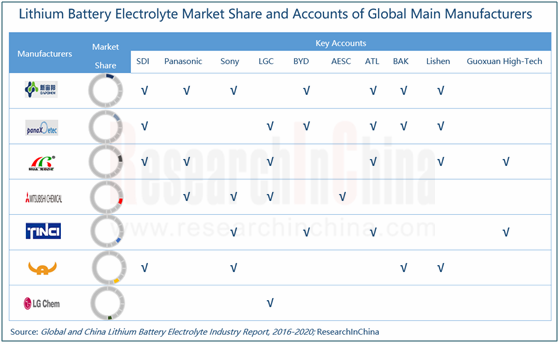
从竞争格局看,全球锂电池电解液市场集中度相对较高,2015年全球前十大电解液企业市场份额合计约62.2%。其中,新宙邦取代韩国旭成成为全球最大的锂电池电解液生产商,市场份额9.2%,韩国旭成则以8.8%的市场份额排名第二。同期,中国前十大电解液生产商市场份额合计则超过85%。
韩国旭成:最大的锂电池电解液客户是三星SDI,销量占比在55%左右。此外,公司部分电解液专利也是与三星SDI共同拥有。
三菱化学:由于看好中国新能源汽车市场,已在中国布局了锂电池电解液生产基地(常熟)和负极材料生产基地(青岛),其中锂电池电解液产能为10,000吨/年。
新宙邦:2014年,公司通过收购张家港瀚康化工有限公司(生产锂电池添加剂)76%的股权,切入电解液上游产业。2015年将锂电池电解液产能扩充至20,000吨/年,但产能利用率尚待提高。
国泰华荣:2015年,“5,000吨/年的锂电池电解液项目”正式投产,至此公司锂电池电解液产能扩充至10,000吨/年。此外,公司还设立韩国国泰华荣有限会社,配合韩国客户进行锂电池电解液的研发。
水清木华研究中心《2016-2020年全球及中国锂电池电解液行业研究报告》着重研究了以下内容:
 全球锂电池电解液发展历程、市场规模、竞争格局、发展趋势等情况; 全球锂电池电解液发展历程、市场规模、竞争格局、发展趋势等情况;
中国锂电池电解液市场规模、市场价格、竞争格局等情况;
锂电池电解液主要上下游产业市场规模、竞争情况等;
国外6家、中国10家锂电池电解液生产商经营情况、客户配套、产品产销等情况。
Driven by emerging application markets such as new energy vehicles and industrial energy storage, the global lithium battery electrolyte market has been growing steadily. In 2015, the sales volume jumped by 42.1% year on year to 117,000 tons; and it is expected to exceed 600,000 tons in 2020.
As the world's largest consumer of lithium battery electrolyte, China sold 63,000 tons of lithium battery electrolyte in 2015, up 48.9% year on year; the output value amounted to RMB2.86 billion, a year-on-year surge of 52.2%. The output value grew faster than the sales volume mainly because: First, functional electrolyte which is expensive than conventional electrolytic accounted for a rising proportion of the sales volume. Second, the soaring raw material prices pushed up the electrolyte price from RMB90,000/ton in early 2015 to over RMB200,000/ton at the end of the year. The uptrend is expected to continue in 2016.
By applications, electric vehicle and energy storage will become major growth engines of lithium batteries. The global shipment of electric vehicle power lithium battery surged beyond 110% year on year to 20.8GWh in 2015, and will grow at the CAGR of above 50% in 2016-2020. However, the shipment of small lithium batteries used for consumer electronics represented by smart phones and tablet PCs will see sharp slowdown with an expected growth rate of 5% -10% in the future.
Concerning the development trend, high voltage and temperature-resistant electrolyte will be the focus, mainly because: First, high voltage electrolyte (above 4.35V) makes up about 70% in the consumer electronics field, and the proportion will rise further in future. Second, high-voltage cathode materials are developing rapidly in the field of power and energy storage batteries, but the high-voltage resistant electrolyte is relatively backward now; only a small number of Japanese and American companies master high-voltage 5V electrolyte production technology, and the majority of Chinese enterprises have embarked on R & D of high-voltage electrolyte, but lagging behind the international level.
In terms of competitive landscape, the global lithium battery electrolyte market is highly concentrated. In 2015, the world's top ten electrolyte companies seized the combined market share of approximately 62.2%. Capchem replaced Panax-Etec to become the world's largest manufacturer of lithium battery electrolyte with the market share of 9.2%, and Panax-Etec ranked second with 8.8%. Over the same period, China's top ten electrolyte manufacturers occupied the combined market share of over 85%.
Panax-Etec sells 55% of its products to its biggest lithium electrolyte client -- Samsung SDI. In addition, the company shares some of its electrolyte patents with Samsung SDI.
Being optimistic about Chinese new energy vehicle market, Mitsubishi Chemical has set up lithium battery electrolyte production base (Changshu city) and anode material production base (Qingdao city) in China, with the lithium battery electrolyte capacity of 10,000 t/a.
Capchem acquired 76% stake in Zhangjiagang Hicomer Chemical Co., Ltd. (a producer of lithium battery additives) in 2014 to get involved in the upstream electrolyte industry chain. In 2015, it raised the lithium battery electrolyte capacity to 20,000 t/a, but its capacity utilization desired to be improved.
Guotai Huarong put its 5,000 t/a lithium battery electrolyte project into operation formally in 2015, so that the company’s lithium battery electrolyte capacity was expanded to 10,000 t/a. In addition, the company has also established South Korea Guotai Huarong to cooperate with South Korean customers in R & D of lithium battery electrolyte.
Global and China Lithium Battery Electrolyte Industry Report, 2016-2020 by ResearchInChina highlights the followings:
 Development history, market size, competition pattern, development trend, etc. of lithium battery electrolyte worldwide; Development history, market size, competition pattern, development trend, etc. of lithium battery electrolyte worldwide;
Market size, market price, competitive landscape, etc. of lithium battery electrolyte industry in China;
Market size, competition, etc. of main upstream and downstream lithium battery electrolyte industries;
Operation, customers, production, marketing, etc. of six foreign and ten Chinese lithium battery electrolyte manufacturers.
第一章 锂电池电解液行业简介
1.1 定义
1.2 分类
1.3 产业链
第二章 全球锂电池电解液市场现状
2.1 发展历程
2.2 市场规模
2.3市场格局
2.4 主要生产国
2.4.1 日本
2.4.2 韩国
2.5 发展趋势
第三章 中国锂电池电解液市场现状
3.1 行业现状
3.2 市场规模
3.3 价格
3.4 企业竞争格局
3.5 发展趋势
第四章 锂电池电解液上下游市场
4.1 上游产业现状
4.1.1 六氟磷酸锂
4.1.2 碳酸锂
4.1.3 溶剂
4.1.4 添加剂
4.2 下游应用领域
4.2.1 消费电子(3C)
4.2.2 电动汽车
4.2.3 工业储能
第五章 锂电池市场现状
5.1 市场规模
5.1.1 全球
5.1.2 中国
5.2 市场结构
5.2.1 全球
5.2.2 中国
5.3 竞争格局
5.3.1 全球
5.3.2 中国
第六章 国外锂电池电解液重点企业
6.1 三菱化学株式会社
6.1.1 基本介绍
6.1.2 发展历程及展望
6.1.3 生产基地
6.1.4 锂电池电解液业务
6.1.5 在华布局
6.1.6 核心竞争力
6.1.7 经营数据
6.2 宇部兴产株式会社
6.2.1 基本介绍
6.2.2 关联公司
6.2.3 发展历程及展望
6.2.4 主要产品
6.2.5 锂电池电解液业务
6.2.6 核心竞争力
6.2.7 经营数据
6.3 韩国旭成化学有限公司
6.3.1 基本介绍
6.3.2 发展历程
6.3.3 锂电池电解液业务
6.4 LG化学
6.4.1 基本介绍
6.4.2 发展历程及展望
6.4.3 锂电池电解液业务
6.4.4 核心竞争力
6.4.5 经营数据
6.5 其他企业
6.5.1 巴斯夫集团(BSF)
6.5.2 三井化学株式会社(Mitsui Chemicals, Inc.)
第七章 中国锂电池电解液重点企业
7.1 深圳新宙邦科技股份有限公司
7.1.1 基本介绍
7.1.2 关联公司
7.1.3 发展历程及展望
7.1.4 产品、技术及解决方案
7.1.5 客户配套
7.1.6 产能及基地布局
7.1.7 产品产销、营收
7.1.8 核心竞争力
7.1.9 经营数据
7.2 张家港市国泰华荣化工新材料有限公司
7.2.1 基本介绍
7.2.2 关联公司
7.2.3 发展历程及展望
7.2.4 产品、技术及解决方案
7.2.5 客户配套
7.2.6 产品产销、营收及价格
7.2.7 核心竞争力
7.2.8 经营数据
7.3 广州天赐高新材料股份有限公司
7.3.1 基本介绍
7.3.2 关联公司
7.3.3 发展历程及展望
7.3.4 产品、技术及解决方案
7.3.5 客户配套
7.3.6 营销网络
7.3.7 产品产销
7.3.8 核心竞争力
7.3.9 经营数据
7.4 天津金牛电源材料有限责任公司
7.4.1 基本介绍
7.4.2 关联公司
7.4.3 发展历程及展望
7.4.4 客户配套
7.4.5 产品产销
7.4.6 核心竞争力
7.5 东莞市杉杉电池材料有限公司
7.5.1 基本介绍
7.5.2 关联公司
7.5.3 发展历程及展望
7.5.4 产品、技术及解决方案
7.5.5 客户配套
7.5.6 供应体系
7.5.7 产品产销
7.5.8 核心竞争力
7.5.9 经营数据
7.6 其他企业
7.6.1 珠海市赛纬电子材料有限公司
7.6.2 北京化学试剂研究所
7.6.3 汕头市金光高科有限公司
7.6.4 湖州创亚动力电池材料有限公司
7.6.5 香河昆仑化学制品有限公司
第八章 总结与预测
8.1 市场
8.2 企业
1 Overview of Lithium Battery Electrolyte Industry
1.1 Definition
1.2 Classification
1.3 Industry Chain
2 Status Quo of Global Lithium Battery Electrolyte Market
2.1 Development History
2.2 Market Size
2.3 Market Structure
2.4 Major Producers
2.4.1 Japan
2.4.2 South Korea
2.5 Development Trend
3 Status Quo of China Lithium Battery Electrolyte Market
3.1 Current Situation
3.2 Market Size
3.3 Price
3.4 Enterprise Competition
3.5 Development Trend
4 Upstream and Downstream Segments of Lithium Battery Electrolyte Industry
4.1 Upstream Segments
4.1.1 Lithium Hexafluorophosphate
4.1.2 Lithium Carbonate
4.1.3 Solvent
4.1.4 Additives
4.2 Downstream Applications
4.2.1 Consumer Electronics (3C)
4.2.2 Electric Vehicle
4.2.3 Industrial Energy-storage Market
5 Status Quo of Lithium Battery Market
5.1 Market Size
5.1.1 Global
5.1.2 China
5.2 Market Structure
5.2.1 Global
5.2.2 China
5.3 Competition Pattern
5.3.1 Global
5.3.2 China
6 Key Players in the World
6.1 Mitsubishi Chemical Corporation
6.1.1 Profile
6.1.2 Development History and Prospects
6.1.3 Production Base
6.1.4 Lithium Battery Electrolyte Business
6.1.5 Layout in China
6.1.6 Core Competitiveness
6.1.7 Operating Data
6.2 UBE Industries, Ltd.
6.2.1 Profile
6.2.2 Affiliates
6.2.3 Development History and Prospects
6.2.4 Main Products
6.2.5 Lithium Battery Electrolyte Business
6.2.6 Core Competitiveness
6.2.7 Operating Data
6.3 Panax-Etec Co., Ltd.
6.3.1 Profile
6.3.2 Development History
6.3.3 Lithium Battery Electrolyte Business
6.4 LG Chem
6.4.1 Profile
6.4.2 Development History and Prospects
6.4.3 Lithium Battery Electrolyte Business
6.4.4 Core Competitiveness
6.4.5 Operating Data
6.5 Others
6.5.1 BSF
6.5.2 Mitsui Chemicals, Inc.
7 Key Players in China
7.1 Shenzhen Capchem Technology Co., Ltd.
7.1.1 Profile
7.1.2 Affiliates
7.1.3 Development History and Prospects
7.1.4 Products, Technologies, and Solutions
7.1.5 Customers
7.1.6 Capacity and Base Layout
7.1.7 Output, Sales Volume and Revenue
7.1.8 Core Competitiveness
7.1.9 Operating Data
7.2 Zhangjiagang Guotai Huarong Chemical New Material Co., Ltd.
7.2.1 Profile
7.2.2 Affiliates
7.2.3 Development History and Prospects
7.2.4 Products, Technologies, and Solutions
7.2.5 Customers
7.2.6 Output, Sales Volume, Revenue and Price
7.2.7 Core Competitiveness
7.2.8 Operating Data
7.3 Guangzhou Tinci Materials Technology Co., Ltd.
7.3.1 Profile
7.3.2 Affiliates
7.3.3 Development History and Prospects
7.3.4 Products, Technologies, and Solutions
7.3.5 Customers
7.3.6 Marketing Network
7.3.7 Output and Sales Volume
7.3.8 Core Competitiveness
7.3.9 Operating Data
7.4 Tianjin Jinniu Power Sources Material Co., Ltd.
7.4.1 Profile
7.4.2 Affiliates
7.4.3 Development History and Prospects
7.4.4 Customers
7.4.5 Output and Sales Volume
7.4.6 Core Competitiveness
7.5 Dongguan Shanshan Battery Materials Co., Ltd.
7.5.1 Profile
7.5.2 Affiliates
7.5.3 Development History and Prospects
7.5.4 Products, Technologies, and Solutions
7.5.5 Customers
7.5.6 Supply System
7.5.7 Output and Sales Volume
7.5.8 Core Competitiveness
7.5.9 Operating Data
7.6 Others
7.6.1 Zhuhai Smoothway Electronic Materials Co., Ltd.
7.6.2 Beijing Institute of Chemical Reagents
7.6.3 Shantou Jinguang High-Tech Co., Ltd.
7.6.4 Huzhou Chuangya Power Battery Materials Co., Ltd.
7.6.5 Xianghe Kunlun Chemical Co., Ltd.
8 Summary and Forecast
8.1 Market
8.2 Enterprises
图:锂离子电池主要构成材料
表:电解液组成材料
表:锂电池电解液分类
图:锂电池产业链
图:全球锂电池电解液发展历程
图:2012-2020年全球锂电池电解液市场规模及增速
图:2011-2020年全球锂电池电解液销量及增速
图:2011-2016年全球锂电池电解液(分地区)销量构成
表:2015年全球主要锂电池电解液制造商销量及主要客户
图:2014年全球电解液厂商市场份额
图:2015年全球电解液厂商市场份额
图:2011-2016年日本锂电池电解液销量
图:2011-2016年韩国锂电池电解液销量
图:2011-2020年中国锂电池电解液销量全球占比
图:2012-2020年中国锂电池电解液市场规模及增速
图:2011-2020年中国锂电池电解液销量及增速
图:2011-2016年中国常规性电解液价格走势
图:2011-2016年中国功能型电解液价格走势
图:2015年中国主要锂电池电解液生产商营业收入及产能
图:2015年中国锂电池电解液厂商市场份额
图:LiFP6生产流程
表:LiFP6国内外技术差异
图:2015年电解液成本构成
图:2011-2020年中国LiFP6产量
图:2014年全球LiFP6企业竞争格局
图:2014年中国LiFP6企业竞争格局
图:2015年全球主要LiFP6厂商产能
表:2015年中国主要厂商LiFP6项目
图:2015年LiFP6生产成本构成
图:2009-2016年全球LiFP6价格走势
图:2010-2020年全球及中国碳酸锂产量
图:2014-2015年全球碳酸锂需求结构
图:2010-2020年中国碳酸锂表观消费量
图:2014年全球碳酸锂市场竞争格局
图:2014年中国碳酸锂市场竞争格局
表:中国部分企业高纯碳酸锂产能
图:2013-2015年中国电池级碳酸锂价格
图:2011-2020年全球锂电池电解液溶剂产量
表:碳酸酯溶剂国内外产业现状
图:2014-2020年全球锂电池电解液添加剂市场规模
图:2012-2020年全球锂电池需求结构
图:2013-2020年全球消费电子锂电池需求量及增速
图:2012-2020年全球手机销量及锂电池需求量
图:2012-2020年全球平板电脑销量及锂电池需求量
表:2013-2015年全球平板电脑市场竞争格局
图:2012-2020年全球笔记本电脑销量及锂电池需求量
图:2012-2020年全球电子烟销量及占比
图:2011-2020年全球电动乘用车(EV&PHEV)销量
图:2010-2050年全球电动汽车销量预测
表:全球主要电动汽车电池容量及续航能力
图:2011-2020年全球电动乘用车单车电池容量
图:2011-2020年全球电动乘用车动力锂电池需求
图:2011-2020年全球电动汽车动力锂电池需求(分类型)
图:2011-2020年中国电动乘用车(EV&PHEV)销量
图:2011-2020年中国电动乘用车销量占全球比重
图:2011-2020年中国动力锂电池需求(分类型)
图:2010-2016年中国动力锂电池产业规模与占比
图:2009-2016年中国移动基站数量
图:2015/2020年中国储能锂电池需求量
图:2020年中国储能锂电池(分领域)需求结构
2014-2020年储能(分应用领域)需求(单位:MWh)
表:中国储能电池制造商
图:锂电池结构
图:2014年全球电池产品结构
图:2011-2020年全球锂电池市场需求及规模
图:2011-2020年中国锂电池销量及市场规模
图:2007-2016年中国锂电池出口量及出口额
图:2011-2015全球锂电池(分国家)销量构成
图:2013-2015年中国锂电池(分省市)销量构成
图:全球锂电池厂商梯度划分
图:2014年全球小型锂电池厂商竞争格局
图:2014年全球新能源乘用车配套电池厂商份额
表:2013-2014年全球新能源乘用车配套动力锂电池出货量及份额
图:2014年中国锂电池市场竞争格局
表:中国主要锂电池制造商
图:中国动力锂电池供应体系
表:2015H1中国新能源乘用车动力电池(分技术类型)配套量占比
图:2015年上半年主力电池厂商市场份额
图:2015年上半年主力电池厂商出货量(MWh)
图:三菱化学全球营销网络
表:三菱化学主要发展历程
表:三菱化学主要生产基地分布
表:三菱化学锂电池电解液生产基地及产能分布
图:2010-2016财年三菱化学锂电池电解液销量
表:三菱化学在华主要布局
图:2008-2015财年三菱化学营业收入及营业利润
图:宇部兴产主要关联公司
表:宇部兴产主要发展历程
表:宇部兴产主要产品
图:2010-2016财年宇部兴产锂电池电解液销量
表:宇部兴产电解液生产基地
图:2009-2015财年宇部兴产营业收入及营业利润
图:韩国旭成全球布局
表:韩国旭成主要发展历程
图:2011-2016年韩国旭成锂电池电解液销量
图:LG化学全球营销网络
图:2015年LGC股权结构图
图:LG化学发展历程
图:LG化学信息电子材料业务
图:2012-2016年LG化学电解液销量
图:LG化学(分产品)锂电池电解液销量构成
图:2013-2014年LG化学经营情况
图:2014年LG化学(分产品)营业收入构成
图:2013-2014年LGC营业收入(分区域)构成
图:2011-2013年LG化学(分地区)产量
图:BSF亚太地区布局
图:BSF锂电池材料生产基地
图:三井化学全球布局
图:新宙邦全球产业布局
表:新宙邦关联公司
表:新宙邦主要发展历程
表:新宙邦主要锂电池电解液产品
图:2011-2014年新宙邦研发资金投入
表:新宙邦锂电池电解液客户配套
图:2011-2015新宙邦锂电池电解液产能
图:新宙邦生产基地及营销网络
图:2006-2016年新宙邦锂电池电解液销量及增速
图:2011-2015年新宙邦锂电池电解液营业收入
图:新宙邦核心竞争力分析
图:2009-2015年新宙邦营业收入及净利润
表:国泰华荣关联公司
表:2000-2014年国泰华荣主要发展历程
表:国泰华荣主要产品
表:国泰华荣待开发产品
表:国泰华荣锂电池电解液客户配套
图:2011-2015年国泰华荣锂电池电解液销量及营收
图:国泰华荣核心竞争力分析
图:2008-2015年国泰华荣营业收入及净利润
表:天赐材料关联公司
表:天赐材料主要发展历程
表:天赐材料主要产品
表:天赐材料锂电池电解液客户配套
图:天赐材料中国营销网络
表:天赐材料锂电池电解液产能
图:2010-2016年天赐材料锂电池电解液销量及毛利率
图:天赐材料核心竞争力分析
图:2009-2015年天赐材料营业收入及净利润
表:天津金牛关联公司
表:天津金牛主要发展历程
表:天津金牛锂电池电解液客户配套
图:2011-2016年天津金牛锂电池电解液销量
图:天津金牛核心竞争力分析
表:东莞杉杉关联公司
表:东莞杉杉主要发展历程
表:东莞杉杉主要电解液产品
表:东莞杉杉锂电池电解液客户配套
表:东莞杉杉供应商
图:2009-2016年东莞杉杉锂电池电解液销量
图:2009-2015年东莞杉杉营业收入及净利润
表:2015年赛纬电子主要产品产能
图:2013-2016年赛纬电子电解液销量
图:2013-2016年北化所电解液销量
图:2013-2016年金光高科电解液销量
图:2012-2015年创亚动力营业收入及净利润
图:2012-2020年全球及中国锂电池电解液销量增速
图:2015年全球锂电池电解液销量结构
图:2014-2020年全球锂电池下游需求增速
图:2009-2015年全球主要锂电池电解液生产商营业收入增速
图:2014年全球锂电池电解液市场竞争格局
Key Composition of Lithium ion Battery
Electrolyte Composition
Classification of Lithium Battery Electrolyte
Lithium Battery Industry Chain
Global Lithium Battery Electrolyte Development History
Global Lithium Battery Electrolyte Market Size and Growth Rate, 2012-2020E
Sales Volume and Growth Rate of Global Lithium Battery Electrolyte, 2011-2020E
Sales Structure of Global Lithium Battery Electrolyte by Region, 2011-2016
Sales Volume of Key Global Lithium Battery Electrolyte Manufacturers and Their Major Customers, 2015
Market Share of Global Electrolyte Manufacturers, 2014
Market Share of Global Electrolyte Manufacturers, 2015
Sales Volume of Lithium Battery Electrolyte in Japan, 2011-2016E
Sales Volume of Lithium Battery Electrolyte in South Korea, 2011-2016E
Proportion of China’s Lithium Battery Electrolyte in Global Total by Sales Volume, 2011-2020E
Lithium Battery Electrolyte Market Size and Growth Rate in China, 2012-2020E
Sales Volume and Growth Rate of Lithium Battery Electrolyte in China, 2011-2020E
Conventional Electrolyte Price Trend in China, 2011-2016E
Functional Electrolyte Price Trend in China, 2011-2016E
Revenue and Capacity of Lithium Battery Electrolyte Manufacturers in China, 2015
Market Share of Lithium Battery Electrolyte Manufacturers in China, 2015
Production Process of LiFP6
Differences between Domestic and Foreign LiFP6 Technologies
Cost Structure of Electrolyte, 2015
LiFP6 Output in China, 2011-2020E
Competitive Landscape of Global LiFP6 Enterprises, 2014
Competitive Landscape of Chinese LiFP6 Enterprises, 2014
Capacity of Major Global LiFP6 Manufacturers, 2015
LiFP6 Projects of Major Chinese Manufacturers, 2015
LiFP6 Production Cost Structure, 2015
Global LiFP6 Price Trend, 2009-2016E
Global and China’s Lithium Carbonate Output, 2010-2020E
Global Lithium Carbonate Demand Structure, 2014-2015
Lithium Carbonate Apparent Consumption in China, 2010-2020E
Competitive Landscape of Global Lithium Carbonate Market, 2014
Competitive Landscape of Chinese Lithium Carbonate Market, 2014
High Purity Lithium Carbonate Capacity of Some Chinese Companies
Battery Lithium Carbonate Price in China, 2013-2015
Global Lithium Battery Electrolyte Solvent Output, 2011-2020E
Status Quo of Domestic and Foreign Carbonate Solvent Industries
Global Lithium Battery Electrolyte Additive Market Size, 2014-2020E
Demand Structure of Global Lithium Batteries, 2012-2020E
Demand and Growth Rate of Global Consumer Electronics Lithium-ion Batteries, 2013-2020E
Global Mobile Phone Sales Volume and Lithium Battery Demand, 2012-2020E
Global Tablet PC Sales Volume and Lithium Battery Demand, 2012-2020E
Competitive Landscape of Global Tablet PC Market, 2013-2015
Global Laptop Sales Volume and Lithium Battery Demand, 2012-2020E
Global Electronic Cigarette Sales Volume and % of Total, 2012-2020E
Global Electric Passenger Car (EV&PHEV) Sales Volume, 2011-2020E
Global Electric Vehicle Sales Volume, 2010-2050E
Battery Capacity and Endurance of Global Major Electric Vehicles
Battery Capacity of a Single Electric Passenger Car Worldwide, 2011-2020E
Demand of Global Electric Passenger Cars for Power Batteries, 2011-2020E
Demand of Global Electric Vehicles for Power Batteries (by Type), 2011-2020E
China’s Electric Passenger Car (EV&PHEV) Sales Volume, 2011-2020E
Proportion of China’s Electric Passenger Cars in Global Total by Sales Volume, 2011-2020E
China’s Demand for Power Lithium Battery (by Type), 2011-2020E
Scale and Share of Chinese Power Lithium Battery Industry, 2010-2016E
Number of Chinese Mobile Base Stations, 2009-2016E
China’s Demand for Energy Storage Lithium Battery, 2015/2020E
Energy Storage Lithium Battery Demand Structure in China (by Sector), 2020E
Energy Storage Demand (by Application), 2014-2020E (MWh)
Energy Storage Battery Manufacturers in China
Lithium Battery Structure
Global Battery Product Structure, 2014
Global Lithium Battery Market Demand and Scale, 2011-2020E
Lithium Battery Sales Volume and Market Size in China, 2011-2020E
Lithium Battery Export Volume and Value in China, 2007-2016E
Global Lithium Battery Sales Structure (by Country), 2011-2015
Sales Structure of Lithium Batteries in China (by Province/Municipality), 2013-2015
Division of Global Lithium Battery Manufacturers
Competitive Landscape of Global Small Lithium Battery Manufacturers, 2014
Share of Global New Energy Passenger Car-use Battery Manufacturers, 2014
Global New Energy Passenger Car-use Power Lithium Battery Shipment and Share, 2013-2014
Competitive Landscape of Chinese Lithium Battery Market, 2014
Major Lithium Battery Manufacturers in China
Power Lithium Battery Supply System in China
New Energy Passenger Car-use Power Battery Supply Structure in China (by Technology), 2015H1
Market Share of Major Battery Manufacturers, 2015H1
Shipment of Major Battery Manufacturers, 2015H1 (MWh)
Global Marketing Network of Mitsubishi Chemical
Development History of Mitsubishi Chemical
Distribution of Mitsubishi Chemical’s Major Production Bases
Distribution of Mitsubishi Chemical’s Lithium Battery Electrolyte Production Bases and Capacity
Lithium Battery Electrolyte Sales Volume of Mitsubishi Chemical, FY2010-FY2016E
Main Layout of Mitsubishi Chemical in China
Revenue and Operating Income of Mitsubishi Chemical, FY2008-FY2015
Main Affiliates of UBE Industries
Development History of UBE Industries
Main Products of UBE Industries
Lithium Battery Electrolyte Sales Volume of UBE Industries, FY2010-FY2016E
Electrolyte Production Bases of UBE Industries
Revenue and Operating Income of UBE Industries, FY2009-FY2015
Panax-Etec’s Global layout
Panax-Etec’s Development History
Panax-Etec’s Lithium Battery Electrolyte Sales Volume, 2011-2016
LGC’s Global Marketing Network
LGC’s Equity Structure, 2015
LGC’s Development History
LGC’s Information Electronic Materials Business
LGC’s Electrolyte Sales Volume, 2012-2016E
LGC’s Lithium Battery Electrolyte Sales Structure (by Product)
LGC’s Operation, 2013-2014
LGC’s Revenue Structure (by Product), 2014
LGC Revenue Structure (by Region), 2013-2014
LGC’s Output (by Region), 2011-2013
BSF’s Layout in Asia-Pacific
BSF’s Lithium Battery Material Production Bases
Global Layout of Mitsui Chemicals
Capchem’s Global Industrial Distribution
Capchem’s Affiliates
Capchem’s Development History
Capchem’s Main Lithium Battery Electrolyte Products
Capchem’s R&D Investment, 2011-2014
Capchem’s Lithium Battery Electrolyte Clients
Capchem’s Lithium Battery Electrolyte Capacity, 2011-2015
Capchem’s Production Bases and Marketing Network
Capchem’s Lithium Battery Electrolyte Sales Volume and Growth Rate, 2006-2016E
Capchem’s Lithium Battery Electrolyte Revenue, 2011-2015
Capchem’s Core Competitiveness
Capchem’s Revenue and Net Income, 2009-2015
Affiliates of Guotai Huarong
Development History of Guotai Huarong, 2000-2014
Main Products of Guotai Huarong
Guotai Huarong’s Products to be Developed
Lithium Battery Electrolyte Clients of Guotai Huarong
Lithium Battery Electrolyte Sales Volume and Revenue of Guotai Huarong, 2011-2015
Core Competitiveness of Guotai Huarong
Revenue and Net Income of Guotai Huarong, 2008-2015
Tinci’s Affiliates
Tinci’s Development History
Tinci’s Main Products
Tinci’s Lithium Battery Electrolyte Customers
Tinci’s Marketing Network in China
Tinci’s Lithium Battery Electrolyte Capacity
Tinci's Lithium Battery Electrolyte Sales Volume and Gross Margin, 2010-2016E
Tinci's Core Competitiveness
Tinci's Revenue and Net Income, 2009-2015
Jinniu's Affiliates
Jinniu's Development History
Jinniu's Lithium Battery Electrolyte Customers
Jinniu's Lithium Battery Electrolyte Sales Volume, 2011-2016E
Jinniu's Core Competitiveness
Shanshan's Affiliates
Shanshan's Development History
Shanshan's Main Electrolyte Products
Shanshan's Lithium Battery Electrolyte Customers
Shanshan's Suppliers
Shanshan's Lithium Battery Electrolyte Sales Volume, 2009-2016E
Shanshan's Revenue and Net Income, 2009-2015
Smoothway Main Products Capacity, 2015
Smoothway Electrolyte Sales Volume, 2013-2016E
Electrolyte Sales Volume of Beijing Institute of Chemical Reagents, 2013-2016E
Electrolyte Sales Volume of Jinguang High-Tech, 2013-2016E
Revenue and Net Income of Chuangya Power Battery Materials, 2012-2015
Growth Rate of Global and China's Lithium Battery Electrolyte Sales Volume, 2012-2020E
Global Lithium Battery Electrolyte Sales Structure, 2015
Growth Rate of Global Lithium Battery Demand, 2014-2020E
Revenue Growth Rate of Global Major Lithium Battery Electrolyte Manufacturers, 2009-2015
Competitive Landscape of Global Lithium Battery Electrolyte Market, 2014
如果这份报告不能满足您的要求,我们还可以为您定制报告,请 留言说明您的详细需求。
|