|
|
|
报告导航:研究报告—
制造业—化工
|
|
2016-2020年全球及中国碳酸锂行业研究报告 |
 |
字数:4.1万 |
页数:141 |
图表数:144 |
|
中文电子版:8500元 |
中文纸版:4250元 |
中文(电子+纸)版:9000元 |
|
英文电子版:2200美元 |
英文纸版:2400美元 |
英文(电子+纸)版:2500美元 |
|
编号:sk001
|
发布日期:2016-01 |
附件:下载 |
 |
|
|
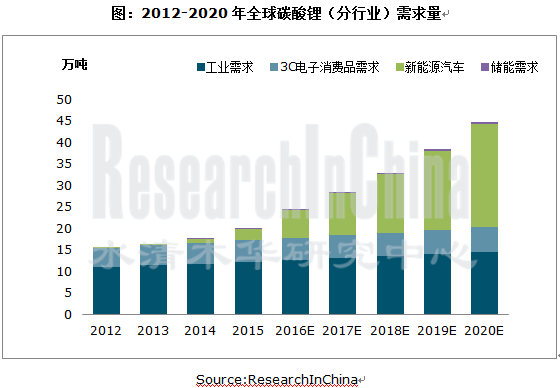
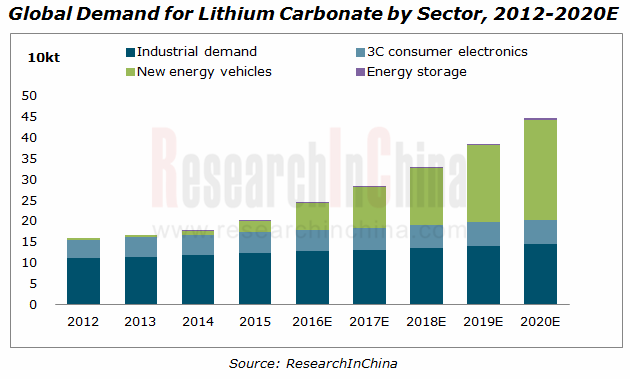
在中国新能源汽车销量急速增长的带动下,上游碳酸锂在2015年第四季度出现供不应求,价格飙升。2015年全球碳酸锂产量为20.28万吨,同比增长12.3%;预计2016-2018年全球碳酸锂产量分别为24.42万吨、28.89万吨和34.10万吨,对应增速20.4%、18.3%和18.4%。
全球新能源汽车销量的快速增长将显著拉动碳酸锂消费量。根据测算,每10万辆新能源汽车(40%电动客车、20%电动轿车、25%混合动力客车、15%混合动力轿车)将拉动5000-8000吨的电池级碳酸锂需求,相当于全球电池级碳酸锂需求量新增5%-8%。
2015年10月份以来中国碳酸锂市场呈直线上涨趋势,工业级、电池级碳酸锂均出现大幅上调,到2016年1月,工业级和电池级碳酸锂市场均价分别增至120,000元/吨和150,000元/吨,氢氧化锂电池级报价140,000元/吨。而在2015年9月时,中国碳酸锂市场价格最低点仅为50,000元/吨。2016-17年,预计全球碳酸锂需求量将超过供给量,碳酸锂价格将会这段时间内持续上涨,2017年后随着全球各新增碳酸锂产能的逐渐释放,价格也将趋于稳定。
全球锂资源主要集中在智利和中国,但由于中国碳酸锂生产企业受生产工艺限制,产能供给目前比较有限,智利和澳大利亚占据着全球主要产能。全球三大厂商SQM、FMC、Rockwood 共占市场份额56%以上,主要厂商对下游企业的议价能力很强,拥有较强的定价权,可按照市场供需情况和生产成本的变化调节价格。近年来,全球碳酸锂生产企业纷纷扩张产能以满足持续扩大的市场需求。同期,大量行业外企业纷纷新建产能,涉足碳酸锂业务,使行业集中度有所下降。
中国的碳酸锂供应商主要分为两类:一是以西藏城投为代表的盐湖供应商,二是以天齐锂业、银河资源为代表的锂辉石供应商。目前,中国盐湖的开发还处于初期阶段,产能规模较小,以天齐锂业为代表的锂辉石供应商竞争力相对较强。
2014年中国碳酸锂产量4.3万吨,同比增长16.5%;单水氢氧化锂产量2.3万吨,同比增长4.5%,产量主要集中在四川。金属锂2014年产量2,600吨,同比增长13%,全球4,000吨左右。2015年,中国碳酸锂产量为4.9万吨,而同期表观消费量达7.4万吨,供给缺口达2.50万吨。预计2020年中国碳酸锂供给缺口将达3.14万吨,进口需求仍然旺盛。
我们认为,随着中国对新能源汽车扶持力度加大,电池级碳酸锂需求将是未来的引爆点。2015年中国电池级碳酸锂需求约为2.78万吨,2020年将超过10万吨。未来几年中国碳酸锂总需求量将以20%的速度增长,快于全球平均增速,到2020年中国碳酸锂总需求约为16.7万吨。
水清木华研究中心《2016-2020年全球及中国碳酸锂行业研究报告》着重研究了以下内容:
 全球及中国碳酸锂供需关系、供应缺口,下游产业尤其是新能源汽车、储能、消费电子等行业对碳酸锂的需求等; 全球及中国碳酸锂供需关系、供应缺口,下游产业尤其是新能源汽车、储能、消费电子等行业对碳酸锂的需求等;
全球及中国竞争格局,包括国内外企业市场份额占比、产能规划、市场格局等;
中国碳酸锂进出口情况,包括进出口金额、价格以及来源和目的地等;
中国碳酸锂矿石提锂和盐湖提锂生产成本、价格趋势等;
中国锂电池行业分析,包括出货量、技术路线、市场格局等;
美国、智利、澳大利亚等国8家碳酸锂厂商经营、技术、发展规划及产销动态;
中国14家碳酸锂厂商经营、技术、发展规划及产销动态。
Driven by a surge in sales volume of new energy vehicles in China, the upstream material- lithium carbonate was in short supply in the fourth quarter of 2015 with soaring prices. Global lithium carbonate output increased by 12.3% year on year to 202,800 tons in 2015 and is expected to arrive at 244,200 tons in 2016, 288,900 tons in 2017, and 341,000 tons in 2018, a rise of 20.4%, 18.3%, and 18.4% from a year ago, respectively.
The booming sales of new energy vehicles worldwide will boost lithium carbonate consumption significantly. According to estimates, every 100,000 new energy vehicles (electric bus (40%), electric sedan (20%), hybrid bus (25%), and hybrid sedan (15%)) will create a demand of 5,000 tons to 8,000 tons of battery-grade lithium carbonate, about a rise of 5%-8% in global demand for battery-grade lithium carbonate.
The price of lithium carbonate in China has been going straight up since Oct 2015 with that of industrial-grade and battery-grade lithium carbonate rising substantially (to RMB120,000/t and RMB150,000/t in Jan 2016, respectively, when battery-grade lithium hydroxide was quoted at RMB140,000/t, compared with the bottom price of lithium carbonate standing at RMB50,000/t). It is expected that global demand for lithium carbonate will outpace supply during 2016-2017, leading to a continued price rise during this period. As new lithium carbonate capacities are gradually released after 2017, the price will tend to stabilize.
Global lithium resources are primarily concentrated in Chile and China. However, as the Chinese lithium carbonate manufacturers are restrained by production technology, the supply of capacity is limited and Chile and Australia hold the lion’s share of global capacity. The world’s top3 players- SQM, FMC, and Rockwood together seize more than 56% market share, which give them a strong bargaining power over downstream companies and powerful pricing power and allow them to adjust prices according to market supply & demand and changes in production costs. Global lithium carbonate companies have successively expanded capacity so as to meet ever-increasing market demand in recent years. Meanwhile, a large number of newcomers outside the industry build new capacity and get involved in lithium carbonate business, thus reducing the concentration of the industry.
Chinese lithium carbonate suppliers can be principally divided into two categories: salt lake providers represented by Tibet Urban Development and Investment, spodumene providers represented by Sichuan Tianqi Lithium Industries and Galaxy Resources. The exploitation of salt lakes in China is still in its infancy with small capacity, while spodumene providers represented by Sichuan Tianqi Lithium Industries are relatively competitive.
In 2014, China produced 43,000 tons of lithium carbonate, a year-on-year rise of 16.5%, 23,000 tons of lithium hydroxide monohydrate, up 4.5% over the previous year and mainly concentrated in Sichuan, and 2,600 tons of lithium metal, an increase of 13% from a year ago, compared with global output of around 4,000 tons. An output of 49,000 tons and apparent consumption of 74,000 tons caused a supply gap of 25,000 tons in 2015, and the gap is expected to reach 31,400 tons in 2020, creating brisk demand for imports.
We believe that as the Chinese government scales up its support for new energy vehicles, the demand for battery-grade lithium carbonate will be a tipping point. China’s demand for battery-grade lithium carbonate was about 27,800 tons in 2015 and is expected to exceed 100,000 tons in 2020. The country’s total demand for lithium carbonate will increase at annual rate of 20% over the next couple years, higher than the global average and approximating 167,000 tons in 2020.
Global and China Lithium Carbonate Industry Report, 2016-2020 by ResearchInChina highlights the followings:
 Global and China’s lithium carbonate supply and demand, supply gap, the demand for lithium carbonate from downstream sectors, especially new energy vehicles, energy storage, and consumer electronics; Global and China’s lithium carbonate supply and demand, supply gap, the demand for lithium carbonate from downstream sectors, especially new energy vehicles, energy storage, and consumer electronics;
Global and China’s competitive landscape, including market share of foreign and domestic companies, capacity planning, market pattern, etc.;
China’s lithium carbonate imports and exports, covering import/export value, prices, sources, destinations, etc.;
China’s production costs of lithium carbonate with lithium extracted from ores and from salt lake brine, price trends, etc.;
China’s lithium battery industry, including shipments, technology routes, market pattern, etc.;
Operation, technology, development planning, and output & sales of 8 lithium carbonate players in the United States, Chile, Australia, etc.;
Operation, technology, development planning, and output & sales of 14 Chinese lithium carbonate companies.
第一章 碳酸锂概述
1.1 锂定义
1.1.1全球锂资源分布
1.1.2 中国锂资源分布
1.2 碳酸锂用途及产品类型
1.3 碳酸锂行业产业链
1.4 碳酸锂生产工艺介绍
第二章 全球碳酸锂发展概况
2.1供应
2.2需求
2.2.1 新能源汽车对碳酸锂需求
2.2.2 3C数码消费品对碳酸锂需求
2.2.3 储能设备对碳酸锂需求
2.2.4 工业对碳酸锂需求
2.3 竞争格局
第三章 中国碳酸锂发展概况
3.1 供应
3.2 需求
3.2.1 碳酸锂总需求
3.2.2 新能源汽车对碳酸锂需求
3.2.3 工业储能对碳酸锂需求
3.3 碳酸锂工业发展现状
3.4 竞争格局
3.5 技术趋势—高纯碳酸锂
第四章 中国碳酸锂进出口情况
4.1 总述
4.2 进口
4.2.1 进口数量
4.2.2 进口金额
4.2.3 进口来源
4.3 出口
4.3.1 出口数量
4.3.2 出口金额
4.3.3 出口目的地
第五章 生产成本及价格
5.1 碳酸锂成本
5.1.1 矿石提锂
5.1.2 盐湖卤水提锂
5.2碳酸锂价格及趋势
第六章 中国锂电池市场
6.1 概述
6.2 产业链
6.3 产量
6.4 技术路线
6.5市场格局
6.6电动汽车对锂电池的需求
6.6.1 中国电动汽车市场
6.6.2 中国电动汽车对碳酸锂的需求
第七章 全球碳酸锂生产企业
7.1 SQM
7.1.1 公司简介
7.1.2 运营情况
7.1.3 产能
7.1.4 销量
7.1.5 发展趋势
7.2 Albemarle
7.2.1公司简介
7.2.2 运营情况
7.2.3碳酸锂业务
7.2.4 发展趋势
7.2.5 竞争优势
7.3 FMC
7.3.1 公司简介
7.3.2运营情况
7.3.3碳酸锂业务
7.4 Orocobre
7.4.1 公司简介
7.4.2 碳酸锂业务
7.5 银河资源
7.5.1 公司简介
7.5.2 碳酸锂业务
7.6 Simbol mining
7.6.1 公司简介
7.6.2碳酸锂业务
7.7 Sentient
7.7.1 公司简介
7.7.2 碳酸锂业务
7.7.3 Enirgi公司
7.8 Nordic Mining
7.8.1 公司简介
7.8.2 碳酸锂业务
第八章 中国碳酸锂生产企业
8.1 四川天齐锂业股份有限公司
8.1.1 公司简介
8.1.2 经营情况
8.1.3 收入结构
8.1.4 成本分析
8.1.5 产销量
8.1.6 资源收购
8.1.7 核心竞争力
8.1.8 业绩预测
8.2 青海盐湖工业股份有限公司
8.2.1 公司简介
8.2.2经营情况
8.2.3 收入结构
8.2.4碳酸锂业务
8.2.5 核心竞争力
8.2.6 业绩预测
8.3 路翔股份有限公司
8.3.1 公司简介
8.3.2 经营情况
8.3.3 收入结构
8.3.4 成本分析
8.3.5碳酸锂业务
8.3.6 核心竞争力
8.3.7 业绩预测
8.4 西藏矿业发展股份有限公司
8.4.1 公司简介
8.4.2经营情况
8.4.3 收入结构
8.4.4碳酸锂业务
8.4.5 核心竞争力
8.4.6 业绩预测
8.5 四川西部资源控股股份有限公司
8.5.1 公司简介
8.5.2 经营情况
8.5.3 收入结构
8.5.4碳酸锂业务
8.5.5 核心竞争力
8.5.6 业绩预测
8.6 江西赣锋锂业股份有限公司
8.6.1 公司简介
8.6.2 产业链
8.6.3经营情况
8.6.4 收入结构
8.6.5 碳酸锂业务
8.6.6 生产能力
8.6.7 核心竞争力
8.6.8 业绩预测
8.7 西部矿业股份有限公司
8.7.1 公司简介
8.7.2 经营情况
8.7.3碳酸锂业务
8.8 西藏城市发展投资股份有限公司
8.8.1 公司简介
8.8.2经营情况
8.8.3碳酸锂业务
8.9 江西特种电机股份有限公司
8.9.1 公司简介
8.9.2 经营情况
8.9.3 碳酸锂业务
8.10 新疆锂盐厂
8.11 四川省尼科国润新材料公司
8.12 四川省集祥锂业科技有限公司
8.13 阿坝广盛锂业有限责任公司
8.14 上海中锂实业有限公司
1 Overview of Lithium Carbonate
1.1 Definition of Lithium
1.1.1 Distribution of Lithium Resources Worldwide
1.1.2 Distribution of Lithium Resources in China
1.2 Application and Product Type
1.3 Industry Chain
1.4 Production Technology
2 Development of Global Lithium Carbonate Industry
2.1 Supply
2.2 Demand
2.2.1 New Energy Vehicles’ Demand for Lithium Carbonate
2.2.2 3C Consumer Electronics’ Demand for Lithium Carbonate
2.2.3 Energy Storage Equipment’ Demand for Lithium Carbonate
2.2.4 Industry’s Demand for Lithium Carbonate
2.3 Competitive Landscape
3 Development of Lithium Carbonate Industry in China
3.1 Supply
3.2 Demand
3.2.1 Total Demand
3.2.2 New Energy Vehicles’ Demand for Lithium Carbonate
3.2.3 Industrial Energy Storage’s Demand for Lithium Carbonate
3.3 Status Quo of Industrial Development
3.4 Competitive Landscape
3.5 Technology Trend- High-purity Lithium Carbonate
4 Import & Export of Lithium Carbonate in China
4.1 Overview
4.2 Import
4.2.1 Import Volume
4.2.2 Import Value
4.2.3 Import Origins
4.3 Export
4.3.1 Export Volume
4.3.2 Export Value
4.3.3 Export Destinations
5 Production Costs and Prices
5.1 Costs of Lithium Carbonate
5.1.1 Lithium Extracted from Ores
5.1.2 Lithium Extracted from Salt Lake Brine
5.2 Prices and Trend
6 Chinese Lithium Battery Market
6.1 Overview
6.2 Industry Chain
6.3 Output
6.4 Technology Route
6.5 Market Pattern
6.6 Electric Vehicles’ Demand for Lithium Battery
6.6.1 Chinese EV Market
6.6.2 Electric Vehicles’ Demand for Lithium Carbonate in China
7 Major Global Companies
7.1 SQM
7.1.1 Profile
7.1.2 Operation
7.1.3 Capacity
7.1.4 Sales Volume
7.1.5 Development Trend
7.2 Albemarle
7.2.1 Profile
7.2.2 Operation
7.2.3 Lithium Carbonate Business
7.2.4 Development Trend
7.2.5 Competitive Edge
7.3 FMC
7.3.1 Profile
7.3.2 Operation
7.3.3 Lithium Carbonate Business
7.4 Orocobre
7.4.1 Profile
7.4.2 Lithium Carbonate Business
7.5 Galaxy Resources
7.5.1 Profile
7.5.2 Lithium Carbonate Business
7.6 Simbol Mining
7.6.1 Profile
7.6.2 Lithium Carbonate Business
7.7 Sentient
7.7.1 Profile
7.7.2 Lithium Carbonate Business
7.7.3 Enirgi
7.8 Nordic Mining
7.8.1 Profile
7.8.2 Lithium Carbonate Business
8 Major Chinese Lithium Carbonate Companies
8.1 Sichuan Tianqi Lithium Industries, Inc.
8.1.1 Profile
8.1.2 Operation
8.1.3 Revenue Structure
8.1.4 Cost Analysis
8.1.5 Output and Sales Volume
8.1.6 Resource Acquisition
8.1.7 Core Competence
8.1.8 Performance Forecast
8.2 Qinghai Salt Lake Industry Co., Ltd.
8.2.1 Profile
8.2.2 Operation
8.2.3 Revenue Structure
8.2.4 Lithium Carbonate Business
8.2.5 Core Competence
8.2.6 Performance Forecast
8.3 YOUNGY Co., Ltd. (formerly Luxiang)
8.3.1 Profile
8.3.2 Operation
8.3.3 Revenue Structure
8.3.4 Costs
8.3.5 Lithium Carbonate Business
8.3.6 Core Competence
8.3.7 Performance Forecast
8.4 Tibet Mineral Development Co., Ltd.
8.4.1 Profile
8.4.2 Operation
8.4.3 Revenue Structure
8.4.4 Lithium Carbonate Business
8.4.5 Core Competence
8.4.6 Performance Forecast
8.5 Sichuan Western Resources Holding Co., Ltd.
8.5.1 Profile
8.5.2 Operation
8.5.3 Revenue Structure
8.5.4 Lithium Carbonate Business
8.5.5 Core Competence
8.5.6 Performance Forecast
8.6 Jiangxi Ganfeng Lithium Co., Ltd.
8.6.1 Profile
8.6.2 Industry Chain
8.6.3 Operation
8.6.4 Revenue Structure
8.6.5 Lithium Carbonate Business
8.6.6 Production Capacity
8.6.7 Core Competence
8.6.8 Performance Forecast
8.7 Western Mining Co., Ltd.
8.7.1 Profile
8.7.2 Operation
8.7.3 Lithium Carbonate Business
8.8 Tibet Urban Development and Investment Co., Ltd.
8.8.1 Profile
8.8.2 Operation
8.8.3 Lithium Carbonate Business
8.9 Jiangxi Special Electric Motor Co., Ltd.
8.9.1 Profile
8.9.2 Operation
8.9.3 Lithium Carbonate Business
8.10 Xinjiang Lithium Salt Plant
8.11 Sichuan Ni & Co Guorun New Materials Co., Ltd.
8.12 Sichuan Jixiang Lithium Co., Ltd.
8.13 ABA Guangsheng Lithium Co., Ltd.
8.14 Shanghai China Lithium Industrial Co., Ltd.
表:2014年全球锂资源储量
图:全球锂资源分布图
图:全球盐湖卤水资源分布图
表:全球主要矿石锂资源分布
表:全球主要盐湖锂资源分布及成分
图:2004-2015年全球锂资源储量
表:国内主要提锂企业卤水提锂产量估算
图:中国锂资源分布及生产企业
图:中国锂资源开发现状(分生产企业、分资源所在地)
图:预计2020年碳酸锂主要用途占比
图:碳酸锂行业产品链示意图
表:碳酸锂主要生产工艺的特点介绍
图:国内碳酸锂生产商提锂工艺
图:2012-2020年全球碳酸锂供给量
图:2012-2020年全球碳酸锂需求量
图:2012-2020年全球碳酸锂(分盐湖锂和矿石锂)供给量
表:2011-2017年全球碳酸锂产量统计及产能预测(按企业、按提锂技术)
表:主要下游终端产品碳酸锂需求量
图:2012-2020年全球碳酸锂需求量
图:2013年全球碳酸锂下游消费结构
图:2015年全球碳酸锂下游消费结构
表:世界主流电动汽车厂商正极材料选择
图:2011-2020年全球电动乘用车(EV&PHEV)销量
图:2011-2020年全球电动汽车动力锂电池需求(分类型)
表:2016-2020年全球新能源汽车碳酸锂需求预测
表:3C数码消费品使用锂电池情况
图:2015年全球3C数码消费品锂电池碳酸锂需求结构
图:2013-2020年全球消费电子锂电池需求量及增速
图:2012-2020年全球手机销量及锂电池需求量
图:2012-2020年全球平板电脑销量及锂电池需求量
表:2013-2015年全球平板电脑市场竞争格局
图:2012-2020年全球笔记本电脑销量及锂电池需求量
图:2012-2020年全球电子烟销量及占比
表:2016-2020年全球3C数码消费品碳酸锂需求预测
表:2016-2020年全球储能设备对碳酸锂需求预测
图:2015年全球工业用碳酸锂消费结构
表:2016-2020年全球工业用途碳酸锂需求预测
图:全球碳酸锂产能分布
图:2015年全球碳酸锂市场格局
表:2014-2015年全球主要碳酸锂生产商产量及产能
图:2012-2020年中国碳酸锂产量占全球总量比例
表:2013-2014年中国基础锂盐产量
表:国内电池级碳酸锂需求估算
图:2011-2020年中国电动乘用车(EV&PHEV)销量
图:2011-2020年中国电动乘用车销量占全球比重
图:2011-2020年中国动力锂电池需求(分类型)
图:2009-2016年中国移动基站数量
图:2015/2020年中国储能锂电池需求量
图:2020年中国储能锂电池(分领域)需求结构
图:2014-2020年中国储能电池(分应用领域)需求(单位:MWh)
图:2015年中国主要碳酸锂企业市场份额
表:2015年中国主要碳酸锂生产企业产能情况
表:中国部分企业高纯碳酸锂产能
表:全球主要锂辉石矿
表:全球主要含锂盐湖
表:全球主要企业碳酸锂生产成本
表:锂矿及卤水提取产品纯度
图:2012-2016年中国工业级和电池级碳酸锂价格
图:2012-2020年全球锂电池需求结构
图:2011-2020年中国动力锂电池产量(分用途)
图:2011-2020年全球电动汽车动力锂电池产量(分用途)
图:锂离子电池成本构成
图:锂离子电池产业链
表:国内锂电池上游材料供应商
表:国内锂电池材料供应商
表:国内锂电池下游企业
图:2008-2015年中国锂电池产量
图:2015年1-10月国内锂电池产量集中度分布
图:2015年中国TOP10锂电池企业产能(GWh)
图:锂电池不同生产工艺比较
表:国内主要锂电池厂商技术路线
表:2015H1中国新能源乘用车动力电池(分技术类型)配套量占比
图:2015年上半年主力电池厂商市场份额
图:2015年上半年主力电池厂商出货量(MWh)
图:2011-2020年中国电动汽车销量
图:2011-2020年中国电动汽车对碳酸锂需求预测
图:SQM碳酸锂生产工艺流程图
图:2011-2015年 SQM 营业利润
图:2011-2015年 SQM 净利润
表:2009-2015年SQM 锂及衍生品营业收入及毛利率
图:2009-2015年锂及衍生物产品对SQM的收入贡献
图:2006-2020年SQM碳酸锂产能预测
图:2006-2014年SQM锂及锂衍生品销量及市场份额
表:2012-2014年SQM碳酸锂销量全球各地区占比
表:Albemarle锂资源储备
表:Albemarle全球锂盐加工企业分布
表:2011-2015年Albemarle营业利润
表:2011-2015年Albemarle净利润
表:2014、2015年Q3 ALB锂板块销售收入和Adj.EBITDA对比
图:Albemarle主要锂产品
图:2014-2020年Albemarle碳酸锂产能预测
图:Albemarle启动智利La Negra 2万吨电池级碳酸锂工厂试生产
图:Albemarle 2020年新增5万吨锂辉石电池级锂盐产能
图:FMC公司Hombre Muerto盐湖生产工艺
图:2012-2015年FMC营业利润
图:2012-2015年FMC净利润
图:2014年FMC各板块收入(百万美元)
图:2014年FMC各地域收入
图:2006-2015年FMC锂产品收入
表:FMC进入的碳酸锂下游领域
图:FMC对2016-2020年全球碳酸锂需求预测
图:2014-2020年FMC碳酸锂产能预测
表:2013-2014年Orocobre 产品销量
图:Olaroz盐湖技改优化工艺路线
图:2015年Olaroz盐湖产能预测
图:2015-2020年Orocobre碳酸锂产能预测
表:2012-2013年Galaxy Resources江苏厂碳酸锂产销量
图:Nordic Mining资源分布图
图:天齐锂业公司组织结构图
表:2007-2015年天齐锂业总收入与营业利润、净利润
图:2010-2015年天齐锂业锂盐毛利率
表:2009-2015年天齐锂业份地区收入结构
表:2012-2013年天齐锂业碳酸锂成本构成
表:2014年天齐锂业产能分布
表:2009-2015年盐湖股份营业收入及净利润
表:2010-2015年青海盐湖工业(分产品)收入结构
图:2015-2017年盐湖股份总营收预测
图:路翔股份转型过程
图:2015年融捷股份组织结构图
表:2009-2015年路翔股份营业收入和净利润
图:2015H2 路翔股份收入结构(分产品)
图:2015H2 路翔股份收入结构(分地区)
表:2013-2014年路翔股份锂产品成本构成
表:2012-2014年路翔股份锂矿产销量及库存量
表:2014-2018年东莞德瑞产品研发计划
表:2014-2017年路翔股份有限公司收入与净利润预测
表:2009-2015年西藏矿业营业收入及净利润
图:2015H2 西藏矿业收入结构(分产品)
表:2013-2014年西藏矿业发展股份有限公司碳酸锂开采及生产企业主要经营指标
表:西部资源新能源产业链主要子公司
表:2009-2015年四川西部资源控股股份有限公司收入与净利润
图:2015H2 西部资源收入结构(分行业)
图:2015H2 西部资源收入结构(分产品)
图:2015-2017年 西部资源营业收入预测
图:赣锋锂业在新兴领域分布
表:2009-2015江西赣锋锂业股份有限公司收入与净利润
表:2013-2015年江西赣锋锂业股份有限公司分产品、分地区营业收入及毛利率
图:赣锋锂业产品生产流程图
表:2009-2014年赣锋锂业碳酸锂业务收入、成本及毛利率
表:2014年赣锋锂业各项产品产能
表:公司锂资源分布
表:2013-2014年赣锋锂业主要项目
表:2014-2017年赣锋锂业有限公司收入与净利润预测
表:2009-2015西部矿业股份有限公司收入与净利润
表:2009-2015西藏城投收入与净利润
表:2013-2018年西藏城市发展投资股份有限公司产品产能规划
表:2009-2015江特电机收入与净利润
表:2015H2 江特电机各项业务收入及毛利率
表:江特电机募投项目
表:新疆锂盐厂主要产品产能
表:四川省尼科国润新材料公司主要产品产能
表:四川省集祥锂业科技有限公司主要产品产能
表:阿坝广盛锂业有限责任公司主要产品产能
表:上海中锂实业有限公司主要产品产能
Global Lithium Resource Reserves in 2014
Distribution of Lithium Resources Worldwide
Distribution of Salt Lake Brine Resources Worldwide
Distribution of Main Lithium Ore Resources Worldwide
Distribution and Composition of Main Salt Lake Lithium Resources Worldwide
Global Lithium Resource Reserves, 2004-2015
Brine-extracted Lithium Output Estimation of Major Chinese Lithium Extraction Enterprises
Distribution of Lithium Resources and Manufacturers in China
Status Quo of Lithium Resource Development in China (by Production Enterprise/by Location of Resources)
Estimated Percentages of Main Applications of Lithium Carbonate in 2020
Schematic Diagram of Product Chain in Lithium Carbonate Industry
Features of Mainstream Lithium Carbonate Manufacturing Technologies
Lithium Extracting Technologies of Chinese Lithium Carbonate Manufacturers
Global Supply of Lithium Carbonate, 2012-2020E
Global Demand for Lithium Carbonate, 2012-2020E
Global Supply of Lithium Carbonate (by Salt Lake Lithium and Ore Lithium), 2012-2020E
Global Lithium Carbonate Output Statistics and Capacity Forecast (by Enterprise/by Lithium Extraction Technology), 2011-2017E
Demand for Lithium Carbonate from Main Downstream End Products
Global Demand for Lithium Carbonate, 2012-2020E
Consumption Structure of Lithium Carbonate Worldwide, 2013
Consumption Structure of Lithium Carbonate Worldwide, 2015
World’s Mainstream EV Makers’ Selection of Cathode Materials
EV&PHEV Sales Volume in the World, 2011-2020
EV’s Demand for Power Lithium Battery (by Type) Worldwide, 2011-2020
New Energy Vehicle’s Demand for Lithium Carbonate Worldwide, 2016-2020E
Use of Lithium Battery by 3C Consumer Electronics
Structure of 3C Consumer Electronics’ Demand for Lithium Battery Used Lithium Carbonate Worldwide, 2015
Global Demand for Lithium Battery from Consumer Electronics and Growth Rate, 2013-2020E
Global Mobile Phone Sales Volume and Demand for Lithium Battery, 2012-2020E
Global Tablet PC Sales Volume and Demand for Lithium Battery, 2012-2020E
Competitive Pattern of Global Tablet PC Market, 2013-2015
Global Notebook Computer Sales Volume and Demand for Lithium Battery, 2012-2020E
Global Electronic Cigarette Sales Volume and Percentage, 2012-2020E
Global 3C Consumer Electronics’ Demand for Lithium Carbonate, 2016-2020E
Demand for Lithium Carbonate from Global Energy Storage Equipment, 2016-2020E
Global Consumption Structure of Lithium Carbonate for Industrial Use, 2015
Global Demand for Lithium Carbonate for Industrial Use, 2016-2020E
Distribution of Lithium Carbonate Capacities Worldwide
Global Lithium Carbonate Market Pattern, 2015
Output and Capacity of World’s Leading Lithium Carbonate Manufacturers, 2014-2015
Share of China’s Lithium Carbonate Output in Global Total, 2012-2020E
Output of Basic Lithium Salts in China, 2013-2014
Estimated Demand for Battery-grade Lithium Carbonate in China
EV & PHEV Sales Volume in China, 2011-2020E
Share of China’s EV & PHEV Sales Volume in Global Total, 2011-2020E
Demand for Power Lithium Battery (by Type) in China, 2011-2020E
Number of Mobile Base Stations in China, 2009-2016E
Demand for Energy Storage Lithium Battery in China, 2015/2020
Structure of Demand for Energy Storage Lithium Battery (by Field) in China, 2020E
Energy Storage Battery Demand (by Application Field) in China, 2014-2020E
Market Share of Leading Lithium Carbonate Enterprises in China, 2015
Production Capacities of Leading Lithium Carbonate Enterprises in China, 2015
High-purity Lithium Carbonate Capacity of Some Enterprises in China
Main Spodumene Mines Worldwide
Main Lithium-containing Salt Lakes Worldwide
Lithium Carbonate Manufacturing Costs of Major Global Companies
Lithium Ores and Purity of Brine-extracted Products
Prices of Industrial-grade and Battery-grade Lithium Carbonate in China, 2012-2016E
Structure of Global Demand for Lithium Battery, 2012-2020E
Output of Power Lithium Battery in China (by Application), 2011-2020E
Global Output of Power Lithium Battery for Electric Vehicles (by Application), 2011-2020E
Cost Structure of Li-ion Battery
Li-ion Battery Industry Chain
Suppliers of Lithium Battery Upstream Materials in China
Suppliers of Battery Materials in China
Lithium Battery Downstream Enterprises in China
Output of Lithium Battery in China, 2008-2015
Distribution of Lithium Battery Output Concentration in China, Jan-Oct., 2015
Capacities of Top 10 Lithium Battery Companies in China, 2015
Comparison between Different Manufacturing Technologies for Lithium Battery
Technology Roadmap of Some Leading Chinese Lithium Battery Manufacturers
Percentage of Power Battery (by Type of Technology) Supporting for New Energy Passenger Vehicles in China, 2015H1
Market Share of Leading Battery Manufacturers in 2015H1
Shipment of Leading Battery Manufacturers in 2015H1
Electric Vehicle Sales Volume in China, 2011-2020E
Demand for Lithium Carbonate from Electric Vehicle in China, 2011-2020E
Lithium Carbonate Manufacturing Flow of SQM
Operating Income of SQM, 2011-2015
Net Income of SQM, 2011-2015
SQM’s Revenue from and Gross Margin of Lithium and Its Derivatives, 2009-2015
Revenue Contribution of Lithium and Derivatives to SQM, 2009-2015
Lithium Carbonate Capacity of SQM, 2006-2020E
SQM’s Sales Volume of Lithium and Lithium Derivatives and Market Share, 2006-2014
SQM’s Lithium Carbonate Sales Percentage by Regions Worldwide, 2012-2014
Lithium Resource Reserves of Albemarle
Distribution of Albemarle’s Lithium Salt Processing Enterprises Worldwide
Operating Income of Albemarle, 2011-2015
Net Income of Albemarle, 2011-2015
Albemarle’s Revenue from Lithium Business Segment and Comparison of EBITDA, 2014/2015Q3
Main Lithium Products of Albemarle
Lithium Carbonate Capacity of Albemarle, 2014-2020E
Albemarle’s Commissioning of the 20,000 t/a Battery-grade Lithium Carbonate Plant in La Negra, Chile
Albemarle’s New Addition of 50,000-ton Capacity of Spodumene Battery-grade Lithium Salts in 2020
FMC’s Hombre Muerto Salt Lake Processing Technology
Operating Income of FMC, 2012-2015
Net Income of FMC, 2012-2015
FMC’s Revenue Breakdown by Segment, 2014
FMC’s Revenue Breakdown by Region, 2014
FMC’s Revenue from Lithium Products, 2006-2015
Lithium Carbonate Downstream Fields in which FMC Set Foot
FMC’s Prediction of Global Demand for Lithium Carbonate, 2016-2020
Lithium Carbonate Capacity of FMC, 2014-2020E
Product Sales Volume of Orocobre, 2013-2014
Olaroz Salt Lake Technical Transformation and Optimization Technology Roadmap
Olaroz Salt Lake Output Prediction, 2015
Lithium Carbonate Capacity of Orocobre, 2015-2020E
Lithium Carbonate Output and Sales Volume of Galaxy Resources’ Jiangsu Plant, 2012-2013
Distribution of Nordic Mining’s Resources
Organization Structure of Sichuan Tianqi Lithium Industries
Total Revenue, Operating Income and Net Income of Sichuan Tianqi Lithium Industries, 2007-2015
Gross Margin of Lithium Salts of Sichuan Tianqi Lithium Industries, 2010-2015
Revenue Structure of Sichuan Tianqi Lithium Industries by Region, 2009-2015
Lithium Carbonate Cost Structure of Sichuan Tianqi Lithium Industries, 2012-2013
Capacity Distribution of Sichuan Tianqi Lithium Industries, 2014
Revenue and Net Income of Qinghai Salt Lake Industry, 2009-2015
Revenue Structure of Qinghai Salt Lake Industry (by Product), 2010-2015
Total Revenue of Qinghai Salt Lake Industry, 2015-2017E
Transformation Process of YOUNGY Co., Ltd
Organization Structure of YOUNGY Co., Ltd, 2015
Revenue and Net Income of YOUNGY Co., Ltd, 2009-2015
Revenue Structure of YOUNGY Co., Ltd by Product, 2015H2
Revenue Structure of YOUNGY Co., Ltd by Region, 2015H2
Cost Structure of Lithium Products of YOUNGY Co., Ltd, 2013-2014
Lithium Ore Output, Sales Volume and Inventory of YOUNGY Co., Ltd, 2012-2014
Product R&D Scheme of Dongguan Tec-Rich Engineering, 2014-2018
Revenue and Net Income of Luxiang Co., Ltd, 2014-2017
Revenue and Net Income of Tibet Mineral Development, 2009-2015
Revenue Structure of Tibet Mineral Development by Product, 2015H2
Main Operating Indices of Lithium Carbonate Exploitation and Production Enterprises of Tibet Mineral Development, 2013-2014
Key Subsidiaries of Sichuan Western Resources Holding in New Energy Industry Chain
Revenue and Net Income of Sichuan Western Resources Holding, 2009-2015
Revenue Structure of Sichuan Western Resources Holding by Sector, 2015H2
Revenue Structure of Sichuan Western Resources Holding by Product, 2015H2
Revenue of Sichuan Western Resources Holding, 2015-2017E
Footprint of Jiangxi Ganfeng Lithium in the Emerging Fields
Revenue and Net Income of Jiangxi Ganfeng Lithium, 2009-2015
Revenue and Gross Margin of Jiangxi Ganfeng Lithium by Product/by Region, 2013-2015
Product Manufacturing Flow of Jiangxi Ganfeng Lithium
Revenue, Cost and Gross Margin of Lithium Carbonate Business of Jiangxi Ganfeng Lithium, 2009-2014
Capacities of Main Products of Jiangxi Ganfeng Lithium, 2014
Distribution of Lithium Resource of Jiangxi Ganfeng Lithium
Major Projects of Jiangxi Ganfeng Lithium, 2013-2014
Revenue and Net Income of Jiangxi Ganfeng Lithium, 2014-2017
Revenue and Net Income of Western Mining, 2009-2015
Revenue and Net Income of Tibet Urban Development and Investment, 2009-2015
Product Capacity Planning of Tibet Urban Development and Investment, 2013-2018E
Revenue and Net Income of Jiangxi Special Electric Motor, 2009-2015
Revenue and Gross Margin of Jiangxi Special Electric Motor by Business, 2015H2
Projects with Raised Funds of Jiangxi Special Electric Motor
Capacities of Main Products of Xinjiang Lithium Salt Plant
Capacities of Main Products of Sichuan Ni & Co Guorun New Materials
Capacities of Main Products of Sichuan Jixiang Lithium
Capacities of Main Products of ABA Guangsheng Lithium
Capacities of Main Products of Shanghai China Lithium Industrial
如果这份报告不能满足您的要求,我们还可以为您定制报告,请 留言说明您的详细需求。
|