|
|
|
报告导航:研究报告—
制造业—材料
|
|
2016-2020年全球及中国碳纤维及碳纤维复合材料(CFRP)行业研究报告 |
 |
字数:5.3万 |
页数:151 |
图表数:163 |
|
中文电子版:9000元 |
中文纸版:4500元 |
中文(电子+纸)版:9500元 |
|
英文电子版:2300美元 |
英文纸版:2500美元 |
英文(电子+纸)版:2600美元 |
|
编号:HK067
|
发布日期:2016-01 |
附件:下载 |
 |
|
|
碳纤维(Carbon Fiber)是新一代增强纤维,通过添加树脂、金属、陶瓷、混凝土等材料制成碳纤维复合材料(其中CFRP应用最为广泛),主要应用于航空航天、汽车、风电、压力容器、体育休闲等领域。
全球碳纤维工业化产品以PAN基碳纤维为主,占碳纤维总产量的 90%以上。2015年,全球PAN基碳纤维总产能约达14.2万吨,其中小丝束碳纤维占70%左右。
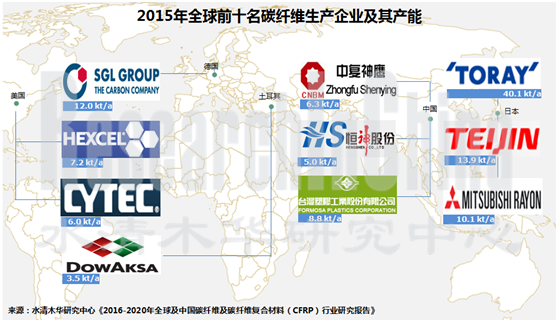
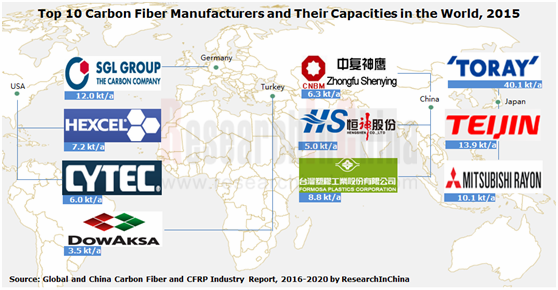
全球碳纤维的生产主要集中于日本、美国和欧洲企业,2015年全球碳纤维产能排名前五的企业分别为东丽、帝人、西格里、三菱丽阳和台塑,其碳纤维产能之和约占全球总产能的60%。其中东丽碳纤维产能达4万吨(含卓尔泰克1.3万吨产能),占全球总产能的28%。
2015年,全球碳纤维需求量约为5.9万吨,在航空航天、工业和体育休闲领域的应用比例分别为22%、62%和16%。其中工业领域对碳纤维需求的增速最快,尤其在汽车、风力发电、压力容器等细分市场。预计到2020年,全球碳纤维在工业领域的应用比例将达到72%,其中汽车、风电细分市场应用比例分别为23%和21%。
以汽车领域为例:在未来汽车轻量化的发展趋势下,碳纤维复合材料在汽车中的应用比例将越来越高。目前宝马、奔驰、法拉利、兰博基尼、通用、福特等众多汽车厂商已经涉入碳纤维材料领域,其中进展较快的如西格里和宝马合作已在宝马i3电动、i8混合动力和新7系的车身架构中使用碳纤维材料。2015年,全球汽车用碳纤维复合材料市场规模约为15.8亿美元,未来几年仍然有望保持30%左右的高速发展。
中国碳纤维产业起步较晚,目前仅T300级碳纤维生产工艺较为成熟,T700、T800实现了关键技术的突破并小批量量产。但是国内碳纤维生产企业总体技术水平较低、生产成本高,而近3年国际碳纤维价格不断下滑,导致中国碳纤维生产企业普遍经营困难,装置开工率极低。2015年,中国碳纤维产量仅4000吨左右,自给率不足20%。
2015年,中国碳纤维生产企业有30余家,但是产量达千吨以上的仅有江苏恒神和中复神鹰两家,部分企业碳纤维装置一直处于停产状态。中复神鹰是中国碳纤维产能最大的企业,达6300吨,其中2100吨为2015年新增产能;恒神股份是新三板第一家从事碳纤维及其复合材料业务的企业,拥有从碳纤维原丝到终端复合材料的完整产业链。
中国市场对碳纤维的需求一直较为强劲,未来5年中国碳纤维需求量仍将保持15%以上的增长速度。而随着国家政策对碳纤维产业的扶持以及其巨大的市场潜力,促使多家上市公司涉足碳纤维及其复合材料领域,如康得新布局汽车相关的碳纤维复合材料业务,已与北汽新能源合作展开新能源汽车中碳纤维组件的研究;海源机械利用其冲压成型的技术优势,募资6亿元用于新能源汽车碳纤维车身部件的生产研发。
水清木华研究中心《2016-2020年全球及中国碳纤维及碳纤维复合材料(CFRP)行业研究报告》主要包括以下几个内容:
 全球碳纤维行业供需分析、竞争格局、成本及价格分析、市场规模、需求预测等; 全球碳纤维行业供需分析、竞争格局、成本及价格分析、市场规模、需求预测等;
中国碳纤维行业供需分析、竞争格局、价格分析、进出口分析、需求预测等;
全球碳纤维原丝、碳纤维复合材料行业发展现状、市场规模及预测等;
航空航天、汽车、风电、体育休闲领域碳纤维复合材料的应用现状、市场规模及预测等;
全球及中国28家碳纤维生产企业经营状况、碳纤维业务分析等。
Carbon fiber is the new-generation reinforced fiber and made into carbon fiber composites (including the most widely used CFRP) by adding of resins, metals, ceramics, concrete and other materials, mainly used in the fields of aerospace, automobiles, wind power, pressure vessels, sports and leisure .
The global carbon fiber industrialized products center on PAN-based carbon fiber, which accounts for over 90% of the total output of carbon fiber. In 2015, the global capacity of PAN-based carbon fiber totaled about 142,000 tons, of which small-tow carbon fiber occupied about 70%.
The global carbon fiber capacity is mainly contributed by Japan, Europe and the United States. In 2015, the world's top five companies -- Toray, Teijin, SGL, Mitsubishi Rayon and Formosa Plastics shared 60% of the global carbon fiber capacity together; particularly, Toray's carbon fiber capacity attained 40,000 tons (including Zoltek's 13,000 tons), equivalent to 28% of the global total capacity.
The global carbon fiber demand amounted to 59,000 tons in 2015. 22%, 62% and 16% of carbon fiber were applied to aerospace, industries, and sports & leisure respectively. Specifically, the demand from industries grew fastest, especially from automobiles, wind power, pressure vessels and other market segments. By 2020, 72% of the global carbon fiber will be used in industries, of which 23% will be adopted by automobiles and 21% by wind power.
We take the automotive industry as an example: In the wake of automotive lightweight, more and more carbon fiber composite materials will be utilized in automobiles. Currently, BMW, Benz, Ferrari, Lamborghini, General Motors, Ford and other automakers have already got involved in the field of carbon fiber materials. The fast-growing SGL and BMW cooperate to make use of carbon fiber materials in the body structure of BMW i3, i8 and all -new 7 Series. The global market size of automotive carbon fiber composites hit about USD1.58 billion in 2015, and is expected to maintain the high growth rate of around 30% in the next few years.
China carbon fiber industry started late. Now, it is only sophisticated at T300 carbon fiber production processes, makes breakthroughs in T700 and T800 technologies and realizes small-lot production. However, the Chinese producers hold backward technologies and pay high production costs; coupled with the declining international carbon fiber price in recent three years, Chinese carbon fiber enterprises are confronted with operating difficulties with a low operating rate. In 2015, China's output of carbon fiber only reached about 4,000 tons, and the self-sufficiency ratio was less than 20%.
In 2015, there were more than 30 Chinese carbon fiber manufacturers, but only Hengshen Co., Ltd and Zhongfu Shenying achieved the respective output of above 1,000 tons, while the carbon fiber devices of some enterprises were in a shutdown state. In China, Zhongfu Shenying holds the largest carbon fiber capacity, namely 6,300 tons, of which 2,100 tons were gained in 2015. Hengshen Co., Ltd is the first carbon fiber and composite materials enterprise on NEW OTCBB (Over the Counter Bulletin Board), with a complete industrial chain ranging from carbon fiber precursor to terminal composites.
China’s demand for carbon fiber has always remained robust and will still ascend at the growth rate of over 15% in the next five years. The favorable national policies and huge market potentials have allured a number of listed companies to step in the field of carbon fiber and composite materials, for instance, Beijing Kangde Xin Composite Material has made layout for auto-related carbon fiber composite materials and studied carbon fiber components of new energy vehicles in cooperation with BAIC BJEV; by virtue of its technological advantages in stamping and molding, Haiyuan Automatic Equipments Co., Ltd. has raised RMB600 million for R & D and production of carbon fiber body parts of new energy vehicle.
Global and China Carbon Fiber and CFRP Industry Report, 2016-2020 mainly covers the followings:
 Supply and demand, competition pattern, cost and price analysis, market size, demand forecasting, etc. of the global carbon fiber industry; Supply and demand, competition pattern, cost and price analysis, market size, demand forecasting, etc. of the global carbon fiber industry;
Supply and demand, competition pattern, price analysis, import and export, demand forecasting, etc. of Chinese carbon fiber industry;
Development, market size and forecasting of the global carbon fiber precursor and carbon fiber composites industries;
Applications, market size and forecasting of carbon fiber composites in the areas of aerospace, automobiles, wind energy, sports and leisure;
Operation and carbon fiber business of 28 carbon fiber manufacturers at home and abroad.
第一章碳纤维概述
1.1 定义及性质
1.2 工艺流程
1.3 分类
1.4 应用
1.5 技术水平
第二章全球碳纤维市场
2.1 发展现状
2.2 供需分析
2.2.1 供给
2.2.2 需求
2.3 竞争格局
2.4 生产技术与装备
2.5 成本和价格分析
2.6 市场规模
2.7 行业发展趋势
第三章中国碳纤维市场
3.1 发展现状
3.2 供需分析
3.2.1 供给
3.2.2 需求
3.3 产业布局
3.4 企业竞争格局
3.5 生产技术与装备
3.6 价格分析
3.7 技术水平
3.8 进出口分析
3.8.1 碳纤维
3.8.2 碳纤维预浸料
3.8.3 其他碳纤维制品
第四章上下游产业链分析
4.1 上游碳纤维原丝
4.2 碳纤维复合材料
4.3 下游应用领域
4.3.1 航空航天
4.3.2 汽车轻量化
4.3.3 风电
4.3.4 体育休闲
第五章海外重点企业
5.1 日本东丽
5.1.1 公司简介
5.1.2 经营情况
5.1.3 碳纤维部门经营情况
5.1.4 碳纤维业务
5.1.5 在华业务
5.2 日本帝人
5.2.1 公司简介
5.2.2 经营情况
5.2.3 碳纤维业务
5.2.4 在华业务
5.3 三菱化学控股集团
5.3.1 公司简介
5.3.2 经营情况
5.3.3 碳纤维业务
5.4 日本吴羽
5.4.1 公司简介
5.4.2 经营情况
5.4.3 先进材料部门经营情况
5.4.4 碳纤维业务
5.4.5 在华业务
5.5 美国赫克塞尔
5.5.1 公司简介
5.5.2 经营情况
5.5.3 营收构成
5.5.4 碳纤维业务
5.6 美国氰特
5.6.1 公司简介
5.6.2 经营状况
5.6.3 航天材料部门经营情况
5.6.4 碳纤维业务
5.7 德国西格里
5.7.1 公司简介
5.7.2 经营状况
5.7.3 碳纤维及复合材料部门经营情况
5.7.4 碳纤维业务
5.8 台塑
5.8.1 公司简介
5.8.2 经营情况
5.8.3 碳纤维业务经营情况
5.8.4 碳纤维产销量
第六章中国大陆碳纤维生产企业
6.1 吉林炭素
6.1.1 公司简介
6.1.2 经营状况
6.1.3 营收构成
6.1.4 毛利率
6.1.5 碳纤维业务
6.2 奇峰化纤
6.2.1 公司简介
6.2.2 经营状况
6.2.3 营收构成
6.2.4 毛利率
6.2.5 产销量
6.2.6 销售价格
6.2.7 碳纤维业务
6.3 恒神股份
6.3.1 公司简介
6.3.2 经营状况
6.3.3 营收构成
6.3.4 毛利率
6.3.5 客户及供应商
6.3.6 碳纤维业务
6.4 方大炭素
6.4.1 公司简介
6.4.2 碳纤维业务
6.5 金发科技
6.5.1 公司简介
6.5.2 碳纤维业务
6.6 吉研高科
6.6.1 公司简介
6.6.2 碳纤维业务
6.7 嘉兴中宝
6.7.1 公司简介
6.7.2 碳纤维业务
6.8 江苏天鸟
6.8.1 公司简介
6.8.2 经营状况
6.8.3 营收构成
6.8.4 毛利率
6.8.5 碳纤维业务
6.9 江苏航科
6.9.1 公司简介
6.9.2 碳纤维业务
6.10 康得新
6.10.1 公司简介
6.10.2 碳纤维业务
6.11其他企业
6.11.1 中复神鹰
6.11.2 山西恒天
6.11.3 威海拓展
6.11.4 河南永煤
6.11.5 沈阳中恒
6.11.6 浙江巨鑫
6.11.7 中简科技
6.11.8 兴科控股
6.11.9 上海石化
6.11.10 蓝星纤维
1 Overview of Carbon Fiber
1.1 Definition and Properties
1.2 Technical Process
1.3 Classification
1.4 Application
1.5 Technical level
2 Global Carbon Fiber Market
2.1 Status Quo
2.2 Supply and Demand
2.2.1 Supply
2.2.2 Demand
2.3 Competition Pattern
2.4 Production Technology and Equipment
2.5 Cost and Price
2.6 Market Size
2.7 Trends
3 Chinese Carbon Fiber Market
3.1 Status Quo
3.2 Supply and Demand
3.2.1 Supply
3.2.2 Demand
3.3 Industrial Layout
3.4 Enterprise Competition
3.5 Production Technology and Equipment
3.6 Price
3.7 Technical Level
3.8 Import and Export
3.8.1 Carbon Fiber
3.8.2 Carbon Fiber Prepreg
3.8.3 Other Carbon Fiber Products
4 Upstream and Downstream Industry Chains
4.1 Upstream Carbon Fiber Precursor
4.2 Carbon Fiber Composite
4.3 Downstream Applications
4.3.1 Aerospace
4.3.2 Auto Light-weighting
4.3.3 Wind Power
4.3.4 Sport & Leisure
5 Key Overseas Companies
5.1 Toray
5.1.1 Profile
5.1.2 Operation
5.1.3 Operation of Carbon Fiber Division
5.1.4 Carbon Fiber Business
5.1.5 Business in China
5.2 Teijin
5.2.1 Profile
5.2.2 Operation
5.2.3 Carbon Fiber Business
5.2.4 Business in China
5.3 Mitsubishi Chemical Corporation
5.3.1 Profile
5.3.2 Operation
5.3.3 Carbon Fiber Business
5.4 Kureha
5.4.1 Profile
5.4.2 Operation
5.4.3 Operation of Advanced Materials Division
5.4.4 Carbon Fiber Business
5.4.5 Business in China
5.5 Hexcel
5.5.1 Profile
5.5.2 Operation
5.5.3 Revenue Structure
5.5.4 Carbon Fiber Business
5.6 Cytec
5.6.1 Profile
5.6.2 Operation
5.6.3 Operation of Aerospace Materials Division
5.6.4 Carbon Fiber Business
5.7 SGL Carbon
5.7.1 Profile
5.7.2 Operation
5.7.3 Operation of Carbon Fiber and Composite Materials Division
5.7.4 Carbon Fiber Business
5.8 Formosa Plastics
5.8.1 Profile
5.8.2 Operation
5.8.3 Carbon Fiber Business
5.8.4 Output and Sales Volume of Carbon Fiber
6 Key Enterprises in Mainland China
6.1 Jilin Carbon
6.1.1 Profile
6.1.2 Operation
6.1.3 Revenue Structure
6.1.4 Gross Margin
6.1.5 Carbon Fiber Business
6.2 Jilin Qifeng Chemical Fiber
6.2.1 Profile
6.2.2 Operation
6.2.3 Revenue Structure
6.2.4 Gross Margin
6.2.5 Output and Sales Volume
6.2.6 Selling Price
6.2.7 Carbon Fiber Business
6.3 Jiangsu Hengshen Fiber Material
6.3.1 Profile
6.3.2 Operation
6.3.3 Revenue Structure
6.3.4 Gross Margin
6.3.5 Customers and Suppliers
6.3.6 Carbon Fiber Business
6.4 Fangda Carbon New Material
6.4.1 Profile
6.4.2 Carbon Fiber Business
6.5 Kingfa
6.5.1 Profile
6.5.2 Carbon Fiber Business
6.6 Jiyan High-tech Fibers
6.6.1 Profile
6.6.2 Carbon Fiber Business
6.7 Jiaxing Sino-Dia Carbon Fibre
6.7.1 Profile
6.7.2 Carbon Fiber Business
6.8 Jiangsu Tianniao High Technology
6.8.1 Profile
6.8.2 Operation
6.8.3 Revenue Structure
6.8.4 Gross Margin
6.8.5 Carbon Fiber Business
6.9 Jiangsu Hangke Composite Materials Technology
6.9.1 Profile
6.9.2 Carbon Fiber Business
6.10 Beijing Kangde Xin Composite Material
6.10.1 Profile
6.10.2 Carbon Fiber Business
6.11 Others
6.11.1 Zhongfu Shenying Carbon Fiber
6.11.2 Shanxi Hengtian New Textile Fiber Tech
6.11.3 Weihai Tuozhan Fiber
6.11.4 HNEC Yongmei Carbon Fiber
6.11.5 Shenyang Zhongheng New Materials
6.11.6 Zhejiang Juxin Carbon Fiber
6.11.7 Sinofibers Technology
6.11.8 Xingke Holdings
6.11.9 Shanghai Petrochemical
6.11.10 Bluestar Fibres
表:碳纤维与常规材料性能对比
表:碳纤维产业成长历史
图:PAN基碳纤维生产工艺流程
表:碳纤维产业链附加值
表:碳纤维按不同类别分类
表:不同碳纤维性能对比
图:PAN基碳纤维性能分类
表:碳纤维及其复合材料种类和主要应用
表:2009-2015年全球PAN基碳纤维产能及增长率
表:2015年全球主要碳纤维生产企业及其产能
图:2015年全球PNA基碳纤维产能(分国家/地区)市场格局
图:2010-2020年全球碳纤维需求量及增长率
表:2015-2020年全球碳纤维(分行业)需求预测及复合增速
表:2015-2020年全球碳纤维市场需求结构对比(分行业)
图:全球碳纤维生产企业三大梯队
图:2015年全球主要PAN基碳纤维生产商产能占比
图:2015年全球PAN基碳纤维(小丝束)企业市场份额
图:2015年全球PAN基碳纤维(大丝束)企业市场份额
表:2014年全球及中国主要企业碳纤维经营情况对比
表:国外主要企业原丝工艺技术及性能参数对比表
图:碳纤维生产过程及生产成本
图:2007-2015年全球碳纤维平均销售价格
图:2013-2020年全球碳纤维市场规模
表:2015年中国主要碳纤维生产企业及其产能
表:2016年中国碳纤维拟/在建项目情况
表:2014-2020年中国碳纤维行业供需预测
图:2010-2020年中国碳纤维需求量及增长率
图:2010-2020年中国碳纤维需求量占全球比重
图:2015-2020年中国碳纤维应用领域占比预测
图:2015年中国碳纤维产能分布(分省份)
图:中国碳纤维产业链企业布局
表:中国碳纤维生产企业技术装备情况
表:2009-2014年日本T700级碳纤维进口价格走势图
表:中国碳纤维行业低、高端产品市场价格对比
表:中复神鹰碳纤维性能指标参数
表:中国碳纤维产品发展阶段
表:2010-2014年中国进口碳纤维及制品主要应用领域占比
表:2013-2014年中国进口碳纤维及制品应用细分表(前十位)
图:2010-2015年中国碳纤维进出口量
图:2010-2015年中国碳纤维进出口平均价格
图:2015年1-11月中国碳纤维进口来源分布(按进口量)
图:2015年1-11月中国碳纤维出口目的地分布(按出口量)
图:2012-2015年中国碳纤维预浸料进出口量
图:2012-2015年中国碳纤维预浸料进出口平均价格
图:2015年1-11月中国碳纤维预浸料进口来源分布(按进口量)
图:2015年1-11月中国碳纤维预浸料出口目的地分布(按出口量)
图:2010-2015年中国其他碳纤维制品进出口量
图:2010-2015年中国其他碳纤维制品进出口平均价格
图:2015年1-11月中国其他碳纤维制品进口来源分布(按进口量)
图:2015年1-11月中国其他碳纤维制品出口目的地分布(按出口量)
图:2014年全球碳纤维原丝产能市场格局(分国家)
图:2013-2020年全球碳纤维复合材料市场规模及增长率
图:2014年全球碳纤维复合材料(分地区)市场规模占比
图:2014年不同基材的碳纤维复合材料销售收入占比
图:2013-2020年碳纤维增强塑料(CFRP)市场规模及增长率
图:碳纤维复合材料成本分解
表:2013-2015年全球碳纤维应用领域占比
图:2014年全球航空航天领域细分市场销售收入占比
图:2014年全球航空材料(分产品)市场份额
图:2014年全球航空材料(分用途)市场份额
图:波音787客机碳纤维复合材料应用情况
表:全球主要碳纤维生产企业在航空航天领域中的拓展
图:2013-2020年全球航空和国防用碳纤维复合材料市场规模
表:CFRP汽车零部件轻量化实例
表:全球整车厂商的碳纤维应用案例及供应商
表:2011-2015年全球主要碳纤维生产企业在汽车工业中的拓展
图:宝马i3的碳纤维车身生产工艺
图:全球汽车领域碳纤维使用量预测
图:碳纤维和钢铁制造汽车的成本对比
图:2013-2020年全球汽车用碳纤维复合材料市场规模
图:碳纤维复合零件的制造工艺及用途
图:聚丙烯腈碳纤维混合沥青碳纤维后性能显著提升
表:2005-2014年全球风电累计装机容量和新增装机容量
图:2014年全球(分地区)风电装机容量占比
图:2013-2020年全球风电用碳纤维复合材料市场规模
图:2014年全球体育休闲子市场碳纤维复合材料需求量占比
图:2013-2020年全球体育休闲用碳纤维复合材料市场规模
图:FY2010-FY2015日本东丽净销售额和净利润
图:FY2014日本东丽(分部门)销售收入占比
图:FY2010-FY2015日本东丽碳纤维部门净销售额与营业利润
表:FY2012-FY2014东丽碳纤维部门(按应用领域)销售收入
图:FY2012-FY2014东丽碳纤维部门(按应用领域)销售收入占比
表:2015年东丽碳纤维工厂及其产能
图:FY2010-FY2015帝人净销售额和净利润
图:FY2014帝人(分部门)销售收入占比
图:FY2011-FY2015日本Teijin先进纤维及其复合材料部门销售收入和营业利润
表:帝人集团下属碳纤维公司
表:日本东邦碳纤维主要应用领域
图:FY2010-FY2015三菱化学控股净销售额与净利润
表:FY2014三菱化学运营领域及主营业务销售收入占比
表:三菱丽阳基本信息
表:三菱丽阳下属碳纤维公司一览表
表:三菱丽阳碳纤维主要应用领域
表:三菱丽阳碳纤维业务发展情况
图:FY2010-FY2015日本吴羽净销售额和净利润
图:FY2013-FY2015日本Kureha(分业务)销售收入占比
图:FY2010-FY2015日本Kureha先进材料部门销售收入及营业利润
图:FY2013-FY2015日本Kureha先进材料部门主要产品销售收入
图:2010-2015年美国Hexcel净销售额与净利润
表:2013-2015年美国Hexcel(按市场)销售收入
图:2013-2015美国Hexcel(按市场)销售收入占比
图:2012-2014年美国Hexcel(分地区)销售收入占比
图:2010-2015年美国Cytec净销售额与净利润
图:2013-2015年美国Cytec(分部门)销售收入占比
图:2012-2014年美国Cytec(分地区)销售收入占比
图:2011-2015年美国Cytec航天材料部门销售收入及营业利润
图:2013-2015年美国Cytec航天材料部门(分地区)销售收入占比
图:2010-2015年德国SGL销售收入与净利润
图:2015年前三季度德国SGL(分部门)销售收入占比
图:2013-2014年德国SGL(分地区)销售收入占比
图:2014年德国SGL(分市场)销售收入占比
图:2013-2015年德国SGL碳纤维及复合材料部门销售收入及EBITDA
图:2014年德国SGL碳纤维及复合材料部门(分业务)销售收入占比
图:2014年德国SGL碳纤维及复合材料部门(分市场)销售收入占比
表:台塑事业部门及主营业务
图:2010-2015年台塑营业收入及净利润
图:2014年台塑(分部门)营业收入占比
图:2010-2014年台塑碳纤维销售收入及平均价格
图:2012-2014年台塑碳纤维业务(分地区)销售收入占比
图:2010-2014年台塑碳纤维产能、产量及开工率
图:2010-2014年台塑碳纤维销量和产销率
图:2010-2014年中钢吉炭营业收入和净利润
表:2012-2014年中钢吉炭(分产品)营业收入
图:2012-2014年中钢吉炭(分产品)营业收入占比
表:2012-2014年中钢吉炭(分地区)营业收入
图:2012-2014年中钢吉炭(分地区)营业收入占比
表:2012-2014年中钢吉炭主营产品毛利率
图:2012-2014年神舟碳纤维营业收入和净利润
图:2010-2015年奇峰化纤营业收入和净利润
表:2013-2015年奇峰化纤(分产品)营业收入
图:2013-2015年奇峰化纤(分产品)营业收入占比
表:2013-2015年奇峰化纤主营产品毛利率
图:2013-2015年奇峰化纤产量、销量及产销率
表:2013-2015年奇峰化纤主营产品销售量
表:2012-2014年奇峰化纤产品平均售价、丙烯腈采购价格及价差
表:2013-2015年奇峰化纤主营产品平均售价
图:2013-2015年恒神股份营业收入和净利润
表:2013-2015年恒神股份(分产品)营业收入
表:2013-2015年恒神股份(分产品)营业收入占比
表:2013-2014年恒神股份(分地区)营业收入
图:2013-2014年恒神股份(分地区)营业收入占比
表:2013-2014年恒神股份主营产品毛利率
图:2013-2015年恒神股份前五名客户贡献收入及占比
表:2015H1恒神股份前五名客户名称、收入贡献及占比
图:2013-2014年恒神股份前五名供应商采购金额及占比
表:2014年恒神股份前五名供应商名称、采购金额及占比
图:2012-2015年江城碳纤维营业收入和净利润
图:2013-2015年金发碳纤维营业收入和净利润
图:2014-2015年吉研高科营业收入和净利润
表:2012-2014年嘉兴中宝营业收入和净利润
表:2012-2014年嘉兴中宝主营产品产量
图:2010-2014年大元股份碳纤维产品毛利率
图:2011-2013年江苏天鸟营业收入和净利润
表:2011-2013年江苏天鸟(分产品)营业收入
图:2011-2013年江苏天鸟(分产品)营业收入占比
表:2011-2013年江苏天鸟(分地区)营业收入
表:2011-2013年江苏天鸟(分地区)营业收入
图:2011-2013年江苏天鸟主营产品毛利率
表:2011-2013年江苏天鸟主营产品产能
表:2011-2013年江苏天鸟主营产品产量
表:2011-2013年江苏天鸟主营产品销量
表:2011-2013年江苏天鸟主营产品销售价格
图:山西恒天碳纤维原丝主要下游客户
Performance Comparison of Carbon Fiber and Conventional Materials
Development History of Carbon Fiber Industry
PAN-based Carbon Fiber Production Process
Value Added of Carbon Fiber Industry Chain
Classification of Carbon Fiber by Type
Performance Comparison of Carbon Fibers
Classification of PAN-based Carbon Fibers by Performance
Varieties and Main Applications of Carbon Fiber and CFRP
Global PAN-based Carbon Fiber Capacity and Growth Rate, 2009-2015
Major Global Carbon Fiber Producers and Their Capacity, 2015
Market Pattern of Global PAN-based Carbon Fiber Capacity by Country/Region, 2015
Global Carbon Fiber Demand and Growth Rate, 2010-2020E
Global Carbon Fiber Demand and CAGR by Sector, 2015-2020E
Global Carbon Fiber Demand Structure by Sector, 2015-2020E
Three Tiers of Carbon Fiber Producers Worldwide
Percentage of Capacity of Major Global PAN-based Carbon Fiber Producers, 2015
Market Share of Global PAN-based Carbon Fiber (Small Tow) Producers, 2015
Market Share of Global PAN-based Carbon Fiber (Large Tow) Producers, 2015
Carbon Fiber Business Operation of Major Global and Chinese Producers, 2014
Precursor Technologies and Performance Parameters of Major Foreign Companies
Production Process and Costs and Carbon Fiber
Average Selling Price of Carbon Fiber Worldwide, 2007-2015
Global Carbon Fiber Market Size, 2013-2020E
Major Chinese Carbon Fiber Producers and Their Capacity, 2015
Proposed and Ongoing Carbon Fiber Projects in China, 2016
Carbon Fiber Supply and Demand in China, 2014-2020E
China’s Carbon Fiber Demand and Growth Rate, 2010-2020E
China’s Percentage of Global Carbon Fiber Demand, 2010-2020E
Application Structure of Carbon Fiber in China, 2015-2020E
Distribution of Carbon Fiber Capacity in China by Province, 2015
Companies’ Layout in Carbon Fiber Industry Chain in China
Technical Equipment of Carbon Fiber Producers in China
Import Price Trend of Japanese T700 Carbon Fiber, 2009-2014
Market Price of Low and High-end Products in Carbon Fiber Industry in China
Performance Parameters of Zhongfu Shenying Carbon Fiber
Development Stage of Carbon Fibers in China
Application Structure of Imported Carbon Fiber and Products in China, 2010-2014
Applications of Imported Carbon Fiber and Products in China (Top10), 2013-2014
China’s Carbon Fiber Imports and Exports, 2010-2015
Average Import and Export Prices of Carbon Fiber in China, 2010-2015
Sources of China’s Carbon Fiber Imports by Import Volume, Jan-Nov 2015
Destinations of China’s Carbon Fiber Exports by Export Volume, Jan-Nov 2015
China’s Carbon Fiber Prepreg Imports and Exports, 2012-2015
Average Import and Export Prices of Carbon Fiber Prepreg in China, 2012-2015
Sources of China’s Carbon Fiber Prepreg Imports by Import Volume, Jan-Nov 2015
Destinations of China’s Carbon Fiber Prepreg Exports by Export Volume, Jan-Nov 2015
China’s Imports and Exports of Other Carbon Fiber Products, 2010-2015
Average Import and Export Prices of Other Carbon Fiber Products in China, 2010-2015
Sources of China’s Imports of Other Carbon Fiber Products by Import Volume, Jan-Nov 2015
Destinations of China’s Exports of Other Carbon Fiber Products by Export Volume, Jan-Nov 2015
Market Pattern of Global Carbon Fiber Precursor Capacity by Country, 2014
Global CFRP Market Size and Growth Rate, 2013-2020E
Structure of Global CFRP Market Size by Region, 2014
Percentage of Sales from CFRP Based on Different Materials, 2014
Cost Breakdown of CFRP
Application Structure of Carbon Fiber Worldwide, 2013-2015
Structure of Sales in Aerospace Market Segment Worldwide, 2014
Market Share of Aeronautical Materials by Product, 2014
Market Share of Aeronautical Materials by Application, 2014
Application of CFRP in Boeing 787 Dreamliner
Expansion of Major Global Carbon Fiber Producers in Aerospace Field
Global Market Size of CFRP for Aerospace and National Defense, 2013-2020E
Lightweight CFRP Automotive Parts
Carbon Fiber Application Cases and Suppliers of Global Carmakers
Expansion of Major Global Carbon Fiber Producers in Automobile Industry, 2011-2015
Carbon-fiber Body Production Process of BMW i3
Forecast for Carbon Fiber Consumption in Automotive Field Worldwide
Cost Comparison of Carbon-fiber Car and Steel Car
Global Market Size of CFRP for Automobile Worldwide, 2013-2020E
Manufacturing Process of and Application of CFRP Parts
Significant Improvement in Performance of PAN-based Carbon Fiber Mixed with Pitch-based Carbon Fiber
Global Cumulative and New Wind Power Capacity, 2005-2014
Global Installed Wind Power Capacity Structure by Region, 2014
Global Market Size of CFRP for Wind Power, 2013-2020E
Ratio of Demand for CFRP from Sports Leisure Market Segment, 2014
Global Market Size of CFRP for Sports Leisure, 2013-2020E
Revenue and Net Income of Toray, FY2010-FY2015
Revenue Structure of Toray by Division, FY2014
Revenue and Operating Profit of Toray's Carbon Fiber Division, FY2010-FY2015
Revenue Breakdown of Toray's Carbon Fiber Division by Application, FY2012-FY2014
Revenue Structure of Toray's Carbon Fiber Division by Application, FY2012-FY2014
Carbon Fiber Factories and Capacity of Toray, 2015
Revenue and Net Income of Teijin, FY2010-FY2015
Revenue Structure of Teijin by Division, FY2014
Revenue and Operating Profit of Teijin’s Advanced Fibers & Composites Division, FY2011-FY2015
Carbon Fiber Companies under Teijin
Main Applications of Toho’s Carbon Fibers
Revenue and Net Income of Mitsubishi Chemical Holdings, FY2010-FY2015
Operations and Operating Revenue Structure of Mitsubishi Chemical Holdings, FY2014
Basic Information of Mitsubishi Rayon
Carbon Fiber Companies under Mitsubishi Rayon
Main Applications of Mitsubishi Rayon’s Carbon Fibers
Development of Mitsubishi Rayon’s Carbon Fiber Business
Revenue and Net Income of Kureha, FY2010-FY2015
Revenue Structure of Kureha by Business, FY2013-FY2015
Revenue and Operating Profit of Kureha’s Advanced Materials Division
Revenue from Main Products of Kureha’s Advanced Materials Division, FY2013-FY2015
Revenue and Net Income of Hexcel, 2010-2015
Revenue Breakdown of Hexcel by Market, 2013-2015
Revenue Structure of Hexcel by Market, 2013-2015
Revenue Structure of Hexcel by Region, 2012-2014
Revenue and Net Income of Cytec, 2010-2015
Revenue Structure of Cytec by Division, 2013-2015
Revenue Structure of Cytec by Region, 2012-2014
Revenue and Operating Profit of Cytec’s Aerospace Materials Division, 2011-2015
Revenue Structure of Cytec’s Aerospace Materials Division by Region, 2013-2015
Revenue and Net Income of SGL Carbon, 2010-2015
Revenue Structure of SGL Carbon by Division, Q1-Q3 2015
Revenue Structure of SGL Carbon by Region, 2013-2014
Revenue Structure of SGL Carbon by Market, 2014
Revenue and EBITDA of SGL Carbon’s Carbon Fibers and Composites Division, 2013-2015
Revenue Structure of SGL Carbon’s Carbon Fibers and Composites Division by Business, 2014
Revenue Structure of SGL Carbon’s Carbon Fibers and Composites Division by Market, 2014
Business Divisions and Primary Businesses of Formosa Plastics
Revenue and Net Income of Formosa Plastics, 2010-2015
Revenue Structure of Formosa Plastics by Division, 2014
Revenue from and Average Price of Formosa Plastics’s Carbon Fiber, 2010-2014
Revenue Structure of Formosa Plastics’s Carbon Fiber Business by Region, 2012-2014
Carbon Fiber Capacity, Output and Utilization of Formosa Plastics, 2010-2014
Carbon Fiber Sales Volume and Sales-Output Ratio of Formosa Plastics, 2010-2014
Revenue and Net Income of Sinosteel Jilin Carbon, 2010-2014
Revenue Breakdown of Sinosteel Jilin Carbon by Product, 2012-2014
Revenue Structure of Sinosteel Jilin Carbon by Product, 2012-2014
Revenue Breakdown of Sinosteel Jilin Carbon by Region, 2012-2014
Revenue Structure of Sinosteel Jilin Carbon by Region, 2012-2014
Gross Margin of Main Products of Sinosteel Jilin Carbon, 2012-2014
Revenue and Net Income of Jilin Shenzhen Carbon Fiber, 2012-2014
Revenue and Net Income of Jilin Qifeng Chemical Fiber, 2010-2015
Revenue Breakdown of Jilin Qifeng Chemical Fiber by Product, 2013-2015
Revenue Structure of Jilin Qifeng Chemical Fiber by Product, 2013-2015
Gross Margin of Main Products of Jilin Qifeng Chemical Fiber, 2013-2015
Output, Sales Volume and Sales-Output Ratio of Jilin Qifeng Chemical Fiber, 2013-2015
Sales Volume of Main Products of Jilin Qifeng Chemical Fiber, 2013-2015
Average Selling Prices of Products, Purchase Price of Acrylonitrile, and Price Difference of Jilin Qifeng Chemical Fiber, 2012-2014
Average Selling Prices of Main Products of Jilin Qifeng Chemical Fiber, 2013-2015
Revenue and Net Income of Hengshen, 2013-2015
Revenue Breakdown of Hengshen by Product, 2013-2015
Revenue Structure of Hengshen by Product, 2013-2015
Revenue Breakdown of Hengshen by Region, 2013-2014
Revenue Structure of Hengshen by Region, 2013-2014
Gross Margin of Main Products of Hengshen, 2013-2014
Hengshen’s Revenue from Top5 Customers and % of Total Revenue, 2013-2015
Name list and Revenue Contribution of Hengshen’s Top5 Customers, 2015H1
Hengshen’s Procurement from Top5 Suppliers and % of Total Procurement, 2013-2014
Name list and Procurement of Hengshen’s Top 5 Suppliers, 2014
Revenue and Net Income of Jilin FangdaJiangcheng Carbon Fiber, 2012-2015
Revenue and Net Income of Kingfa Carbon Fiber Materials, 2013-2015
Revenue and Net Income of Jiyan High-Tech Fibers, 2014-2015
Revenue and Net Income of Jiaxing Sino-Dia Carbon Fibre, 2012-2014
Output of Main Products of Jiaxing Sino-Dia Carbon Fibre, 2012-2014
Gross Margin of Carbon Fibers of Shangying Global, 2010-2014
Revenue and Net Income of Jiangsu Tianniao High Technology, 2011-2013
Revenue Breakdown of Jiangsu Tianniao High Technology by Product, 2011-2013
Revenue Structure of Jiangsu Tianniao High Technology by Product, 2011-2013
Revenue Breakdown of Jiangsu Tianniao High Technology by Region, 2011-2013
Revenue Structure of Jiangsu Tianniao High Technology by Region, 2011-2013
Gross Margin of Main Products of Jiangsu Tianniao High Technology, 2011-2013
Capacity of Main Products of Jiangsu Tianniao High Technology, 2011-2013
Output of Main Products of Jiangsu Tianniao High Technology, 2011-2013
Sales Volume of Main Products of Jiangsu Tianniao High Technology, 2011-2013
Selling Prices of Main Products of Jiangsu Tianniao High Technology, 2011-2013
Major Downstream Customers for Carbon Fiber Precursor of Shanxi Hengtian New Textile Fiber Tech
如果这份报告不能满足您的要求,我们还可以为您定制报告,请 留言说明您的详细需求。
|