|
|
|
报告导航:研究报告—
制造业—工业机械
|
|
2016-2018年全球及中国自动光学检测行业研究报告 |
 |
字数:5.0万 |
页数:190 |
图表数:178 |
|
中文电子版:8000元 |
中文纸版:4000元 |
中文(电子+纸)版:8500元 |
|
英文电子版:2500美元 |
英文纸版:2700美元 |
英文(电子+纸)版:2800美元 |
|
编号:ZJF082
|
发布日期:2016-02 |
附件:下载 |
 |
|
|
随着电子产品的小型化以及低能耗化,其产品元器件趋于微型化,元件在装配过程中越来越不可能采用人工检视的方式,必须采用自动检测设备;另一方面,随着人工成本越来越高,电子制造企业出于对产品品质和成本控制的需求,将加速AOI检测设备替代人工的进程。在这种环境下,全球及中国自动光学检测设备在未来几年将经历快速发展,2015年,中国自动光学检测设备市场规模达到76.2亿元,在全球AOI市场规模中占比20.9%,预计2014-2018年中国AOI市场规模的年均复合增长率将达到16.8%。
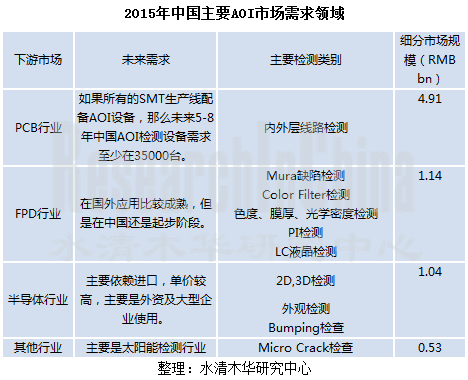
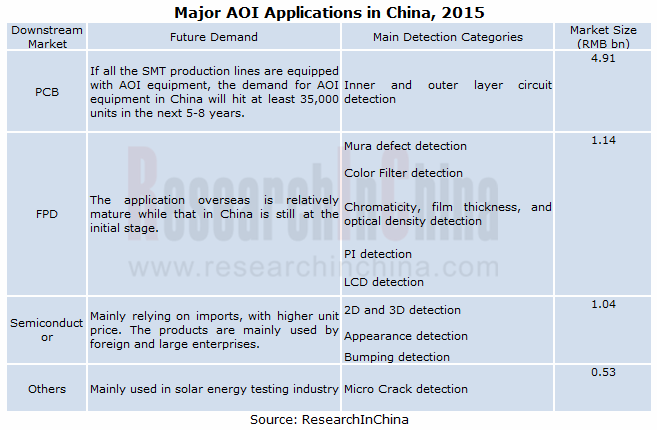
AOI检测主要用在PCB、FPD、半导体等行业。目前在中国应用最广的是PCB行业,2015年,PCB行业AOI市场规模达到49.1亿元,占据AOI总市场规模的64.4%;FPD行业装配AOI市场规模为11.4亿元,占据AOI总市场规模的15.0%;半导体行业装配AOI市场规模为10.4亿元,占据AOI总市场规模的13.6%;包括光伏电池在内的其他行业装配AOI市场规模为5.3亿元,占据AOI总市场规模的7.0%。
在竞争格局方面,2005年之前国内AOI 检测设备市场几乎全部由国外品牌的设备所独占,此后国内部分具备一定研发实力的生产厂商,抓住市场机会,研发出国产AOI 检测设备。代表企业有东莞的神州视觉、上海矩子智能、深圳易科讯、深圳振华兴、浙江欧威科技、深圳劲拓等。但是,相比国外AOI设备公司,这些公司资本额低,研发实力弱,技术创新弱,主要集中于下游制程(如PCB),应对能力弱,竞争惨烈。
目前,AOI国际厂商有的以全产品线的方式占领各主要细分领域,代表企业为以色列的奥宝科技、日本的网屏以及韩国的高永科技;有的以前端产业(如半导体、FPD等)为主攻市场,占据高端市场,代表企业为欧姆龙、KLA-Tencor、HB等。同时,台湾部分厂商则凭借原有的电子产业配套关系,延伸到大陆市场,形式另一股竞争势力,如德律科技、由田新技、牧德科技等。
《2016 -2018年全球及中国自动光学检测(AOI)行业研究报告》主要进行了以下研究:
 自动光学检测行业概况(包括定义、分类、组成结构、优势、相关技术、产业链、市场特点、经营模式等) 自动光学检测行业概况(包括定义、分类、组成结构、优势、相关技术、产业链、市场特点、经营模式等)
全球自动光学检测市场(包括市场现状、市场规模、竞争格局、发展趋势等)
中国自动光学检测市场(包括行业政策、市场现状、市场规模、市场需求、竞争格局、发展前景等)
自动光学检测行业下游(包括PCB行业、FPD行业、IC行业等市场规模及市场需求等)
包括奥宝科技、康代、欧姆龙、网屏、HB、高永科技、KLA-Tencor、德律科技、由田新技、美德客以及赛凯在内的11家全球主要自动光学检测企业(包括企业简介、经营业绩、营收构成、研发支出、AOI业务、发展战略、在华业务等)
包括神州视觉、上海矩子智能、深圳易科讯、深圳振华兴、浙江欧威科技、深圳劲拓在内、中导光电、南京协力等在内的10家中国主要自动光学检测企业(包括企业简介、经营业绩、营收构成、研发支出、AOI业务、发展战略等)
As electronic products develop towards miniaturization and low-energy consumption, their product components tend to be miniaturized. Thus, it is increasingly unlikely that the components are inspected through manual review, and instead they have to turn to automatic inspection equipment. On the other hand, with the growing labor cost, electronic manufacturing enterprises due to their demand for the product quality and cost control will accelerate the AOI equipment substitution for human labor. Therefore, global and Chinese automatic optic inspection (AOI) equipment will undergo rapid development in future years. In 2015, China’s AOI equipment market size came to RMB7.62 billion, accounting for 20.9% of the global total, registering an estimated CAGR of 16.8% during 2014-2018.
AOI is primarily applied in PCB, FPD, semiconductor, and other industries. In nowadays China, PCB industry enjoys the widest application. In 2015, the market size of AOI applied in PCB industry reached RMB4.91 billion, accounting for 64.4% of the total; that in FPD industry came to RMB1.14 billion, occupying 15.0%; that in semiconductor industry attained RMB1.04 billion, making up 13.6% of the total AOI market; that in other industries including photovoltaic cells was RMB530 million, representing 7.0%.
Concerning the competitive landscape, prior to 2005, China’s AOI equipment market was virtually monopolized by foreign branded equipment. Subsequently, some domestic manufacturers with certain R&D strength, such as ALeader, Jutze Intelligence, ekt-Tech, ZhenHuaXing Technology, Ovi Technology, and JT Automation Equipment, seized market opportunities and successfully developed China-made AOI equipment. Compared with foreign counterparts, however, these companies have less capital and weak R&D strength, hence poor technical innovation. They mainly focus on the downstream process (say, PCB), and therefore have weak capacity to respond to the market, a situation that led to a fierce competition.
At present, some international AOI equipment manufacturers like Israeli-based Orbotech, Japan-based Screen and South Korea-based KohYoung Technology occupy major market segments with a full range of product lines. Other enterprises, such as Omron, KLA-Tencor, and HB, specialize in front-end industries like semiconductor and FPD, taking up the high-end market. Meanwhile, some Taiwanese companies e.g. TRI, Utechzone, and MACHVISION by virtue of their original electronics industry supply relationship have extended their presence to mainland Chinese market and have formed another new competition force.
The report highlights the followings:
 Overview of AOI industry, including definition, classification, composition and structure, advantages, related technologies, industrial chain, market characteristics, operation model, etc.; Overview of AOI industry, including definition, classification, composition and structure, advantages, related technologies, industrial chain, market characteristics, operation model, etc.;
Global AOI market, including market status, market size, competitive landscape, development trend, etc.;
China’s AOI market, including industry policy, market status, market size, market demand, competitive landscape, development prospects, etc.;
Downstream sectors of AOI industry, including market size and market demand of PCB, FPD industry, IC, etc.;
11 global AOI enterprises such as Orbotech, Camtek, Omron, Screen, HB Technology, KohYoung Technology, KLA - Tencor, TRI, Utechzone, Mirtec, and SAKI (including their profile, operation, revenue structure, R&D costs, AOI business, development strategy, and business in China);
10 Chinese AOI enterprises such as ALeader, Jutze Intelligence, Ekt-Tech, ZhenHuaXing Technology, Ovi Technology, JT Automation Equipment, 3i Systems, and Xieli Electronic (including their profile, operation, revenue structure, R&D costs, AOI business, and development strategy).
第一章 自动光学检测行业概况
1.1 定义和分类
1.1.1 定义
1.1.2 分类
1.2 组成结构及优势
1.2.1 组成结构
1.2.2 优势及特点
1.3 AOI相关技术
1.3.1 概况
1.3.2 技术发展趋势
1.4 产业链
1.4.1 概况
1.4.2 上游
1.4.3 下游
1.5 行业政策
第二章 全球自动光学检测市场
2.1 市场规模
2.2 竞争格局
第三章 中国自动光学检测市场
3.1 市场现状及市场规模
3.2 市场需求
3.3 竞争格局
3.4 发展前景
第四章 PCB行业检测市场
4.1 概况
4.2 PCB行业运行情况
4.3 PCB行业AOI市场规模
第五章 TFT-LCD行业检测市场
5.1 概况
5.2 TFT-LCD行业运行情况
5.3 FPD行业AOI市场规模
第六章 半导体行业检测
6.1 概况
6.2 整体市场运行情况
6.3 IC行业运行情况
6.4 半导体AOI市场规模
第七章 全球主要自动光学检测企业
7.1 奥宝科技Orbotech
7.1.1 公司简介
7.1.2 经营业绩
7.1.3 营收构成
7.1.4 研发支出
7.1.5 毛利率分析
7.1.6光学检测设备业务
7.1.7 主要AOI解决方案
7.1.8 发展战略
7.1.9 在华业务
7.2 康代Camtek
7.2.1 公司简介
7.2.2 经营业绩
7.2.3 营收构成
7.2.4 毛利率分析
7.2.5 研发支出
7.2.6 AOI业务
7.2.7 在华业务
7.2.8 康代影像科技有限公司
7.3 KLA-Tencor
7.3.1 公司简介
7.3.2 经营业绩
7.3.3 营收结构
7.3.4 研发支出
7.3.5 主要产品
7.3.6 在华业务
7.3.7艺高半导体设备(深圳)有限公司
7.4 欧姆龙Omron
7.4.1 公司简介
7.4.2 经营业绩
7.4.3 营收构成
7.4.4 毛利率分析
7.4.5 研发支出
7.4.6 工业自动化控制事业
7.4.7 AOI业务
7.4.8 在华业务
7.5 高永技术KohYoung Technology
7.5.1 公司简介
7.5.2 经营业绩
7.5.3 收入结构
7.5.4 毛利率分析
7.5.5 研发支出
7.5.6 AOI业务
7.6 网屏Screen
7.6.1 公司简介
7.6.2 经营业绩
7.6.3 营收构成
7.6.4 研发支出
7.6.5 AOI业务
7.6.6 在华业务
7.7 HB Technology(韩国)
7.7.1 公司简介
7.7.2 经营业绩
7.7.3 营收构成
7.7.4 毛利率
7.7.5 研发支出
7.7.6 AOI业务
7.8 德律科技TRI
7.8.1 公司简介
7.8.2 经营业绩
7.8.3 营收构成
7.8.4 毛利率分析
7.8.5 研发支出
7.8.6 主要产品产销量
7.8.7 光学检测设备业务
7.8.8 在中国大陆业务
7.8.9德律泰电子(深圳)有限公司
7.8.10 发展战略
7.9由田新技Utechzone
7.9.1 公司简介
7.9.2 经营业绩
7.9.3 营收构成
7.9.4 毛利率
7.9.5 研发支出
7.9.6 主要产品产销量
7.9.7 主要供货商及客户
7.9.8 光学检测设备业务
7.9.9 发展战略
7.10 美德客科技Mirtec
7.10.1 公司简介
7.10.2 AOI业务
7.10.3 在华业务
7.11赛凯SAKI
7.11.1 公司简介
7.11.2 AOI业务
7.11.3 在华业务
第八章 中国主要自动光学检测企业
8.1 深圳市劲拓自动化设备(JT Automation Equipment)
8.1.1 公司简介
8.1.2 经营业绩
8.1.3 营收构成
8.1.4 毛利率
8.1.5 研发投入
8.1.6 AOI业务
8.1.7 募投项目
8.1.8 发展战略
8.2北京星河康帝思科技(Star River Comtes)
8.2.1 公司简介
8.2.2 经营业绩
8.2.3 营收结构
8.2.4 毛利率
8.2.5 研发支出
8.3 东莞市神州视觉科技(Aleader)
8.3.1 公司简介
8.3.2 AOI业务
8.4 上海矩子智能科技(Jutze Intelligence)
8.4.1 公司简介
8.4.2 AOI业务
8.5 深圳易科讯科技(Ekt-Tech)
8.5.1 公司简介
8.5.2 AOI业务
8.6 深圳振华兴科技(Zhenhua xing Technology)
8.6.1 公司简介
8.6.2 AOI业务
8.6.3 主要客户及销售网络
8.7 浙江欧威科技(Ovi Technology)
8.7.1 公司简介
8.7.2 AOI业务
8.8 江苏明富自动化科技
8.8.1 公司简介
8.8.2 AOI业务
8.9 中导光电
8.9.1 公司简介
8.9.2 AOI业务
8.9.3 主要客户及销售网络
8.10 南京协力
8.10.1 公司简介
8.10.2 AOI业务
1. Overview of AOI Industry
1.1 Definition and Classification
1.1.1 Definition
1.1.2 Classification
1.2 Composition and Advantages
1.2.1 Composition and Structure
1.2.2 Advantages and Characteristics
1.3 AOI Related Technologies
1.3.1 Profile
1.3.2 Trends
1.4 Industry Chain
1.4.1 Profile
1.4.2 Upstream
1.4.3 Downstream
1.5 Industry Policy
2. Global AOI Market
2.1 Market Size
2.2 Competition
3. China AOI Market
3.1 Market Status and Market Size
3.2 Market Demand
3.3 Competition
3.4 Prospects
4. Application of AOI in PCB
4.1 Profile
4.2 Operation of PCB Industry
4.3 AOI Market Size
5. Application of AOI in TFT-LCD
5.1 Profile
5.2 Operation of TFT-LCD Industry
5.3 AOI Market Size
6. Application of AOI in Semiconductor
6.1 Profile
6.2 Overall Market Operation
6.3 Operation of IC Industry
6.4 AOI Market Size
7. AOI Players Worldwide
7.1 Orbotech
7.1.1 Profile
7.1.2 Operation
7.1.3 Revenue Structure
7.1.4 R&D Expenditure
7.1.5 Gross Margin
7.1.6 AOI Business
7.1.7 AOI Solutions
7.1.8 Development Strategy
7.1.9 Business in China
7.2 Camtek
7.2.1 Profile
7.2.2 Operation
7.2.3 Revenue Structure
7.2.4 Gross Margin
7.2.5 R&D Expenditure
7.2.6 AOI Business
7.2.7 Business in China
7.2.8 Camtek Imaging Technology Co., Ltd.
7.3 KLA-Tencor
7.3.1 Profile
7.3.2 Operation
7.3.3 Revenue Structure
7.3.4 R&D Expenditure
7.3.5 Main Products
7.3.6 Business in China
7.3.7 ICOS Semiconductor Equipment (Shenzhen) Co., Ltd.
7.4 Omron
7.4.1 Profile
7.4.2 Operation
7.4.3 Revenue Structure
7.4.4 Gross Margin
7.4.5 R&D Expenditure
7.4.6 Industrial Automation & Control
7.4.7 AOI Business
7.4.8 Business in China
7.5 KohYoung Technology
7.5.1 Profile
7.5.2 Operation
7.5.3 Revenue Structure
7.5.4 Gross Margin
7.5.5 R&D Expenditure
7.5.6 AOI Business
7.6 Screen
7.6.1 Profile
7.6.2 Operation
7.6.3 Revenue Structure
7.6.4 R&D Expenditure
7.6.5 AOI Business
7.6.6 Business in China
7.7 HB Technology (Korea)
7.7.1 Profile
7.7.2 Operation
7.7.3 Revenue Structure
7.7.4 Gross Margin
7.7.5 R&D Expenditure
7.7.6 AOI Business
7.8 TRI
7.8.1 Profile
7.8.2 Operation
7.8.3 Revenue Structure
7.8.4 Gross Margin
7.8.5 R&D Expenditure
7.8.6 Output and Sales Volume
7.8.7 AOI Business
7.8.8 Business in Mainland China
7.8.9 Tri Electronic (Shenzhen) Co., Ltd.
7.8.10 Development Strategy
7.9 Utechzone
7.9.1 Profile
7.9.2 Operation
7.9.3 Revenue Structure
7.9.4 Gross Margin
7.9.5 R&D Expenditure
7.9.6 Output and Sales Volume
7.9.7 Customers and Suppliers
7.9.8 AOI Business
7.9.9 Development Strategy
7.10 Mirtec
7.10.1 Profile
7.10.2 AOI Business
7.10.3 Business in China
7.11 SAKI
7.11.1 Profile
7.11.2 AOI Business
7.11.3 Business in China
8. AOI Players in China
8.1 JT Automation Equipment
8.1.1 Profile
8.1.2 Operation
8.1.3 Revenue Structure
8.1.4 Gross Margin
8.1.5 R&D Input
8.1.6 AOI Business
8.1.7 Fund-raising Projects
8.1.8 Development Strategy
8.2 Star River Comtes
8.2.1 Profile
8.2.2 Operation
8.2.3 Revenue Structure
8.2.4 Gross Margin
8.2.5 R&D Expenditure
8.3 ALeader
8.3.1 Profile
8.3.2 AOI Business
8.4 Jutze Intelligence
8.4.1 Profile
8.4.2 AOI Business
8.5 ekt-Tech
8.5.1 Profile
8.5.2 AOI Business
8.6 ZhenHuaXing Technology
8.6.1 Profile
8.6.2 AOI Business
8.6.3 Customers and Sales Network
8.7 Ovi Technology
8.7.1 Profile
8.7.2 AOI Business
8.8 Mingfu Automation
8.8.1 Profile
8.8.2 AOI Business
8.9 3i Systems
8.9.1 Profile
8.9.2 AOI Business
8.9.3 Customers and Sales Network
8.10 Xieli Electronic
8.10.1 Profile
8.10.2 AOI Business
光学检测设备分类
AOI系统组成
AOI设备优势
AOI设备行业相关技术
AOI设备产业链
光学检测设备上游原材料主要供货来源国
AOI主要应用行业及检测项目
SMT工艺流程
AOI设备在SMT生产线中的应用
AOI在太阳能电池生产线中的应用
2006-2015年中国AOI行业相关政策
2013-2018年全球AOI市场规模及同比增长(USD bn)
2013-2018年全球AOI市场规模(分应用行业)
全球主要AOI厂商及其AOI业务收入
国外及中国AOI设备厂商优势和劣势对比
2014-2018年中国AOI市场规模(RMB bn)
2015年中国主要AOI市场需求领域
2014-2018年中国主要AOI市场需求领域市场规模(RMB bn)
中国AOI市场主要厂商市场份额(RMB mln)
中国主要AOI厂家及AOI业务收入
PCB产业链
AOI在PCB行业应用
2011-2018年全球PCB产值及同比增长(USD bn)
2012-2018年全球PCB细分市场产值
2010-2019年全球PCB产值构成(分区域)
2010-2019年中国大陆PCB产值及同比增长
2010-2018年全球应用于PCB检测的AOI市场规模及同比增长(USD mln)
2013-2018年中国应用于PCB检测的AOI市场规模及同比增长(RMB bn)
AOI在TFT-LCD生产线中的应用
TFT-LCD生产过程主要检查设备
2010-2018年全球大尺寸TFT-LCD面板出货量及同比增长
2010-2015年全球大尺寸TFT-LCD面板出货量(分应用领域)(unit mln)
2015年末中国第八代及以上TFT-LCD面板产能现状
2013-2018年全球应用于FPD行业检测的AOI市场规模及同比增长(USD bn)
2014-2018年中国应用于FPD行业检测的AOI市场规模(RMB mln)
AOI在晶圆制造中的应用
AOI在晶圆测试中应用
AOI在IC封装中应用
AOI在IC测试中应用
2010-2017年全球半导体行业销售额及同比增长(USD bn)
2011-2017年全球半导体行业销售额构成(分产品)
2011-2017年全球半导体行业销售额构成(分区域)
2014-2015年全球Top10半导体供应商收入(USD mln)
2011-2017年全球集成电路行业销售额及同比增长(USD bn)
2010-2015年中国集成电路行业销售额及同比增长(RMB bn)
2007-2015年中国集成电路行业销售额在全球集成电路销售额中占比
2010-2016年全球半导体设备销售额(分区域)(USD bn)
2012-2018年全球半导体制程控制设备市场规模(USD mln)
2012-2018年中国半导体制程控制设备市场规模测算表
2012-2018年中国半导体AOI市场规模测算表
2009-2015年奥宝科技营业收入及净利润(USD mln)
2009-2015年奥宝科技营收构成(分业务)(USD mln)
2003-2015年奥宝科技营收构成(分区域)(USD mln)
2009-2015年奥宝科技研发支出、同比增长及其占营业收入比例
2009-2015年奥宝科技毛利、同比增长及毛利率
奥宝科技主要产品及其竞争者(分行业)
2010-2014年奥宝科技主要产品安装量
奥宝科技核心市场的新技术
奥宝科技应用于PCB行业检测的AOI
奥宝科技应用于FPD行业检测的AOI
2009-2014年奥宝科技来自中国的收入、同比增长及其占总营业收入比例
2009-2015年康代营业收入及净利润(USD mln)
2009-2015年康代营收构成(分业务)
2009-2014年康代营收构成(分区域)
2009-2015年康代毛利、同比增长及毛利率
2009-2015年康代研发支出、同比增长及其占营业收入比例
Eagle系列AOI产品
Condor系列AOI产品
Gannet系列AOI产品
Falcon系列AOI产品
Phoenix系列AOI产品
Dragon系列AOI产品
Orion系列AOI产品
LAM系列AOI产品
康代主要子公司
2011-2015财年KLA-Tencor营业收入及净利润(USD mln)
2013-2015年KLA-Tencor营收构成(分业务)
2013-2015年KLA-Tencor营收构成(分区域)
2013-2015财年 KLA-Tencor研发支出及其占营业收入比例
KLA-Tencor主要产品
欧姆龙集团员工结构
2010-2016财年欧姆龙营业收入及净利润(JPY bn)
2010-2016财年欧姆龙营收构成(分业务)
2010-2016财年欧姆龙营收构成(分区域)
2010-2016财年欧姆龙毛利、同比增长及毛利率(JPY bn)
2010-2016财年欧姆龙研发支出、同比增长及其占营业收入比例(JPY bn)
2012-2016财年欧姆龙工业自动化控制事业营业收入及营业利润
2011-2016财年欧姆龙工业自动化控制事业营收构成(分区域)
2011-2015财年欧姆龙工业自动化控制事业研发支出、同比增长及其占该部门收入比例
欧姆龙光学检测设备主要产品
2012-2014年欧姆龙在华员工人数
2010-2016财年欧姆龙大中华地区销售收入(JPY bn)
高永技术事业成长模型
2009-2015年高永技术营业收入及同比增长
2012-2015年高永技术主要产品及区域销售收入(KRW mln)
2012-2015年高永技术毛利、同比增长及毛利率
2012-2015年高永技术研发支出及其占营业收入比例
高永技术SMI解决方案
高永技术半导体解决方案
2010-2016财年网屏营业收入及同比增长(JPY bn)
2011-2016财年网屏营收构成(分部门)
2011-2016财年网屏营收构成(分区域)
2011-2016财年网屏旗下媒体与精密技术公司营收构成
2010-2016财年网屏研发支出、同比增长及其占营业收入比例
2011-2015财年网屏持有的专利数量
网屏集团主要AOI设备
2010-2016财年网屏PCB相关装备收入及同比增长
2009-2015年HB Technology营业收入及同比增长(KRW mln)
2010-2015年HB Technology营收构成(分产品及销售渠道)(KRW mln)
2009-2015年HB Technology毛利、同比增长及毛利率(KRW mln)
2010-2015年HB Technology研发支出及其占营业收入比例
2013-2015年HB Technology AOI产能
2010-2015年HB Technology AOI产品产量及平均销售价格
2009-2015年德律科技营业收入及净利润(TWD mln)
2010-2015年德律科技营收构成(分产品)
2010-2014年德律科技营收构成(分区域)
2009-2015年德律科技毛利、同比增长及毛利率
2009-2015年德律科技研发支出、同比增长及其占营业收入比例
2009-2014年德律科技主要产能及产量
2009-2014年德律科技主要产品销量
德律科技主要产品型号及其适用领域
德律科技全球网点分布
2009-2015年由田新技营业收入及净利润
2010-2014年由田新技营收构成(分产品)
2010-2014年由田新技营收构成(分区域)
2009-2014年由田新技毛利、同比增长及毛利率
2009-2015年由田科技研发支出、同比增长及其占营业收入比例
2012-2014年由田新技主要产品产量及产值
2012-2014年由田新技主要产品销量
2009-2014年由田新技主要产品销售额
2013-2014年由田新技来自主要客户的销售额
由田新技光学检测设备主要产品及功能
PCB AVI主要性能指标
FPD AOI主要产品
Touch Panel AOI主要产品
其他AOI产品
由田新技短期发展计划
由田新技长期发展计划
美德客应用于SMT 的AOI
美德客应用于LED的AOI
2012-2014年赛凯推出的AOI新产品
赛凯主要2D AOI设备
赛凯主要3D AOI/SPI设备
赛凯主要AXI产品
赛凯全球公司及分销商分布
赛凯在中国的分销商
2009-2015年劲拓股份营业收入及同比增长
2011-2015年劲拓股份营收构成(分产品)
2011-2014年劲拓股份营收构成(分区域)
2011-2015年劲拓股份毛利率(分产品)
2009-2015年劲拓股份研发支出、同比增长及其占营业收入比例
2009-2015年劲拓股份AOI设备发展历程
2011-2018年劲拓股份AOI设备销量及单价
2009-2015年劲拓股份AOI设备营业收入及同比增长(RMB mln)
劲拓股份募投项目投产后新增焊接设备和AOI检测设备的数量
2014-2018年劲拓股份营业收入及净利润预测(RMB mln)
2010-2015年星河科技营业收入及净利润(RMB mln)
2010-2015年星河科技分产品营业收入(RMB mln)
2010-2015年星河科技分产品毛利率(%)
2010-2015年星河科技研发支出及其占营业收入比例
神州视觉主要AOI产品
神州视觉主要客户
矩子智能主要AOI产品
易科讯主要AOI产品
易科讯主要客户
振华兴科技主要AOI产品
振华兴新AOI产品
振华兴科技主要客户
振华兴科技销售网络
欧威科技主要AOI产品
欧威科技主要客户
明富自动化主要AOI产品
明富自动化主要客户
中导光电主要AOI产品
中导光电平板显示屏AOI主要客户
中导光电光伏电池AOI主要客户
IMPRESS Q系列AOI产品性能指标
IMPRESS Q+系列AOI产品性能指标
Classification of Optical Inspection Equipment
Composition of AOI System
Advantages of AOI Equipment
Related Technologies of AOI Equipment Industry
AOI Equipment Industry Chain
AOI Equipment Upstream Raw Materials Source Countries
AOI Application Industries and Test Items
SMT Process
AOI Equipment Application in SMT Production Line
AOI Application in Solar Cell Production Line
Policies on China AOI Industry, 2006-2015
Global AOI Market Size and YoY, 2013-2018E (USD bn)
Global AOI Market Size (by Applications), 2013-2018E
Major Global AOI Manufacturers and Their AOI Revenue
A Comparison of the Advantages and Disadvantages of Foreign and Chinese AOI Equipment Manufacturers
China’s AOI Market Size, 2014-2018E (RMB bn)
Major AOI Demanding Fields in China, 2015
Market Size of Major AOI Demanding Fields in China, 2014-2018E (RMB bn)
Market Share of Major AOI Manufacturers in China (RMB mln)
Major Chinese AOI Manufacturers and Their AOI Revenue
PCB Industry Chain
Application of AOI in PCB Industry
Global PCB Output Value and YoY, 2011-2018E (USD bn)
Global PCB Output Value by Market Segments, 2012-2018E
Global PCB Output Value Structure (by Region), 2010-2019E
Mainland China’s PCB Output Value and YoY, 2010-2019E
Global PCB Test Applied AOI Market Size and YoY, 2010-2018E (USD mln)
China’s PCB Test Applied AOI Market Size and YoY, 2013-2018E (RMB bn)
Application of AOI in TFT-LCD Production Line
Main Inspection Equipment of TFT-LCD Production Process
Global Large Size TFT-LCD Panel Shipments and YoY, 2010-2018E
Global Large Size TFT-LCD Panel Shipments by Applications, 2010-2015 (unit mln)
Capacity of 8Th Generation and Above TFT-LCD Panel in China at the End of 2015
Market Size and YoY of AOI Applied in FPD Test Worldwide, 2013-2018E (USD bn)
Market Size of AOI Applied in FPD Test in China, 2014-2018E (RMB mln)
Application of AOI in Wafer Manufacturing
Application of AOI in Wafer Probing
Application of AOI in IC Packaging
Application of AOI in IC Testing
Global Semiconductor Industry Sales and YoY, 2010-2017E (USD bn)
Global Semiconductor Industry Sales Structure (by Product), 2011-2017E
Global Semiconductor Industry Sales Structure (by Region), 2011-2017E
Revenue of Global Top 10 Semiconductor Suppliers, 2014-2015 (USD mln)
Global IC Industry Sales and YoY, 2011-2017E (USD bn)
China’s IC Industry Sales and YoY, 2010-2015 (RMB bn)
China’s IC Industry Sales as a Percentage of the World’s, 2007-2015
Global Semiconductor Equipment Sales (by Region), 2010-2016E (USD bn)
Global Semiconductor Process Control Equipment Market Size, 2012-2018E (USD bn)
Calculation Table of China’s Semiconductor Process Control Equipment Market Size, 2012-2018E
Calculation Table of China’s Semiconductor AOI Market Size, 2012-2018E
Orbotech’s Revenue and Net Income, 2009-2015 (USD mln)
Orbotech’s Revenue Breakdown (by Business), 2009-2015 (USD mln)
Orbotech’s Revenue Breakdown (by Region), 2003-2015 (USD mln)
Orbotech’s R&D Expenditure, YoY, and % of Total Revenue, 2009-2015
Orbotech’s Gross Profit, YoY, and Gross Margin, 2009-2015
Orbotech’s Main Products and Its Competitors (by Industry)
Installs of Orbotech’s Main Products, 2010-2014
New Technologies of Orbotech’s Core Markets
Orbotech’s AOIs Applied in PCB Test
Orbotech’s AOIs Applied in FPC Test
Orbotech’s Revenue from China, YoY, and % of Total Revenue, 2009-2014
Camtek’s Revenue and Net Income, 2009-2015 (USD mln)
Camtek’s Revenue Breakdown (by Business), 2009-2015
Camtek’s Revenue Breakdown (by Region), 2009-2014
Camtek’s Gross Profit, YoY, and Gross Margin, 2009-2015
Camtek’s R&D Expenditure, YoY, and % of Total Revenue, 2009-2015
Eagle Series AOI Products
Condor Series AOI Products
Gannet Series AOI Products
Falcon Series AOI Products
Phoenix Series AOI Products
Dragon Series AOI Products
Orion Series AOI Products
LAM Series AOI Products
Major Subsidiaries of Camtek
KLA-Tencor’s Revenue and Net Income, FY2011-FY2015 (USD mln)
KLA-Tencor’s Revenue Breakdown (by Business), 2013-2015
KLA-Tencor’s Revenue Breakdown (by Region), 2013-2015
KLA-Tencor’s R&D Expenditure and % of Total Revenue, FY2013-FY2015
Main Products of KLA-Tencor
Staff Structure of Omron
Omron’s Revenue and Net Income, FY2010-FY2016E (JPY bn)
Omron’s Revenue Breakdown (by Business), FY2010-FY2016E
Omron’s Revenue Breakdown (by Region), FY2010-FY2016E
Omron’s Gross Profit, YoY, and Gross Margin, FY2010-FY2016E (JPY bn)
Omron’s R&D Expenditure, YoY, and % of Total Revenue, FY2010-FY2016E (JPY bn)
OMRON Industrial Automation & Control’s Revenue and Operating Income, FY2012-FY2016E
OMRON Industrial Automation & Control’s Revenue Breakdown (by Region), FY2011-FY2016E
OMRON Industrial Automation & Control’s R&D Expenditure, YoY, and % of the Department’s Revenue, FY2011-FY2015
Main AOI Products of Omron
Omron’s Employees in China, 2012-2014
Omron’s Sales in Greater China Region, FY2010-FY2016E (JPY bn)
KohYoung Technology’s Business Growth Model
KohYoung Technology’s Revenue and YoY, 2009-2015
KohYoung Technology’s Main Products and Regional Sales, 2012-2015 (KRW mln)
KohYoung Technology’s Gross Profit, YoY, and Gross Margin, 2012-2015
KohYoung Technology’s R&D Expenditure and % of Total Revenue, 2012-2015
KohYoung Technology’s SMI Solutions
KohYoung Technology’s Semiconductor Solutions
Screen’s Revenue and YoY, FY2010-FY2016E (JPY bn)
Screen’s Revenue Breakdown (by Business Unit), FY2011-FY2016E
Screen’s Revenue Breakdown (by Region), FY2011-FY2016E
Revenue Structure of Screen Media And Precision Technology Company, FY2011-FY2016E
Screen’s R&D Expenditure, YoY, and % of Total Revenue, FY2010-FY2016E
Number of Patents Held by Screen, FY2011-FY2015
Screen’s Main AOI Equipment
Screen’s PCB Related Equipment Revenue and YoY, FY2010-FY2016E
HB Technology’s Revenue and YoY, 2009-2015 (KRW mln)
HB Technology’s Revenue Breakdown (by Product & Marketing Channel), 2010-2015 (KRW mln)
HB Technology’s Gross Profit, YoY, and Gross Margin, 2009-2015 (KRW mln)
HB Technology’s R&D Expenditure and % of Total Revenue, 2010-2015
HB Technology’s AOI Capacity, 2013-2015
Output and Average Selling Price of HB Technology’s AOI Products, 2010-2015
TRI’s Revenue and Net Income, 2009-2015 (TWD mln)
TRI’s Revenue Breakdown (by Product), 2010-2015
TRI’s Revenue Breakdown (by Region), 2010-2014
TRI’s Gross Profit, YoY, and Gross Margin, 2009-2015
TRI’s R&D Expenditure, YoY, and % of Total Revenue, 2009-2015
Capacity and Output of TRI’s Main Products, 2009-2014
Sales Volume of TRI’s Main Products, 2009-2014
TRI’s Main Product Models and Their Applications
Global Network Distribution of TRI
Utechzone’s Revenue and Net Income, 2009-2015
Utechzone’s Revenue Breakdown (by Product), 2010-2014
Utechzone’s Revenue Breakdown (by Region), 2010-2014
Utechzone’s Gross Profit, YoY, and Gross Margin, 2009-2014
Utechzone’s R&D Expenditure, YoY, and % of Total Revenue, 2009-2015
Output and Output Value of Utechzone’s Main Products, 2012-2014
Sales Volume of Utechzone’s Main Products, 2012-2014
Sales of Utechzone’s Main Products, 2009-2014
Utechzone’s Sales from Main Customers, 2013-2014
Main Products and Functions of Utechzone’s Optical Inspection Equipment
Main Performance Index of PCB AVI
Main Products of FPD AOI
Main Products of Touch Panel AOI
Other AOI Products
Short-term Development Plan of Utechzone
Long-term Development Plan of Utechzone
Mirtec’s AOIs Applied in SMT
Mirtec’s AOIs Applied in LED
SAKI’s Newly Launched Products, 2012-2014
SAKI’s Main 2D AOI Equipment
SAKI’s Main 3D AOI/SPI Equipment
SAKI’s Main AXI Products
Distribution of SAKI’s Companies and Distributors Worldwide
SAKI’s Distributors in China
JT Automation Equipment’s Revenue and YoY, 2009-2015
JT Automation Equipment’s Revenue Breakdown (by Product), 2011-2015
JT Automation Equipment’s Revenue Breakdown (by Region), 2011-2014
JT Automation Equipment’s Gross Margin (by Product), 2011-2015
JT Automation Equipment’s R&D Expenditure, YoY, and % of Total Revenue, 2009-2015
Development History of JT Automation Equipment’s AOI Equipment, 2009-2015
Sales Volume and Unit Price of JT Automation Equipment’s AOI Equipment, 2011-2018E
Revenue and YoY of JT Automation Equipment’s AOI Equipment, 2009-2015 (RMB mln)
Number of Welding Equipment and AOI Equipment Added upon Production of JT Automation Equipment’s Fund-raising Projects
JT Automation Equipment’s Revenue and Net Income, 2014-2018E (RMB mln)
Star River Comtes’ Revenue and Net Income, 2010-2015 (RMB mln)
Star River Comtes’ Revenue Breakdown by Product, 2010-2015 (RMB mln)
Star River Comtes’ Gross Margin by Product, 2010-2015 (%)
Star River Comtes’ R&D Expenditure and % of Total Revenue, 2010-2015
Main AOI Products of ALeader
Main Customers of ALeader
Main AOI Products of Jutze Intelligence
Main AOI Products of ekt-Tech
Main Customers of ekt-Tech
Main AOI Products of ZhenHuaXing Technology
New AOI Products of ZhenHuaXing Technology
Main Customers of ZhenHuaXing Technology
Sales Network of ZhenHuaXing Technology
Main AOI Products of Ovi Technology
Main Customers of Ovi Technology
Main AOI Products of Mingfu Automation
Main Customers of Mingfu Automation
Main AOI Products of 3i Systems
3i Systems Display Panel AOI Customers
3i Systems PV Cell AOI Customers
Performance Indicators of IMPRESS Q Series AOI Products
Performance Indicators of IMPRESS Q+ Series AOI Product
如果这份报告不能满足您的要求,我们还可以为您定制报告,请 留言说明您的详细需求。
|