|
|
|
报告导航:研究报告—
制造业—材料
|
|
2016-2020年全球及中国耐火材料行业研究报告 |
 |
字数:6.1万 |
页数:176 |
图表数:226 |
|
中文电子版:9000元 |
中文纸版:4500元 |
中文(电子+纸)版:9500元 |
|
英文电子版:2600美元 |
英文纸版:2800美元 |
英文(电子+纸)版:2900美元 |
|
编号:BXM088
|
发布日期:2016-02 |
附件:下载 |
 |
|
|
近年,由于全球经济低迷,中国经济放缓,耐火材料下游产业增长乏力,再加上原料价格上涨等因素影响,中国耐火材料产业竞争加剧,企业订单减少,销量下滑,有的甚至亏损。
2015年前三季度中国耐火材料产量为1808.25万吨,同比降低7.63%,估计全年产量在2600万吨左右。同期,中国耐火材料出口量129.97万吨,同比降低7.61%,全年在175.0万吨左右。
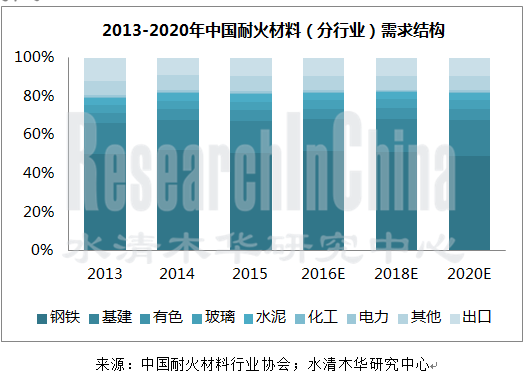
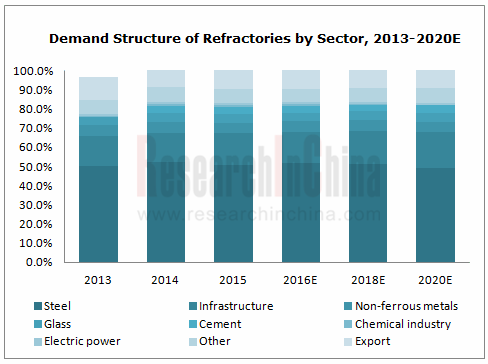
钢铁、水泥、玻璃、建材等是耐火材料主要下游产业。其中钢铁用耐材比重最大,全球占比在65%左右。2015年全球粗钢产量为16.228亿吨,同比下降2.8%,其中中国为8.038亿吨,同比下滑2.3%。
受钢铁等下游产能过剩、产业结构调整,以及吨钢耐材消耗量减少等因素影响,预计到2020年,中国耐火材料需求量将降至2140万吨左右(含出口),其中钢铁用耐材在1050万吨左右。
目前,全球耐火材料产业形成了多个大型企业集团,如维苏威、奥镁、摩根先进材料、巴西镁业、日本品川等,现均已布局中国。
中国耐火原料及制品生产商超过2000家,但市场竞争激烈,集中度偏低,前10家企业市场占有率在15%左右。近年来,中国耐材优势企业通过优势互补,跨区域联合重组等已取得了突破性发展,并形成了营口青花、北京利尔、鲁阳节能、濮耐股份、自立股份等一批龙头企业。
营口青花:中国最大的耐火材料生产企业,亚太最大的碱性耐火材料生产基地。公司以碱性耐火材料为主,年产能200万吨,2015年集团销售收入在30亿元左右。
北京利尔:中国大型钢铁用耐火材料整体承包商。近年不断延伸产业链,2013年收购辽宁金宏和辽宁中兴,组成东北镁质基地;2014年对辽宁镁质材料基地6家公司进行了内部整合;2015年拟以 3000 万元成立北京利尔电子商务有限公司,搭建耐材制品线上交易平台。
鲁阳节能:中国最大的陶瓷纤维生产商。2015年5月完成与Unifrax l LLC 签订战略的合作协议,即转让公司29%股权给对方,并获得奇耐苏州100%的股权,以及Luyang Unifrax 产品中国区的独家经销权。2015年9月公司从鲁阳股份更名为鲁阳节能。
水清木华研究中心《2016-2020年全球及中国耐火材料行业研究报告》主要分析了以下内容:
 全球耐火材料市场供需、主要国家发展现状等; 全球耐火材料市场供需、主要国家发展现状等;
中国耐火材料政策环境和产业环境等;
中国耐火材料市场供需、竞争格局等;
碱性耐火材料、不定型耐火材料、陶瓷纤维等细分耐火材料发展现状及主要企业;
耐火材料上下游市场分析;
全球13家、中国19家重点耐火材料企业经营情况及耐火材料业务分析。
Impacted by factors such as global economic downturn, China’s economic slowdown, weak growth in downstream sectors of refractories industry, as well as the rising prices of raw materials in recent years, the refractories industry of China has seen fiercer competition, which has resulted in a fall in companies’ orders and sales volume. Even worse, some have made losses.
In the first three quarters of 2015, the refractory output in China was 18.0825 million tons, down 7.63% from the same period of last year, with an estimated full-year output of roughly 26 million tons. Over the same period, China’s refractory exports totaled 1.2997 million tons, down 7.61% year-on-year, as opposed to some 1.75 million tons for the full year.
Among key downstream sectors of refractories industry including steel, cement, glass, and building materials, steel represented the largest portion, at around 65% of the global total. In 2015, the crude steel output worldwide amounted to 1.6228 billion tons, a year-on-year fall of 2.8%, of which 803.8 million tons came from China, down 2.3% from the previous year.
Affected by overcapacity in downstream sectors like steel, industrial restructuring and the decreased consumption of refractories for per ton of steel, the demand for refractories in China is anticipated to drop to 21.4 million tons (including export) by 2020, of which refractory for steel will hit about 10.5 million tons.
Source: the Association of China Refractories Industry; ResearchInChina
Presently, there have been several large corporate groups such as Vesuvius, RHI, Morgan Advanced Materials, Magnesita Refratários, and Shinagawa Refractories in the global refractories industry, and all of them have business layout in China.
So far in China, there have been over 2,000 manufacturers of refractory raw materials and products, with the market featuring fierce competition and low concentration, and the combined market share of the top 10 companies reaching about 15%. Through complementing each other and trans-regional allied reorganization of preponderant enterprises over recent years, a number of leading players consisting of Yingkou Qinghua Group, Beijing Lier High-temperature Materials, Luyang Energy-saving Materials, Puyang Refractories Group, and Zhejiang Zili Corporation Limited have sprung up.
Yingkou Qinghua Group:As the largest producer of refractories in China and the place where the Asia’s largest basic refractory production base is located, Yingkou Qinghua Group is primarily focused on basic refractories with annual capacity of 2 million tons. Its revenue reported RMB3 billion or so in 2015.
Beijing Lier High-temperature Materials:As a large general contractor of steel-used refractories in China, Beijing Lier High-temperature Materials have extended its industrial chain aggressively over the recent years. It acquired Liaoning Jinhong Mining Co., Ltd and Liaoning Haicheng Zhongxing Mining Group and organized them into a magnesite base in 2013, and carried internal integration of six companies in Liaoning-based Magnesite Material Base in 2014, and then planned an investment of RMB30 million to set up Beijing Lier E-commerce Co., Ltd in 2015 in a bid to erect an online transaction platform for refractory products.
Luyang Energy-saving Materials:As the largest producer of ceramic fiber in China, Luyang Energy-saving Materials completed the strategic cooperation agreement with Unifrax l LLC and transferred 29% equities to the latter, and obtained 100% equities of Unifrax (Suzhou) as well as the exclusive distributorship of Luyang Unifrax’s products in China in May 2015. Later in September 2015, LuYang Co., Ltd was renamed Luyang Energy-saving Materials Co., Ltd
Global and China Refractories Industry Report, 2016-2020 released by ResearchInChina mainly analyzes the following:
 Supply and demand of refractory materials worldwide, status quo of development in major countries, etc.; Supply and demand of refractory materials worldwide, status quo of development in major countries, etc.;
Policies, industrial environment, etc for refractory materials in China;
Supply and demand of refractory materials, competition pattern, etc in China;
Development status and major companies of basic refractory material, unshaped refractory material, ceramic fiber, etc.;
Upstream and downstream markets of refractory materials;
Operation, refractory material business analysis, etc of 13 global and 19 Chinese refractory material companies
第一章 耐火材料简介
1.1 定义及分类
1.1.1 定义
1.1.2 分类
1.2产业链
第二章 全球耐火材料发展现状
2.1 市场供需
2.1.1 生产情况
2.1.2 需求情况
2.2 主要国家/地区
2.2.1 欧洲
2.2.2 美国
2.2.3 日本
2.3.4 印度
2.3.5 澳大利亚
2.3.6 巴西
2.3 重点企业
第三章 中国耐火材料行业现状
3.1 主要政策
3.1.1 国内政策
3.1.2 出口环境
3.2 行业现状
3.2.1 行业运行情况
3.2.2 行业特点
3.3 存在的问题
第四章 中国耐火材料市场现状
4.1市场供需
4.1.1 生产情况
4.1.2 需求情况
4.2 进出口情况
4.2.1 出口
4.2.2 进口
4.3 竞争情况
4.3.1 区域格局
4.3.2 企业格局
第五章 耐火材料细分产品市场分析
5.1 碱性耐火材料
5.1.1 发展现状
5.1.2 无铬碱性耐火材料
5.1.3 竞争格局
5.2 不定形耐火材料
5.2.1 发展现状
5.2.2 企业竞争情况
5.3 陶瓷纤维
5.3.1发展现状
5.3.2 重点企业
5.3.3 发展前景
第六章 中国耐火材料上下游分析
6.1 耐火原料市场
6.1.1 菱镁矿
6.1.2 铝土矿
6.1.3 石墨
6.2 耐材下游市场
6.2.1 概述
6.2.2钢铁用耐材
6.2.3 玻璃用耐材
6.2.4 水泥用耐材
第七章 国际耐火材料重点企业研究
7.1维苏威(VESUVIUS)
7.1.1 企业简介
7.1.2 经营情况
7.1.3 耐火材料业务
7.1.4 在华发展
7.2奥镁(RHI)
7.2.1 企业简介
7.2.2 经营情况
7.2.3 发展战略
7.2.4 在华发展
7.3 巴西镁业耐火材料(MAGNESITA REFRATÁRIOS)
7.3.1 企业简介
7.3.2 经营情况
7.3.3 耐材业务
7.3.4 在华发展
7.4益瑞石(IMERYS)
7.4.1 企业简介
7.4.2 经营情况
7.4.3 耐火材料业务
7.5 黑崎播磨公司(KROSAKI HARIMA)
7.5.1 企业简介
7.5.2 经营情况
7.5.3 在华发展
7.6品川白炼瓦株式会社(SHINAGAWA REFRACTORIES)
7.6.1 企业简介
7.6.2 经营情况
7.6.3 在华发展
7.7 MAGNEZIT
7.7.1 企业简介
7.7.2 经营情况
7.7.3 在华发展
7.8 HARBISON WALKER INTERNATIONAL (原ANH REFRACTORIES)
7.8.1 企业简介
7.8.2 经营情况
7.8.3 在华发展
7.9 MORGAN ADVANCED MATERIALS(原MORGAN CRUCIBLE)
7.9.1 企业简介
7.9.2 经营情况
7.9.3 在华发展
7.10 REFRATECHNIK
7.10.1 企业简介
7.10.2 经营情况
7.10.3 在华发展
7.11 朝鲜耐火(CHOSUN REFRACTORIES)
7.11.1 企业简介
7.11.2 经营情况
7.11.3 在华发展
7.12珉泰克(MINTEQ)
7.12.1 企业简介
7.12.2 经营情况
7.12.3 在华发展
7.13 圣戈班集团(SAINT-GOBAIN)
7.13.1 企业简介
7.13.2 经营情况
7.13.3 在华发展
第八章 中国耐火材料重点企业研究
8.1 濮阳濮耐高温材料(集团)股份有限公司(PUYANG REFRACTORIES GROUP CO., LTD)
8.1.1 企业简介
8.1.2 经营情况
8.1.3 营收构成
8.1.4 毛利率
8.1.5 发展战略
8.2山东鲁阳节能材料股份有限公司(LUYANG ENERGY-SAVING MATERIALS CO.,LTD.)
8.2.1 企业简介
8.2.2 经营情况
8.2.3 营收构成
8.2.4 毛利率
8.2.5 发展战略
8.3瑞泰科技股份有限公司(RUITAI MATERIALS TECHNOLOGY CO.,LTD.)
8.3.1 企业简介
8.3.2 经营情况
8.3.3 营收构成
8.3.4 毛利率
8.3.5 子公司经营情况
8.3.6 发展战略
8.4北京利尔高温材料股份有限公司(BEIJING LIER HIGH-TEMPERATURE MATERIALS CO.,LTD.)
8.4.1 企业简介
8.4.2 经营情况
8.4.3 营收构成
8.4.4 毛利率
8.4.5 发展战略
8.5 河南熔金高温材料股份有限公司
8.5.1 企业简介
8.5.2 经营情况
8.5.3 营收构成
8.5.4 主要客户
8.6 浙江自立股份有限公司(ZHEJIANG ZILI CORPORATION LIMITED)
8.6.1 企业简介
8.6.2 经营情况
8.6.3 营收构成
8.6.4 主要客户
8.6.5 发展战略
8.7营口青花集团有限公司(YINGKOU QINGHUA GROUP CO., LTD.)
8.7.1 企业简介
8.7.2 经营情况
8.7.3 重点项目
8.8武汉钢铁集团耐火材料有限责任公司(WUGANG REFRACTORY CO.,LTD.)
8.8.1 企业简介
8.8.2 经营情况
8.8.3 发展战略
8.9营口金龙集团耐火材料有限公司(YINGKOU JINLONG REFRACTORIES GROUP CO.,LTD)
8.9.1 企业简介
8.9.2 经营情况
8.10山东耐火材料集团有限公司(SHANDONG REFRACTORIES GROUP CO., LTD.)
8.10.1 企业简介
8.10.2 经营情况
8.10.3 主要子公司
8.11 通达耐火技术股份有限公司(TONGDA REFRACTORY TECHNOLOGIES, CO. LTD.)
8.11.1 企业简介
8.11.2 经营情况
8.11.3 重点项目
8.12中钢集团耐火材料有限公司(SINOSTEEL REFRACTORY CO.,LTD.)
8.12.1 企业简介
8.12.2 经营情况
8.13江苏苏嘉集团有限公司(JIANGSU SUJIA GROUP CO., LTD.)
8.13.1 企业简介
8.13.2 经营情况
8.14海城市后英经贸集团有限公司(HAICHENG HOUYING TADE GROUP CO.,LTD)
8.14.1 企业简介
8.14.2 经营情况
8.14.3 重点项目
8.15山西盂县西小坪耐火材料有限公司(SHANXI XIXIAOPING REFRACTORIES CO.,LTD.)
8.15.1 企业简介
8.15.2 经营情况
8.16 其他
8.16.1 郑州振东科技有限公司(Zhengzhou Zhengdong Technology Co.,Ltd.)
8.16.2 山东鲁桥新材料股份有限公司(Shandong Luqiao New Materials Co.,Ltd.)
8.16.3 中钢集团洛阳耐火材料研究院有限公司(Sinosteel Luoyang Institute of Refractories Research Co.,Ltd.)
8.16.4 海城镁矿耐火材料总厂(Haicheng Magnesite Refractory General Factory)
第九章 总结与预测
9.1 市场
9.2 企业
1. Overview of Refractories
1.1 Definition & Classification
1.1.1 Definition
1.1.2 Classification
1.2 Industry Chain
2. Development of Refractories Worldwide
2.1Market Supply and Demand
2.1.1 Production
2.1.2 Demand
2.2 Major Countries/Regions
2.2.1 Europe
2.2.2 United States
2.2.3 Japan
2.3.4 India
2.3.5 Australia
2.3.6 Brazil
2.3 Key Companies
3. Status Quo of China Refractories Industry
3.1 Major Policies
3.1.1 Domestic Policies
3.1.2 Export Environment
3.2 Status Quo of the Industry
3.2.1 Operation
3.2.2 Characteristics
3.3 Existing Problems
4. Status Quo of Chinese Refractories Market
4.1Market Supply and Demand
4.1.1 Production
4.1.2 Demand
4.2 Import & Export
4.2.1 Export
4.2.2 Import
4.3 Competition
4.3.1 Regional Pattern
4.3.2 Company Pattern
5. Refractory Product Segments
5.1 Basic Refractory
5.1.1 Development
5.1.2 Chrome-free Basic Refractory
5.1.3 Competitive Landscape
5.2 Unshaped Refractory
5.2.1 Development
5.2.2 Company Competition
5.3 Ceramic Fiber
5.3.1 Development
5.3.2 Key Companies
5.3.3 Development Prospects
6. Upstream/Downstream Refractories in China
6.1 Refractory Raw Material Market
6.1.1 Magnesite
6.1.2 Bauxite
6.1.3 Graphite
6.2 Downstream Refractory Market
6.2.1 Overview
6.2.2 Refractory for Steel Industry
6.2.3 Refractory for Glass Industry
6.2.4 Refractory for Cement Industry
7. Key Companies Worldwide
7.1 Vesuvius
7.1.1 Profile
7.1.2 Operation
7.1.3 Refractory Business
7.1.4 Development in China
7.2 RHI
7.2.1 Profile
7.2.2 Operation
7.2.3 Development Strategy
7.2.4 Development in China
7.3 Magnesita Refratários
7.3.1 Profile
7.3.2 Operation
7.3.3 Refractory Business
7.3.4 Development in China
7.4 Imerys
7.4.1 Profile
7.4.2 Operation
7.4.3 Refractory Business
7.5 Krosaki Harima
7.5.1 Profile
7.5.2 Operation
7.5.3 Development in China
7.6 Shinagawa Refractories
7.6.1 Profile
7.6.2 Operation
7.6.3 Development in China
7.7 Magnezit
7.7.1 Profile
7.7.2 Operation
7.7.3 Development in China
7.8 Harbison Walker International (former ANH Refractories)
7.8.1 Profile
7.8.2 Operation
7.8.3 Development in China
7.9 Morgan Advanced Materials (former Morgan Crucible)
7.9.1 Profile
7.9.2 Operation
7.9.3 Development in China
7.10 Refratechnik
7.10.1 Profile
7.10.2 Operation
7.10.3 Development in China
7.11 Chosun Refractories
7.11.1 Profile
7.11.2 Operation
7.11.3 Development in China
7.12 Minteq
7.12.1 Profile
7.12.2 Operation
7.12.3 Development in China
7.13 Saint-Gobain
7.13.1 Profile
7.13.2 Operation
7.13.3 Development in China
8. Key Enterprises in China
8.1 Puyang Refractories Group Co.,Ltd
8.1.1 Profile
8.1.2 Operation
8.1.3 Revenue Structure
8.1.4 Gross Margin
8.1.5 Development Strategy
8.2 Luyang Energy-saving Materials Co.,Ltd.
8.2.1 Profile
8.2.2 Operation
8.2.3 Revenue Structure
8.2.4 Gross Margin
8.2.5 Development Strategy
8.3 Ruitai Materials Technology Co., Ltd.
8.3.1 Profile
8.3.2 Operation
8.3.3 Revenue Structure
8.3.4 Gross Margin
8.3.5 Operation of Subsidiaries
8.3.6 Development Strategy
8.4 Beijing Lier High-temperature Materials Co., Ltd
8.4.1 Profile
8.4.2 Operation
8.4.3 Revenue Structure
8.4.4 Gross Margin
8.4.5 Development Strategy
8.5 Henan Rongjin High Temperature Materials Co., Ltd.
8.5.1 Profile
8.5.2 Operation
8.5.3 Revenue Structure
8.5.4 Major Customers
8.6 Zhejiang Zili Corporation Limited
8.6.1 Profile
8.6.2 Operation
8.6.3 Revenue Structure
8.6.4 Major Customers
8.6.5 Development Strategy
8.7 Yingkou Qinghua Group Co., Ltd.
8.7.1 Profile
8.7.2 Operation
8.7.3 Key Projects
8.8 Wugang Refractory Co., Ltd
8.8.1 Profile
8.8.2 Operation
8.8.3 Development Strategy
8.9 Yingkou Jinlong Refractories Group Co., Ltd
8.9.1 Profile
8.9.2 Operation
8.10 Shandong Refractories Group Co.,Ltd
8.10.1 Profile
8.10.2 Operation
8.10.3 Main Subsidiaries
8.11 Tongda Refractory Technologies Co., Ltd
8.11.1 Profile
8.11.2 Operation
8.11.3 Key Projects
8.12 Sinosteel Refractory Co., Ltd
8.12.1 Profile
8.12.2 Operation
8.13 Jiangsu Sujia Group Co., Ltd.
8.13.1 Profile
8.13.2 Operation
8.14 Haicheng Houying Trade Group Co., Ltd.
8.14.1 Profile
8.14.2 Operation
8.14.3 Key Projects
8.15 Shanxi Xixiaoping Refractories Co., Ltd.
8.15.1 Profile
8.15.2 Operation
8.16 Others
8.16.1 Zhengzhou Zhengdong Technology Co., Ltd.
8.16.2 Shandong Luqiao New Materials Co., Ltd.
8.16.3 Sinosteel Luoyang Institute of Refractories Research Co., Ltd.
8.16.4 Haicheng Magnesite Refractory General Factory
9. Conclusion & Prediction
9.1 Market
9.2 Enterprises
表:耐火材料的分类
图:耐火材料产业链
图:耐火材料(分行业)消费结构
图:2011-2020年世界耐火材料产量
图:2014年全球耐火材料(分国家/地区)产量构成
图:2014-2016年世界耐火材料产业发展驱动因素
图:2009-2020年全球耐材需求量
图:2014年欧洲耐火材料(分产品)生产结构
表:2009-2013年PRE 会员单位耐材产量及销售额
表:2010-2014财年日本耐火材料产量
表:2011-2014财年日本钢铁用耐材消耗量
表:2012-2014财年印度耐火材料产量及销售额
图:巴西耐火材料应用领域及占比
图:2014年世界主要耐火材料企业
表:2009-2015年中国耐火材料政策
表:2012-2016年中国主要耐火原料出口配额总量
表:2011-2015年中国耐材行业主要经济指标
表:2014-2015年中国耐材行业重点企业主要经济指标
表:2001-2020年中国耐火原料及制品产量及增速
表:2014-2015年中国主要耐材原料及制品出口量及金额
表:2014-2015年中国主要耐材原料及制品进口量及金额
图:2013年中国前15家耐材企业(按销售收入)
图:2005-2020年中国耐火材料产量及同比增长
表:2010-2020年中国耐材材料(分产品)产量
图:2012-2015年中国主要省市耐材产量
图:2013-2020年中国耐火材料需求量
表:2013-2020年中国耐火材料(分行业)需求量
表:2011-2015年中国耐火材料出口量及金额
图:2009-2015年中国耐火材料(分产品)出口量
图:2014年中国碱性耐火材料(分国家)出口量构成
图:2014年中国铝硅质耐火材料(分国家)出口量构成
图:2014年中国其他耐火材料(分国家)出口量构成
表:2011-2015年中国耐火材料进口量及金额
图:2011-2015年中国耐火材料(分产品)进口量
图:2014-2015年中国耐火材料(分省市)产量构成
表:河南省主要耐火材料企业
表:辽宁主要耐火材料企业
表:2013-2015年中国主要耐火材料企业销售收入
表:截至2015年底世界主要耐材企业在华布局
表:主要碱性耐火原料及耐火制品
表:碱性耐火材料的典型应用
表:不含铬碱性耐火砖在发达国家的应用
表:不含铬碱性耐火砖替代产品技术路径及代表厂商
表:近年中国主要企业无铬碱性耐火材料项目
表:不定形和定形耐火材料比较
图:2014年主要国家/地区不定型耐火材料占比
图:2010-2020年中国不定型耐火材料产量及占比
表:2015年中国主要不定形耐火材料生产商及产能
图:中国陶瓷纤维应用领域及占比
图:2007-2020年中国陶瓷纤维产量
表:世界陶瓷纤维龙头在华子公司
表:2015年中国陶瓷纤维重点企业及产能
表:陶瓷纤维替的替代优势
表:2014年全球菱镁矿储量分布
图:中国菱镁矿资源分布图
表:2013-2014年全球主要国家菱镁矿产量
图:2002-2014年世界菱镁矿价格走势
表:2007-2015年中国镁砂(分产品)产量
图:2007-2015年中国镁砂(分产品)出口量
表:2014年全球铝土矿储量分布
表:2013-2014年全球主要国家铝土矿产量
图:中国铝土矿的分布
图:2009-2015年中国耐火铝粘土出口量
图:2008-2015年中国高铝矾土熟料和铝土矿消耗量
表:2014年全球天然石墨储量分布
图:2014年中国石墨(晶质)分布
图:2009-2015年中国天然鳞片石墨出口量
图:耐火材料主要消费领域及单位消费量
表:2014-2015年中国耐火材料主要下游行业产量
表:钢铁用耐火材料
图:2008-2015年世界粗钢产量
图:2015年世界前十大粗钢生产国
图:世界主要国家粗钢消费对比
图:2006-2020年中国粗钢产量及同比增长
表:2013-2020年中国每吨钢材耐材消耗量
表:2014年中国钢铁产量TOP10企业
表:中国钢铁用耐材主要企业及客户
图:2012-2020年中国平板玻璃产量
图:玻璃熔窑耐材分布图
图:不同耐火材料在玻璃窑中的使用比重
表:不同档次玻璃熔窑熔铸氧化铝用量
表:中国熔铸耐火材料企业及主导产品
表:水泥窑各部位用耐火材料一览表
图:2008-2020年中国水泥产量
表:2010-2015年维苏威营业收入及利润
表:2010-2015年维苏威(分业务)营业收入及利润
图:2014年底维苏威全球业务分布
表:2013-2014年维苏威(分地区)营业收入
图:维苏威耐火材料产品
图:2011-2015年维苏威耐火材料营业收入
表:2013-2015年维苏威耐火材料(分地区)营业收入及同比增长
表:维苏威在华耐材公司
图:2015年RHI 全球主要基地及主要客户
表:2013-2015年奥镁集团销量
图:2009-2015年奥镁集团营业收入及利润
图:2011-2015年奥镁集团(分业务)营业收入
图:2013-2014年奥镁集团(分地区)主营业务收入
图:RHI 2020战略
表:2015年底奥镁在华耐材公司
图:2010-2015年奥镁在华销售额
图:巴西镁业全球布局
图:Magnesita竞争优势及市场份额
表:2010-2015年Magnesita收入及净利润
图:2013-2015年巴西镁业(分业务)营业收入构成
表:2013-2015年巴西镁业耐材销量及营业收入
表:2013-2015年巴西镁业耐火材料(分应用领域)营业收入
图:2013-2015年巴西镁业耐火材料(分地区)营业收入
表:巴西镁业在华耐材公司
图:Imerys 全球业务布局
表:2011-2015年Imerys 营业收入及净利润
表:2012-2015年Imerys (分地区)营业收入
表:2012-2015年Imerys (分业务)营业收入
表:2014年Imerys 公司四大业务(分产品)营业收入
图:Imerys公司 Monolithic Refractories(Calderys)产品及应用
图:Imerys公司 Refractory Minerals产品及应用
图:Imerys Refractory Minerals 生产基地分布
图:Calderys 公司生产基地分布
表:2005-2015年Calderys发展里程碑
表:Krosaki 发展历程
图:2009-2015财年 Krosaki净销售额及净利润
图:2012-2015财年 Krosaki(分业务)净销售额
图:2014财年Krosaki公司耐材应用领域及占比
表:2012-2014财年 Krosaki(分地区)净销售额
图:Shinagawa 发展历史
图:Shinagawa 主要产品
表:2012-2015财年 Shinagawa 主要经济指标
图:2012-2015财年Shinagawa(分业务)销售额
图:Shinagawa 全球业务布局
图:2009-2014财年Shinagawa海外销售额
图:Shinagawa在华企业分布
图:Magnezit主要产品及服务
表:Magnezit 全球业务布局
表:Magnezit 主要客户
图:HWI主要产品
图:HWI主要工厂及产品
图:Morgan Advanced Materials主导产品
图:2009-2015年Morgan Advanced Materials收入及利润
表:2012-2015年Morgan Advanced Materials(分地区/国家)收入
表:2013-2015财年Morgan Advanced Materials(分业务)收入及利润率
图:2014财年Morgan Advanced Materials(分应用行业)营业收入
表:Morgan Advanced Materials在华重点公司
图:Refratechnik 全球工厂分布
图:Refratechnik 在华工厂
图:Chosun 主要产品
表:Chosun 全球主要基地分布
表:2010-2013年Chosun 主要经济指标
图:Chosun 在华生产基地
图:Minteq 主要耐材产品
图:2014年Minerals Technologies Inc(分业务)销售额
表:Minteq 主要子公司
表:2012-2015年Minteq 耐材业务销售额
表:2013-2015年Saint-Gobain销售额及营业利润
图:Saint-Gobain 主要业务
表:Saint-Gobain 耐火材料主要应用领域及竞争对手
表:2013-2015年Saint-Gobain(分业务)销售额
图:2013-2015年Saint-Gobain(分地区)销售额
图:2008-2015年圣戈班在华营业额
表:圣戈班在华耐火材料公司
图:2009-2015年濮耐股份营业收入和净利润
表:2011-2015年濮耐股份产销量
表:2012-2015年濮耐股份(分产品)主营业务收入及同比增长
图:2009-2015年濮耐股份(分地区)主营业务收入
表:2011-2014濮耐股份(分销售对象)主营业务收入及占比
表:2012-2014濮耐股份(分销售模式)主营业务收入及占比
图:2009-2015濮耐股份耐火材料毛利率
图:2012-2015年濮耐股份主要产品毛利率
表:2009-2015年濮耐股份兼并重组事件
图:2009-2015年鲁阳节能营业收入和净利润
表:2010-2015年鲁阳股份(分产品)主营业务收入
表:2010-2015年鲁阳节能(分地区)主营业务收入
图:2009-2015年鲁阳节能综合毛利率
表:2009-2015年鲁阳节能(分产品)毛利率
表:2015年底鲁阳节能股权结构
表:2008-2015年瑞泰科技业务拓展情况
图:2009-2015年瑞泰科技营业收入及净利润
表:2011-2015年瑞泰科技产销量
表:2011-2015年瑞泰科技(分产品)主营业务收入
图:2009-2015年瑞泰科技(分地区)主营业务收入
图:2008-2015年瑞泰科技耐材毛利率
表:2011-2015年瑞泰科技(分产品)毛利率
表:2014泰科技主要子公司营业收入和净利润
表:2011-2015年北京利尔业务拓展情况
图:2009-2015年北京利尔营业收入和净利润
表:2015年北京利尔主要生产线及产能
表:2012-2014年北京利尔耐火材料(分产品)产销量
表:2012-2015年北京利尔(分产品)主营业务收入
图:2010-2015年北京利尔(分地区)主营业务收入
图:2009-2015年北京利尔耐火材料毛利率
表:2012-2015年北京利尔(分产品)毛利率
图:北京利尔辽宁镁质材料基地整合图
图:熔金股份主要产品
图:2012-2015年熔金股份营业收入、净利润及毛利率
表:2013-2015年熔金股份(分产品)主营业务收入
表:2013-2015年熔金股份前5大客户
表:2011-2015年自立股份主要经济指标
表:2011-2015年自立股份主要产品产、销量
表:2011-2015年自立股份(分产品)主营业务收入
图:2011-2015年自立股份(分销售模式)主营业务收入构成
表:2011-2013年自立股份TOP5客户营业收入及占比
表:2015年自立股份募投项目建设方案
表:营口青花集团主要产品及应用
表:2012-2015年青花耐火股份公司耐火材料产量
表:2012-2015年武钢耐火公司耐火材料产量
表:2015年营口金龙集团(分产品)产能
表:2015年金龙集团耐火材料子公司及主要产品产能
表:2013-2015年金龙集团耐材产量
表:山东耐材发展史
表:2012-2015年山东耐材公司耐材产量
表:山东耐火材料公司主要子/分公司产能
表:2012-2015年通达耐火耐材产量
图:2011-2015年通达耐火营业收入及净利润
表:2012-2015年中钢耐火公司耐材产量
表:2012-2015年苏嘉集团耐火材料产量
表:后英集团主要耐火材料产品
图:2009-2015年后英集团销售收入及税金
表:2012-2015年后英集团耐火材料产量
表:2012-2015年西小坪耐材公司主要经济指标
表:2012-2015年振东科技耐材产量
表:2012-2015年鲁桥耐火公司耐材产量
表:2012-2015年中钢洛耐耐材产量
表:海城镁矿公司(分产品)产能
图:2007-2015年海城镁矿营业收入及同比增长
图:2014-2020年中国耐材产量及需求量
表:2014-2015年世界主要耐材企业销售额
表:2014-2015年中国主要企业耐材产量
表:2013-2015年中国耐材行业主要重组整合事件
Classification of Refractories
Refractory Industry Chain
Refractory Consumption Structure (by Sector)
Global Output of Refractories, 2011-2020
Output Structure of Refractories Worldwide by Country/Region, 2014
Driving Forces for the Development of Global Refractories Industry, 2014-2016
Global Demand for Refractories, 2009-2020
Production Structure of Refractories in Europe by Product, 2014
Refractory Output and Sales Value of PRE’s Member Units, 2009-2013
Output of Refractories in Japan, FY2010-FY2014
Consumption of Refractories for Iron & Steel in Japan, FY2011-FY2014
Output and Sales Value of Refractories in India, FY2012-FY2014
Application Fields and % of Refractories in Brazil
Leading Refractory Companies in the World, 2014
Policies on Refractories in China, 2009-2015
Total Export Quotas of Main Refractory Raw Materials in China, 2012-2016
Main Economic Indicators of Chinese Refractories Industry, 2011-2015
Main Economic Indicators of Key Chinese Refractory Companies, 2014-2015
Output and Growth Rate of Refractory Raw Materials in China, 2001-2020E
Export Volume and Value of Main Refractory Raw Materials and Products in China, 2014-2015
Import Volume and Value of Main Refractory Raw Materials and Products in China, 2014-2015
Top 15 Refractory Enterprises in China (by Revenue), 2013
Output and YoY Growth of Refractories in China, 2005-2020
Output of Refractories (by Product) in China, 2010-2020E
Output of Refractories in Key Provinces and Municipalities of China, 2012-2015
Demand for Refractories in China, 2013-2020E
Demand for Refractories (by Sector) in China, 2013-2020E
Export Volume and Value of Refractories in China, 2011-2015
Export Volume of Refractories (by Product) in China, 2009-2015
Volume Structure of Exported Basic Refractories (by Country) from China, 2014
Volume Structure of Exported Alumina-Silica Refractories (by Country) from China, 2014
Volume Structure of Exported Other Refractories (by Country) from China, 2014
Import Volume and Value of Refractories in China, 2011-2015
Import Volume of Refractories (by Product) in China, 2011-2015
Output Structure of Refractories (by Province/Municipality) in China, 2014-2015
Major Refractory Companies in Henan Province
Major Refractory Companies in Liaoning Province
Revenue of Major Refractory Companies in China, 2013-2015
Layout of World’s Major Refractory Companies in China as of end-2015
Main Basic Refractory Raw Materials and Refractory Products
Typical Applications of Basic Refractories
Application of Chromium-free Basic Firebrick in Developed Countries
Technology Roadmaps and Key Manufacturers of Chromium-free Basic Firebrick Substitutes
Key Chromium-free Basic Refractory Projects of Leading Company in China over Recent Years
Comparison between Shaped Refractory and Unshaped Refractory
Proportion of Unshaped Refractory in Major Countries/Regions, 2014
Output and % of Unshaped Refractory in China, 2010-2020
Key Manufacturers of Unshaped Refractory and Capacities in China, 2015
Applications and % of Ceramic Fiber in China
Output of Ceramic Fiber in China, 2007-2020E
Subsidiaries of World’s Leading Ceramic Fiber Manufacturers in China
Leading Ceramic Fiber Enterprises and Their Capacity in China, 2015
Substitution Advantages of Ceramic Fiber
Distribution of Magnesite Reserves Worldwide, 2014
Distribution of Magnesite Resources in China
Output of Magnesite in Major Countries, 2013-2014
Price Trend of Magnesite in the World, 2002-2014
Output of Magnesia (by Product) in China, 2007-2015E
Export Volume of Magnesia (by Product) in China, 2007-2015
Distribution of Bauxite Reserves Worldwide, 2014
Output of Bauxite in Major Countries, 2013-2014
Distribution of Bauxite Resources in China
Export Volume of Refractory Aluminum Clay in China, 2009-2015
Consumption of Bauxite Chamotte and Bauxite in China, 2008-2015
Distribution of Natural Graphite Reserves Worldwide, 2014
Distribution of Graphite (Crystalloid) in China, 2014
Export Volume of Natural Flake Graphite in China, 2009-2015
Main Consumption Fields and Unit Consumption of Refractories
Output of Main Downstream Refractory Industries, 2014-2015
Refractories for Iron and Steel Industry
Output of Crude Steel Worldwide, 2008-2015
Top 10 Producers (Countries) of Crude Steel in the World, 2015
Consumption of Crude Steel in Major Countries
Output and YoY Growth of Crude Steel in China, 2006-2020E
Consumption of Refractories for Per Ton of Steel in China, 2013-2020E
Top 10 Companies by Iron & Steel Output in China, 2014
Key Enterprises of Refractories for Iron & Steel and Major Customers in China
Output of Sheet Glass in China, 2012-2020E
Distribution Chart of Refractories for Glass Melting Furnace
Use (%) of Various Refractories in Glass Furnace
Consumption of Fused Cast Aluminum Oxide for Various Glass Furnaces
Key Companies of Fused Cast Refractory in China and Their Leading Products
Application of Refractories in Cement Kiln
Cement Output in China, 2008-2020E
Revenue and Profits of Vesuvius, 2010-2015
Revenue and Profits of Vesuvius (by Business), 2010-2015
Global Operations of Vesuvius at the end of 2014
Revenue of Vesuvius (by Region), 2013-2014
Refractory Products of Vesuvius
Vesuvius’ Revenue from Refractories, 2011-2015
Vesuvius’ Revenue from Refractories and YoY Growth (by Region), 2013-2015
Refractory Companies of Vesuvius in China
Major Bases and Clients Worldwide of RHI, 2015
Sales Volume of RHI, 2013-2015
Revenue and Profits of RHI, 2009-2015
Revenue of RHI (by Business), 2011-2015
Operating Revenue of RHI (by Region), 2013-2014
RHI’s Strategy for 2020
Refractory Companies of RHI at the end of 2015
RHI’s Sales in China, 2010-2015
Global Layout of Magnesita Refratários
Competitive Edges and Market Share of Magnesita Refratários
Revenue and Net Income of Magnesita Refratários, 2010-2015
Revenue Structure (by Business) of Magnesita Refratários, 2013-2015
Refractory Sales Volume and Revenue of Magnesita Refratários, 2013-2015
Revenue from Refractories (by Application) of Magnesita Refratários, 2013-2015
Revenue from Refractories (by Region) of Magnesita Refratários, 2013-2015
Refractory Companies of Magnesita Refratários in China
Global Operations of Imerys
Revenue and Net Income of Imerys, 2011-2015
Revenue of Imerys (by Region), 2012-2015
Revenue of Imerys (by Business), 2012-2015
Imerys’ Revenue from Four Major Businesses (by Product), 2014
Imerys’ Monolithic Refractories (Calderys) Products and Application
Imerys’ Refractory Mineral Products and Application
Distribution of Imerys’ Refractory Minerals Production Bases
Distribution of Calderys Company’s Production Bases
Milestones in the Development of Calderys, 2005-2015
Development Course of Krosaki
Revenue and Net Income of Krosaki, FY2009-FY2015
Revenue (by Business) of Krosaki, FY2012-FY2015
Applications and Percentage of Krosaki’s Refractories, FY2014
Revenue (by Region) of Krosaki, FY2012-FY2014
Development Course of Shinagawa
Main Products of Shinagawa
Selected Economic Indicators of Shinagawa, FY2012-FY2015
Revenue (by Business) of Shinagawa, FY2012-FY2015
Global Operations of Shinagawa
Overseas Sales of Shinagawa, FY2009-FY2014
Distribution of Shinagawa’s Companies in China
Main Products and Services of Magnezit
Global Operations of Magnezit
Key Clients of Magnezit
Main Products of HWI
Main Plants and Products of HWI
Hit Products of Morgan Advanced Materials
Revenue and Profits of Morgan Advanced Materials, 2009-2015
Revenue of Morgan Advanced Materials (by Country/Region), 2012-2015
Revenue and Profit Margin of Morgan Advanced Materials (by Business), FY2013-FY2015
Revenue of Morgan Advanced Materials (by Applied Sector), FY2014
Key Companies of Morgan Advanced Materials in China
Distribution of Refratechnik’s Plants Worldwide
Refratechnik’s Plants in China
Main Products of Chosun
Distribution of Chosun’s Key Bases Worldwide
Selected Economic Indicators of Chosun, 2010-2013
Production Bases of Chosun in China
Main Refractory Products of Minteq
Revenue (by Business) of Minerals Technologies Inc., 2014
Main Subsidiaries of Minteq
Minteq’s Revenue from Refractory Business, 2012-2015
Revenue and Operating Income of Saint-Gobain, 2013-2015
Key Operations of Saint-Gobain
Application of Saint-Gobain’s Refractories and Competitors
Revenue of Saint-Gobain (by Business), 2013-2015
Revenue of Saint-Gobain (by Region), 2013-2015
Business Turnover of Saint-Gobain in China, 2008-2015
Refractory Companies of Saint-Gobain in China
Revenue and Net Income of Puyang Refractories Group, 2009-2015
Output and Sales Volume of Puyang Refractories Group, 2011-2015
Operating Revenue and YoY Growth (by Product) of Puyang Refractories Group, 2012-2015
Operating Revenue (by Region) of Puyang Refractories Group, 2009-2015
Operating Revenue and Percentage (by Target Customer) of Puyang Refractories Group, 2011-2014
Operating Revenue and Percentage (by Sales Model) of Puyang Refractories Group, 2012-2014
Gross Margin of Refractories of Puyang Refractories Group, 2009-2015
Gross Margin of Main Products of Puyang Refractories Group, 2012-2015
M&A Events of Puyang Refractories Group, 2009-2015
Revenue and Net Income of Luyang Energy-saving Materials, 2009-2015
Operating Revenue (by Product) of Luyang Energy-saving Materials, 2010-2015
Operating Revenue (by Region) of Luyang Energy-saving Materials, 2010-2015
Consolidated Gross Margin of Luyang Energy-saving Materials, 2009-2015
Gross Margin (by Product) of Luyang Energy-saving Materials, 2009-2015
Equity Structure of Luyang Energy-saving Materials, end-2015
Business Development of Ruitai Materials Technology, 2008-2015
Revenue and Net Income of Ruitai Materials Technology, 2009-2015
Output and Sales Volume of Ruitai Materials Technology, 2011-2015
Operating Revenue (by Product) of Ruitai Materials Technology, 2011-2015
Operating Revenue (by Region) of Ruitai Materials Technology, 2009-2015
Gross Margin of Refractory Materials of Ruitai Materials Technology, 2008-2015
Gross Margin (by Product) of Ruitai Materials Technology, 2011-2015
Revenue and Net Income of Ruitai Materials Technology’s Key Subsidiaries, 2014
Business Development of Beijing Lier High-temperature Materials, 2011-2015
Revenue and Net Income of Beijing Lier High-temperature Materials, 2009-2015
Main Production Lines and Capacities of Beijing Lier High-temperature Materials, 2015
Output and Sales Volume of Refractories (by Product) of Beijing Lier High-temperature Materials, 2012-2014
Operating Revenue (by Product) of Beijing Lier High-temperature Materials, 2012-2015
Operating Revenue (by Region) of Beijing Lier High-temperature Materials, 2010-2015
Gross Margin of Refractories of Beijing Lier High-temperature Materials, 2009-2015
Gross Margin (by Product) of Beijing Lier High-temperature Materials, 2012-2015
Integration Map of Liaoning-based Magnesite Material Bases of Beijing Lier High-temperature Materials
Main Products of Henan Rongjin High Temperature Materials
Revenue, Net Income and Gross Margin of Henan Rongjin High Temperature Materials, 2012-2015
Operating Revenue (by Product) of Henan Rongjin High Temperature Materials, 2013-2015
Top 5 Clients of Henan Rongjin High Temperature Materials, 2013-2015
Selected Economic Indicators of Zhejiang Zili Corporation Limited, 2011-2015
Output and Sales Volume of Main Products of Zhejiang Zili Corporation Limited, 2011-2015
Operating Revenue (by Product) of Zhejiang Zili Corporation Limited, 2011-2015
Operating Revenue Structure (by Sales Mode) of Zhejiang Zili Corporation Limited, 2011-2015
Zhejiang Zili Corporation Limited’s Revenue from Top 5 Clients and % of Total Revenue, 2011-2013
Construction Scheme for Equity Investment Projects of Zhejiang Zili Corporation Limited, 2015
Main Products and Application of Yingkou Qinghua Group
Refractory Material Output of Yingkou Qinghua Group, 2012-2015
Refractory Material Output of Wugang Refractory Co., Ltd, 2012-2015
Production Capacity (by Product) of Yingkou Jinlong Refractories Group, 2015
Refractory Subsidiaries and Capacities of Main Products of Yingkou Jinlong Refractories Group, 2015
Refractory Output of Yingkou Jinlong Refractories Group, 2013-2015
Development History of Shandong Refractories Group
Refractory Output of Shandong Refractories Group, 2012-2015
Production Capacity of Key Subsidiaries and Branches under Shandong Refractories Group
Refractory Output of Tongda Refractory Technologies, 2012-2015
Revenue and Net Income of Tongda Refractory Technologies, 2011-2015
Refractory Output of Sinosteel Refractory, 2012-2015
Refractory Output of Jiangsu Sujia Group, 2012-2015
Main Refractory Products of Haicheng Houying Trade Group
Revenue and Taxes of Haicheng Houying Trade Group, 2009-2015
Refractory Output of Haicheng Houying Trade Group, 2012-2015
Selected Economic Indicators of Shanxi Xixiaoping Refractories, 2012-2015
Refractory Output of Zhengzhou Zhengdong Technology, 2012-2015
Refractory Output of Shandong Luqiao New Materials, 2012-2015
Refractory Output of Sinosteel Luoyang Institute of Refractories Research, 2012-2015
Production Capacity (by Product) of Haicheng Magnesite Refractory General Factory
Revenue and YoY Growth of Haicheng Magnesite Refractory General Factory, 2007-2015
Demand and Output of Refractories in China, 2014-2020
Sales Value of World’s Influential Refractory Companies, 2014-2015
Refractory Output of Leading Chinese Enterprises, 2014-2015
Big M&A Events in Chinese Refractories Industry, 2013-2015
如果这份报告不能满足您的要求,我们还可以为您定制报告,请 留言说明您的详细需求。
|