|
|
|
报告导航:研究报告—
生命科学—制药医疗
|
|
2016-2019年中国血液制品行业研究报告 |
 |
字数:4.8万 |
页数:158 |
图表数:158 |
|
中文电子版:9000元 |
中文纸版:4500元 |
中文(电子+纸)版:9500元 |
|
英文电子版:2650美元 |
英文纸版:2800美元 |
英文(电子+纸)版:2950美元 |
|
编号:ZYM075
|
发布日期:2016-03 |
附件:下载 |
 |
|
|
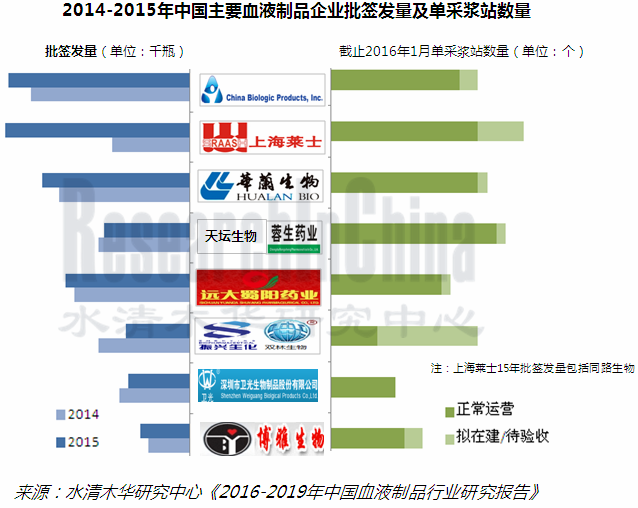
虽然重组血液制品在国外已发展多年,但中国血液制品生产均是从人体血液中分离提取的各类蛋白质。因此,血浆资源的储备和控制是中国血液制品企业发展的关键之一。受行业高景气度和利好政策等影响,2015年中国单采浆站数量已有190多个,投浆量达4700吨,批签发总量5576万瓶,较上年增加336万瓶。
由于中国新建血浆站要求严格,资金相对雄厚、研发能力较强且浆站资源相对丰富的上海莱士、中国生物制品(山东泰邦和贵州泰邦)、华兰生物、天坛生物(包括成都蓉生)、远大蜀阳成为中国血液制品行业前五企业。2015年这五家企业投浆量合计约占全国总量的61.9%
从产品结构上看,人血白蛋白仍是中国最大血制品种类,但供应量增速放缓,2015年其在中国血制品行业的批签发份额占比下降到58.8%。近年,中国人血白蛋白批签发量的增加主要得益于进口产品供应充足。2011-2015年,中国进口人血白蛋白批签发量年均复合增长率达23.7%,在该类产品的份额占比升至55.6%。Behring、Baxter、Grifols和Octapharma仍是中国前四家人血白蛋白进口企业,2015年这四家占该类产品批签发总量的50.7%。
静丙(ph4))为中国血制品第二大品种,2015年批签发量同比增长31.5%达到940万瓶 (折算2.5g/瓶),份额占比增至16.9%。同期,除狂犬病人免疫球蛋白批签发略有下滑外,破伤风人免疫球蛋白、乙肝免疫球蛋白等免疫球蛋白产品和凝血因子类产品的批签发均有不同幅度提高。
而市场需求强劲的人凝血因子VIII、人凝血酶原复合物等小制品是近两年研发进展最大的 品种。就人凝血因子VIII来讲,截止2015年底,上海新兴已获批上市、深圳卫光进入新药注册阶段、双林生物进入试制阶段、博雅生物进入了3期临床(预计2016年下半年可产业化)、中原瑞德已获得临床批件、哈尔滨派斯菲科已申请临床。
为了占有并有效的利用血浆原料,除了收购,企业间合作运营的趋势也在加强。2015年8月,泰邦生物与新疆德源签订战略合作协议,在未来3年内前者每年向后者采购不少于120/180/200吨血浆。2015年,大安制药与广东卫伦积极筹划血浆组分 II+III 调拨合作,即将大安制药(目前的只能生产人血白蛋白)调拨的血浆组分 II+III用于广东卫伦免疫球蛋白类产品的生产。
《2016-2019年中国血液制品行业研究报告》主要包括以下几个方面:
 中国血液制品疫苗行业市场特点、运行环境、总体现状等; 中国血液制品疫苗行业市场特点、运行环境、总体现状等;
中国血液制品行业市场供需、竞争格局、进出口及发展预测等;
中国人血白蛋白、静丙、破伤风人免疫球蛋白、凝血因子等8种血液制品细分产品的市场供需、竞争格局等;
中国13家主要血液制品企业的经营状况、血液制品业务及发展前景等。
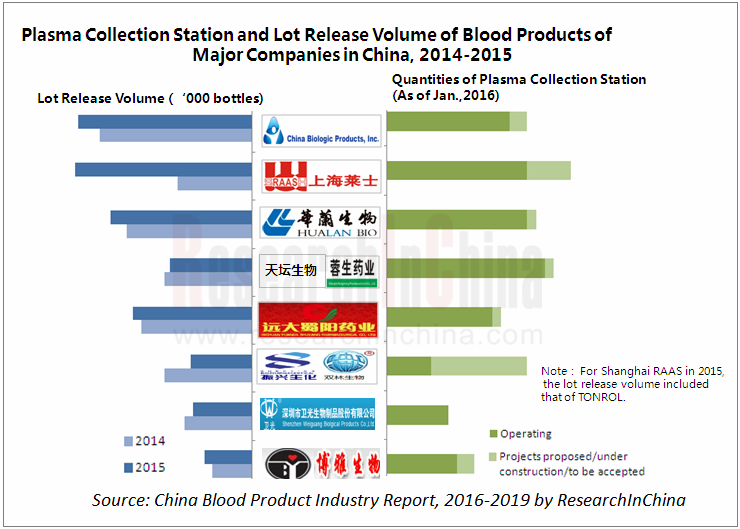
Recombinant blood products have developed for many years in foreign countries, but China’s blood products are still proteins extracted from human blood. Thus, reserves and control of plasma resources are the key to the development of Chinese blood product enterprises. Amid the industrial prosperity and favorable policies, China had more than 190 plasma collection stations with the production-use plasma volume of 4, 700 tons and the total lot release volume jumped by 3.36 million bottles year on year to 55.76 million bottles in 2015.
Given stringent requirements on new domestic plasma stations, Shanghai RAAS, China Biologic Products (Shandong Taibang and Guizhou Taibang), Hualan Biological Engineering, Tiantan Biological (including Chengdu Rongsheng) and Yuanda Shuyang which boast abundant capital, powerful R&D strength and rich plasma station resources have become the top five companies in China blood product industry, contributing 61.9% to China’s production-use plasma volume in 2015.
From the point of view of the product structure, human albumin is still the largest type of blood products in China, but its supply has slowed down with a lower contribution 58.8% to China’s total blood product lot release volume in 2015. In recent years, the rising lot release volume of Chinese human albumin is mainly attributed to ample supply of imported products. In 2011-2015, the lot release volume of human albumin imported by China grew at a CAGR of 23.7%, accounting for as much as 55.6% of the total. China's top four human albumin import enterprises --- Behring, Baxter, Grifols and Octapharma seized 50.7% of the total lot release volume in 2015.
China's second largest type of blood products -- human immunoglobulin (ph4) for intravenous injection saw its lot release volume jump by 31.5% year on year to 9.4 million bottles (2.5g / bottle) and its share increase to 16.9% in 2015. Over the same period, tetanus human immunoglobulin, hepatitis B immune globulin and other immune globulin products and coagulation factor products witnessed growth in lot release volume except human rabies immunoglobulin whose lot release volume declined slightly.
The research and development of human blood coagulation factor VIII, human prothrombin complex and other small products in rigid demand has made the most remarkable progress in recent years. Concerning human blood coagulation factor VIII, Shanghai Xinxing had been approved to launched its human blood coagulation factor VIII, Shenzhen Weiguang had entered the new drug registration stage, Guangdong Shuanglin Bio-Pharmacy had embarked on trial production, Jiangxi Boya Bio-Pharmaceutical had gone into clinical phase III (the industrialization is expected in H2 2016), Wuhan Zhongyuan Ruide had obtained clinical approval and Harbin Pacific Biopharmaceutical had applied for clinical approval by the end of 2015.
In order to possess and effectively use plasma raw materials, enterprises are more willing to cooperate mutually in addition to acquisition. In August 2015, China Biologic Products and Xinjiang Deyuan signed a strategic cooperation agreement, under which the former should purchase at least 120/180/200 tons of plasma from the latter per year in the next three years. In 2015, Hebei Da’an Pharmaceutical and Guangdong Weilun actively planned to cooperate on the allocation of plasma fraction II + III, namely the former (it only produces human albumin now) should allocate partial plasma fraction II + III to Guangdong Weilun for the production of immunoglobulin products.
China Blood Product Industry Report, 2016-2019 focuses on the followings:
 Market characteristics, operating environments, status quo, etc. of China blood product industry; Market characteristics, operating environments, status quo, etc. of China blood product industry;
Supply and demand, competition pattern, import and export, development forecast, etc. of China blood product industry;
Supply and demand, competition pattern, etc. of 8 blood product segments, including human albumin, human immunoglobulin (pH4) for intravenous injection, blood coagulation factor and tetanus human immunoglobulin;
Operation, blood product business and prospects of 13 major Chinese blood product companies.
第一章 血液制品行业概述
1.1血液制品定义
1.2血液制品分类
1.3重组血液制品
1.4血液制品产业链
1.5血液制品特点
第二章 中国血液制品行业总体概述
2.1市场规模
2.2发展现状
2.3 市场供需
2.3.1 市场供给
2.3.2 市场需求
2.4 市场竞争
2.5运行环境
2.5.1国际市场
2.5.2政策环境
2.5.3国内生物制药市场
2.6进出口分析
第三章 中国血液制品细分市场分析
3.1人血白蛋白
3.1.1 市场供需
3.1.2 竞争格局
3.1.3 发展前景
3.2静注人免疫球蛋白(ph4)
3.2.1 市场供需
3.2.2竞争格局
3.3凝血因子VIII
3.3.1 市场供需
3.3.2 竞争格局
3.3.3 发展前景
3.4乙肝免疫球蛋白
3.4.1 市场供需
3.4.2竞争格局
3.5人免疫球蛋白
3.5.1 市场供需
3.5.2竞争格局
3.6人凝血酶原复合物
3.6.1 市场供需
3.6.2竞争格局
3.7破伤风免疫球蛋白
3.7.1 市场供需
3.7.2竞争格局
3.8狂犬病人免疫球蛋白
3.8.1 市场供需
3.8.2竞争格局
第四章 国内主要厂商
4.1中国生物制品有限公司(NASDAQ: CBPO)
4.1.1公司介绍
4.1.2经营状况
4.1.3 营收构成
4.1.4 客户及供应商
4.1.5 研发与投资
4.1.6 山东泰邦生物制品有限公司
4.1.7 贵州泰邦生物制品有限公司
4.1.8 西安回天血液制品有限责任公司
4.1.9 前景及预测
4.2华兰生物工程股份有限公司(002007.SZ)
4.2.1公司介绍
4.2.2 经营状况
4.2.3 营收构成
4.2.4 毛利率
4.2.5客户与供应商
4.2.6 研发与投资
4.2.7血液制品
4.2.8 前景及预测
4.3上海莱士血液制品股份有限公司(002252.SZ)
4.3.1公司介绍
4.3.2经营状况
4.3.3营收构成
4.3.4 毛利率
4.3.5 客户及供应商
4.3.6研发及投资
4.3.7 前景及预测
4.4北京天坛生物制品股份有限公司(600161.SH)
4.4.1公司介绍
4.4.2 经营状况
4.4.3 营收构成
4.4.4客户与供应商
4.4.5毛利率
.4.4.6 研发和投资
4.4.7血液制品(成都蓉生药业有限公司)
4.4.8 前景及预测
4.5振兴生化股份有限公司(000403.SZ)
4.5.1 公司介绍
4.5.2 经营状况
4.5.3 营收构成
4.5.4 毛利率
4.5.5 客户及供应商
4.5.6 研发及投资
4.5.7 血液制品(广东双林生物制药有限公司)
4.5.8 前景及预测
4.6江西博雅生物制药有限公司(300294.SZ)
4.6.1公司介绍
4.6.2经营状况
4.6.3 营收构成
4.6.4 毛利率
4.6.5 客户及供应商
4.6.6研发及投资
4.6.7 前景及预测
4.7四川远大蜀阳药业股份有限公司(300294.SZ)
4.7.1公司介绍
4.7.2血液制品业务
4.8上海生物制品研究所
4.8.1公司介绍
4.8.2血液制品业务
4.9山西康宝生物制品股份有限公司
4.9.1公司介绍
4.9.2血液制品业务
4.10绿十字(中国)生物制品有限公司
4.10.1公司介绍
4.10.2血液制品业务
4.11武汉人福医药集团股份有限公司(600079.SH)
4.11.1公司简介
4.11.2 经营状况
4.11.3 血液制品(武汉中原瑞德生物制品有限责任公司)
4.12云南沃森生物技术股份有限公司(300142.SZ)
4.12.1 公司简介
4.12.2 经营状况
4.12.3血液制品(河北大安制药有限公司和广东卫伦生物制药有限公司)
4.13 深圳卫光生物制品股份有限公司
4.13.1 公司介绍
4.13.2 经营状况
4.13.3 营收构成
4.13.4 毛利率
4.13.5客户及供应商
4.13.6研发与投资
4.13.7 前景与预测
第五章 总结与预测
5.1 公司分析
5.2 发展预测
1. Overview of Blood Product Industry
1.1 Definition
1.2 Classification
1.3 Recombinant Blood Products
1.4 Industry Chain
1.5 Features
2. Overview of China Blood Product Industry
2.1 Market Size
2.2 Status Quo
2.3 Supply and Demand
2.3.1 Supply
2.3.2 Demand
2.4 Competition
2.5 Operating Environment
2.5.1 International
2.5.2 Policy
2.5.3 Domestic Biopharmaceutical Market
2.6 Import and Export
3. Blood Product Market Segments in China
3.1 Human Albumin
3.1.1 Supply and Demand
3.1.2 Competition Pattern
3.1.3 Prospects
3.2 Human Immunoglobulin (pH4) for Intravenous Injection
3.2.1 Supply and Demand
3.2.2 Competition Pattern
3.3 Blood Coagulation Factor VIII
3.3.1 Supply and Demand
3.3.2 Competition Pattern
3.3.3 Prospects
3.4 Hepatitis B Immunoglobulin
3.4.1 Supply and Demand
3.4.2 Competition Pattern
3.5 Human Immunoglobulin
3.5.1 Supply and Demand
3.5.2 Competition Pattern
3.6 Human Prothrombin Complex
3.6.1 Supply and Demand
3.6.2 Competition Pattern
3.7 Tetanus Immunoglobulin
3.7.1 Supply and Demand
3.7.2 Competition Pattern
3.8 Human Rabies Immunoglobulin
3.8.1 Supply and Demand
3.8.2 Competition Pattern
4. Major Chinese Manufacturers
4.1 China Biologic Products Inc. (NASDAQ: CBPO)
4.1.1 Profile
4.1.2 Operation
4.1.3 Revenue Structure
4.1.4 Customers and Suppliers
4.1.5 R&D and Investment
4.1.6 Shandong Taibang Biological Products Co., Ltd.
4.1.7 Guizhou Taibang Biological Products Co., Ltd.
4.1.8 Xi'an Huitian Blood Products Co., Ltd.
4.1.9 Outlook and Prospects
4.2 Hualan Biological Engineering Inc. (002007.SZ)
4.2.1 Profile
4.2.2 Operation
4.2.3 Revenue Structure
4.2.4 Gross Margin
4.2.5 Customers and Suppliers
4.2.6 R&D and Investment
4.2.7 Blood Products
4.2.8 Outlook and Prospects
4.3 Shanghai RAAS Blood Products Co., Ltd. (002252.SZ)
4.3.1 Profile
4.3.2 Operation
4.3.3 Revenue Structure
4.3.4 Gross Margin
4.3.5 Customers and Suppliers
4.3.6 R&D and Investment
4.3.7 Outlook and Prospects
4.4 Beijing Tiantan Biological Products Co., Ltd. (TIANTANBIO, 600161.SH)
4.4.1 Profile
4.4.2 Operation
4.4.3 Revenue Structure
4.4.4 Customers and Suppliers
4.4.5 Gross Margin
4.4.6 R&D and Investment
4.4.7 Blood Products (Chengdu Rongsheng Pharmaceutical Co., Ltd.)
4.4.8 Outlook and Prospects
4.5 Zhenxing Biopharmaceutical and Chemical Co., Ltd. (000403.SZ)
4.5.1 Profile
4.5.2 Operation
4.5.3 Revenue Structure
4.5.4 Gross Margin
4.5.5 Customers and Suppliers
4.5.6 R&D and Investment
4.5.7 Blood Products (Guangdong Shuanglin Bio-Pharmacy Co., Ltd.)
4.5.8 Outlook and Prospects
4.6 Jiangxi Boya Bio-Pharmaceutical Co., Ltd. (300294.SZ)
4.6.1 Profile
4.6.2 Operation
4.6.3 Revenue Structure
4.6.4 Gross Margin
4.6.5 Customers and Suppliers
4.6.6 R&D and Investment
4.6.7 Outlook and Prospects
4.7 Sichuan Yuanda Shuyang Pharmaceutical Co., Ltd.
4.7.1 Profile
4.7.2 Blood Products
4.8 Shanghai Institute of Biological Products Co., Ltd.
4.8.1 Profile
4.8.2 Blood Products
4.9 Shanxi Kangbao Biological Product Co., Ltd.
4.9.1 Profile
4.9.2 Blood Products
4.10 Green Cross
4.10.1 Profile
4.10.2 Blood Products
4.11 Humanwell Healthcare Group Co., Ltd. (600079.SH)
4.11.1 Profile
4.11.2 Operation
4.11.3 Blood Products (Wuhan Zhongyuan Ruide Biological Product Co., Ltd.)
4.12 Walvax Biotechnology Co, Ltd. (300142.SZ)
4.12.1 Profile
4.12.2 Operation
4.12.3 Blood Products (Hebei Da’an Pharmaceutical Co., Ltd. and Guangdong Weilun Biological Pharmaceutical Co., Ltd.)
4.13 Shenzhen Weiguang Biological Products Co., Ltd.
4.13.1 Profile
4.13.2 Operation
4.13.3 Revenue Structure
4.13.4 Gross Margin
4.13.5 Customers and Suppliers
4.13.6 R&D and Investment
4.13.7 Outlook and Prospects
5. Summary and Forecast
5.1 Company Analysis
5.2 Growth Prediction
图:血液的基本组成
图:血浆蛋白分离程序
表:血液制品的分类及作用
表:基因重组类血制品与传统血制品对比
表:国内外重组血液制品产品种类及对比
图:血液制品产业链
图:血浆采集与分离的生产工艺耗时
图:血液制品企业与化学制药企业运营成本及费用对比
表:2014年中国部分血液制品价格
图:2003-2015年中国血液制品市场规模
表:2009-2015年中国血液制品(分产品)批签发量
图:2009-2015年中国血液制品产品结构(按批签发量计)
表:中国与欧美国家人均献浆频率及采浆量对比
表:中美采浆现状对比
图:2008-2015年中国血浆年投浆量
图:2008-2015年中国采血浆站数量
图:截止2015年底中国血浆站资源地域分布
表:中国主流血液制品医保覆盖情况
表:中国与发达国家血液制品人均使用量的对比
表:2014年中国主要血液制品企业血浆站分布、投浆量及血液制品业务收入
表:2015年中国主要血液制品企业血浆站分布、投浆量及血液制品业务收入
表:中国血液制品生产企业产品线对比
图:2013年全球血液制品企业竞争格局
图:全球血液制品产品结构
表:国外上市的血液制品
表:全球血液制品生产商
表:中国血液制品主要政策
表:2014-2015年中国药品最高零售价相关政策
图:2008-2015年中国进口人血白蛋白批签发量
图:2005-2014年中国样本医院人血白蛋白平均采购价格
图:2007-2015年中国人血白蛋白国产与进口比例(按批签发量计)
表:2008-2015年中国人血白蛋白主要厂商市场份额(按批签发量计)
表:2013年世界各国每千人静丙消费量(g/1000人)
图:2007-2015年中国静丙(ph4)的批签发数量及增长率
图:中国与其他国家静丙(ph4)价格对比
图:2005-2014年中国样本医院静丙平均采购价格
图:2007-2015年中国静注人免疫球蛋白主要厂商市场份额(按批签发量计)
图:2008-2015年中国凝血因子VIII批签发数量及增长率
图:2008-2015年中国人凝血因子VIII厂商市场份额(按批签发量计)
表:人源性凝血因子VIII与重组凝血因子VIII的比较
图:世界主要国家人均重组Ⅷ因子与血浆Ⅷ因子的使用量(IU/人)
图:2009-2015年中国乙肝免疫球蛋白的批签发数量及增长率
图:2008-2015年中国乙肝免疫球蛋白市场主要厂商市场份额(按批签发量计)
表:2014年中国各剂型人免疫球蛋白价格
图:2008-2015年中国人免疫球蛋白批签发数量及增长率
图:2008-2015年中国人免疫球蛋白批签发量主要厂商市场份额(按批签发量计)
图:2008-2015年中国人凝血酶原复合物批发签量及增长率
图:2008-2015年中国人凝血酶原复合物厂商市场份额(按批签发量计)
图:2008-2015年中国破伤风免疫球蛋白批签发数量及增长率
图:2008-2015年中国破伤风免疫球蛋白主要厂商市场份额(按批签发数量计)
图:2008-2014年中国狂犬病发病数及死亡率
图:2008-2015年中国狂犬病人免疫球蛋白批签发数量及增长率
图:2008-2015年中国狂犬病人免疫球蛋白主要厂商市场份额(按批签发量计)
图:截至2014年底中国生物制品股权结构图
表:2015年中国生物制品血液制品生产基地及浆站分布
图:2008-2015年中国生物制品营业收入和营业利润
图:2011-2015年中国生物制品毛利率
表:2011-2015年中国生物制品(分产品)营业收入
图:2010-2015年中国生物制品(分产品)营业收入构成
图:2008-2014年中国生物制品前五客户收入贡献及占总营业收入的比重
图:2010-2015年中国生物制品研发投入及占营业收入的比重
表:2008-2015年山东泰邦血液制品批签发量
表:2008-2015年贵阳黔峰血液制品批签发量
表:2008-2014年西安回天血液制品批签发量
图:2014-2019年中国生物制品营业收入与营业利润
图:2008-2015年华兰生物营业收入和营业利润
表:2008-2015年华兰生物(分行业)营业收入
表:2008-2015年华兰生物(分产品)毛利率
图:2007-2014年华兰生物前五客户收入贡献及占总营业收入的比重
图:2007-2014年华兰生物前五供应商采购金额及占总采购金额的比重
表;2014年华兰生物前五供应商名称、采购金额及其占比
图:2008-2015年华兰生物研发投入及占营业收入的比重
表:华兰生物血液制品种类及规格
表:截止2015年底华兰生物采浆站分布
表:2008-2015年华兰生物血液制品批发签量
图:2008-2015年华兰生物血液制品营业收入及毛利率
表:2008-2015年华兰生物血液制品(分产品)营业收入及毛利率
图:2014-2019年华兰生物营业收入与营业利润
表:2015上半年上海莱士子公司及其经营情况(百万元)
表:截止2015年底上海莱士血浆站分布情况
图:2008-2015年上海莱士营业收入和营业利润
表:2008- 2015年上海莱士血液制品批发签量
表:2008-2015年同路生物血液制品批签发量
表:2008-2015年上海莱士(分产品)主营业收入
表:2008-2015年上海莱士(分地区)营业收入
图:2008-2015年上海莱士(分产品)毛利率
图:2008-2015年上海莱士前五客户收入贡献及其占比
图:2007-2014年上海莱士前五供应商采购额占总采购金额的比重
图:2008-2015年上海莱士研发投入及占营业收入的比重
图:2014-2019年上海莱士营业收入与营业利润
表:2015上半年天坛生物子公司及其收入、利润(百万元)
图:2008-2015年天坛生物营业收入和营业利润
图:2008-2015年天坛生物(分行业)营业收入
表:2008-2015年天坛生物(分地区)营业收入
图:2008-2014年天坛生物前五供应商及其采购金额占总采购金额比重
图:2008-2014年天坛生物前五客户收入贡献及占总营业收入的比重
图: 2008-2015年天坛生物(分行业)毛利率
图:2009-2015年天坛生物研发成本及占营业收入的比重
表:截至2015年底天坛生物采浆站分布
图:2008-2015年天坛生物血液制品营业收入及毛利率
表:2008-2015年成都蓉生和天坛生物血液制品批发签量
图:2014-2019年天坛生物营业收入与营业利润
图:2008-2015年ST生化营业收入与营业利润
表:2009-2015年ST生化(分产品)主营业收入
表:2009-2015年ST生化(分产品)毛利率
图:2009-2014年ST生化前五客户收入贡献及占同期营业收入的比重
表:2014年ST生化前五客户名称、收入贡献及占比
表: 2014年ST生化前五供应商购金额及占同期采购总额的比重
图:2009-2015年ST生化研发投入及占同期营业收入的比重
图:2010-2015年双林生物投浆量
表:截至2015年底双林生物采浆站分布
表:2008-2015年双林生物血液制品批发签量
图:2009-2015年ST生化血液制品营业收入与毛利率
图:2014-2019年ST生化营业收入与营业利润预测
表:截止2015年底博雅生物单采浆站分布
图:2008-2015年博雅生物采浆量
图:2008-2015年博雅生物营业收入和营业利润
表:2009-2015年博雅生物(分产品)营业收入
表:2011-2014年博雅生物主要血液制品批签发量
表:2009-2014年博雅生物(分地区)主营业收入
图:2009-2015年博雅生物(分产品)毛利率
图:2009-2015年博雅生物前五客户收入贡献及占营业收入的比重
图:2009-2015年博雅生物前五供应商采购金额及占总采购金额的比重
图:2009-2015年博雅生物研发投入及占营业收入的比重
表:截止2015年10月博雅生物在研产品及进度
图:2014-2019年博雅生物营业收入与营业利润预测
表:截止2015年底蜀阳药业血浆站分布
表:2008-2015年远大蜀阳血液制品批签发量
表:2008-2015年上海所血液制品批签发量
表:截止2015年底上海所血浆站分布
表:截止2015年底山西康宝血浆站分布
表:2008-2015年康宝生物血液制品批签发量
表:截止2015年底绿十字(中国)血浆站分布
表:2008-2015年绿十字(中国)血液制品批签发量
图:2009-2015年人福医药营业收入与营业利润
表:2008-2015年武汉瑞德血液制品批发签量
图:沃森生产产业布局
图:2009-2015年沃森生物营业收入与营业利润
表:2009-2015年沃森生物(分产品)营业收入
表:截止2015年底深圳卫光单采浆站分布
表:2012-2015年深圳卫光采浆量和投浆量
表:2012-2015年深圳卫光营业收入和营业利润
表:2012-2015年深圳卫光(分产品)产能、产销量
表:2012-2015年深圳卫光(分产品)收入及占比(单位:百万元
表:2012-2015年深圳卫光(分产品)收入及占比
表:2012-2015年深圳卫光(分产品)毛利率
表:2012-2015年深圳卫光前五客户名称、收入贡献及占比
表:2012-2015年深圳卫光前五供应商名称、采购金额及占比
图:2012-2015年深圳卫光研发投入及占营业收入比重
表:截止2015年底深圳卫光部分在研产品及进度
表:深圳卫光募投项目
图:2014-2019年深圳卫光营业收入与营业利润
图:截止2015年12月中国主要血液制品企业浆站数量
图:2014-2015年中国主要血液制品企业投浆量
表:2011-2015年中国主要血液制品企业的血液制品收入
表:2008-2015年中国血液制品行业主要并购事件
图:2014-2019年中国血液制品市场规模
图:2011-2015年中国主要血液制品企业毛利率
Basic Components of Blood
Plasma Protein Separation Procedure
Classification and Function of Blood Products
Comparison between Gene Recombinant Blood Products and Traditional Blood Products
Comparison between Domestic and Foreign Recombinant Blood Products in Types
Blood Product Industry Chain
Time Consumption of Plasma Collection and Separation Process
Comparison between Blood Product Enterprises and Chemical & Pharmaceutical Enterprises in Operating Costs and Expenses
Prices of Some Blood Products in China, 2014
Blood Product Market Size in China, 2003-2015
Lot Release Volume of Blood Products in China (by Product), 2009-2015
Blood Product Structure in China (by Lot Release Volume), 2009-2015
Per Capita Frequency of Plasma Donation and Plasma Collection in China vs. the Occident
Plasma Collections in China vs. USA
Production-use Plasma Volume in China, 2008-2015
Number of Plasma Collection Stations in China, 2008-2015
Geographical Distribution of Plasma Station Resources in China by the End of 2015
Mainstream Blood Products with Medical Insurance Coverage in China
Per Capita Consumption of Blood Products in China vs. Developed Countries
Plasma Station Distribution, Production-use Plasma Volume and Blood Product Revenue of Major Blood Product Enterprises in China, 2014
Plasma Station Distribution, Production-use Plasma Volume and Blood Product Revenue of Major Blood Product Enterprises in China, 2015
Comparison of Chinese Blood Product Manufacturing Enterprises in Product Line
Competition Pattern of Global Blood Product Enterprises, 2013
Product Structure of Global Blood Products
Blood Products Available in Overseas Market
Global Blood Product Manufacturers
Main Policies on Chinese Blood Products
Policies on Maximum Retail Price of Drugs in China, 2014-2015
Lot Release Volume of Imported Human Albumin in China, 2008-2015
Average Human Albumin Purchase Price of Sample Hospitals in China, 2005-2014
Proportion of Domestic and Imported Human Albumin in China (by Lot Release Volume), 2007-2015
Market Share of Major Human Albumin Manufacturers in China (by Lot Release Volume), 2008-2015
Consumption of Human Immunoglobulin (pH4) for Intravenous Injection per 1,000 Persons by Country, 2013 (g/1,000 persons)
Lot Release Volume and Growth Rate of Human Immunoglobulin (pH4) for Intravenous Injection in China, 2007-2015
Price of Human Immunoglobulin (pH4) for Intravenous Injection in China vs. Other Countries
Average Purchase Price of Human Immunoglobulin (pH4) for Intravenous Injection of Sample Hospitals in China, 2005-2014
Market Share of Major Manufacturers of Human Immunoglobulin (pH4) for Intravenous Injection in China (by Lot Release Volume), 2007-2015
Lot Release Volume and Growth Rate of Blood Coagulation Factor VIII in China, 2008-2015
Market Share of Major Human Blood Coagulation Factor VIII Manufacturers in China (by Lot Release Volume), 2008-2015
Comparison between Human Blood Coagulation Factor VIII and Recombinant Blood Coagulation Factor VIII
Per Capita Consumption of Recombinant VIII Factor and Plasma VIII Factor in Major Countries (IU/Person)
Lot Release Volume and Growth Rate of Hepatitis B Immunoglobulin in China, 2009-2015
Market Share of Major Hepatitis B Immunoglobulin Manufacturers in China (by Lot Release Volume), 2008-2015
Prices of Human Immunoglobulin in China by Dosage, 2014
Lot Release Volume and Growth Rate of Human Immunoglobulin in China, 2008-2015
Market Share of Major Human Immunoglobulin Manufacturers in China (by Lot Release Volume), 2008-2015
Lot Release Volume and Growth Rate of Human Prothrombin Complex in China, 2008-2015
Market Share of Major Human Prothrombin Complex Manufacturers in China (by Lot Release Volume), 2008-2015
Lot Release Volume and Growth Rate of Tetanus Immunoglobulin in China, 2008-2015
Market Share of Major Tetanus Immunoglobulin Manufacturers in China (by Lot Release Volume), 2008-2015
Rabies Incidents and Death Rate in China, 2008-2014
Lot Release Volume and Growth Rate of Human Rabies Immunoglobulin in China, 2008-2015
Market Share of Major Human Rabies Immunoglobulin Manufacturers in China (by Lot Release Volume), 2008-2015
Equity Structure of China Biologic Products by the End of 2014
Distribution of Blood Products Manufacturing Bases and Plasma Stations of CBPO, 2015
Revenue and Operating Income of CBPO, 2008-2015
Gross Margin of CBPO, 2011-2015
Revenue Breakdown of CBPO (by Product), 2011-2015
Revenue Structure of CBPO (by Product), 2010-2015
CBPO’s Revenue from Top 5 Customers and % of Total Revenue, 2008-2014
R&D Costs and % of Total Revenue of CBPO, 2010-2015
Lot Release Volume of Blood Products of Shandong Taibang Biological Products, 2008-2015
Lot Release Volume of Blood Products of Guiyang Qianfeng Biological Products, 2008-2015
Lot Release Volume of Blood Products of Xi'an Huitian Blood Products, 2008-2014
Revenue and Operating Income of CBPO, 2014-2019E
Revenue and Operating Income of Hualan Biological Engineering Inc., 2008-2015
Revenue of Hualan Biological Engineering Inc. (by Sector), 2008-2015
Gross Margin of Hualan Biological Engineering Inc. (by Product), 2008-2015
Hualan Biological Engineering Inc.’s Revenue from Top 5 Customers and % of Total Revenue, 2007-2014
Hualan Biological Engineering Inc.’s Procurement from Top 5 Suppliers and % of Total Procurement, 2007-2014
Name List and Procurement Contribution of Hualan Biological Engineering Inc.’s Top 5 Suppliers, 2014
R&D Costs and % of Total Revenue of Hualan Biological Engineering Inc., 2008-2015
Types and Specifications of Blood Products of Hualan Biological Engineering Inc.
Distribution of Plasma Collection Stations of Hualan Biological Engineering Inc. by the End of 2015
Lot Release Volume of Blood Products of Hualan Biological Engineering Inc., 2008-2015
Revenue and Gross Margin of Blood Products of Hualan Biological Engineering Inc., 2008-2015
Revenue and Gross Margin of Blood Products of Hualan Biological Engineering Inc. (by Product), 2008-2015
Revenue and Operating Income of Hualan Biological Engineering Inc., 2014-2019E
Shanghai RAAS’s Subsidiaries and Their Operation, H1 2015 (RMB mln)
Distribution of Plasma Stations of Shanghai RAAS by the End of 2015
Revenue and Operating Income of Shanghai RAAS, 2008-2015
Lot Release Volume of Blood Products of Shanghai RAAS, 2008-2015
Lot Release Volume of Blood Products of Tonrol Bio-Pharmaceutical, 2008-2015
Operating Revenue of Shanghai RAAS (by Product), 2008-2015
Revenue of Shanghai RAAS (by Region), 2008-2015
Gross Margin of Shanghai RAAS (by Product), 2008-2015
Shanghai RAAS’s Revenue from Top 5 Customers and % of Total Revenue, 2008-2015
Shanghai RAAS’s Procurement from Top 5 Suppliers and % of Total Procurement, 2007-2014
R&D Costs and % of Total Revenue of Shanghai RAAS, 2008-2015
Revenue and Operating Income of Shanghai RAAS, 2014-2019E
TIANTANBIO’s Subsidiaries and Their Revenue and Income, H1 2015 (RMB mln)
Revenue and Operating Income of TIANTANBIO, 2008-2015
Revenue of TIANTANBIO (by Sector), 2008-2015
Revenue of TIANTANBIO (by Region), 2008-2015
TIANTANBIO’s Procurement from Top 5 Suppliers and % of Total Procurement, 2008-2014
TIANTANBIO’s Revenue from Top 5 Customers and % of Total Revenue, 2008-2014
Gross Margin of TIANTANBIO (by Sector), 2008-2015
R&D Costs and % of Total Revenue of TIANTANBIO, 2009-2015
Distribution of Plasma Collection Stations of TIANTANBIO by the End of 2015
Revenue and Gross Margin of Blood Products of TIANTANBIO, 2008-2015
Lot Release Volume of Blood Products of RonSen and TIANTANBIO, 2008-2015
Revenue and Operating Income of TIANTANBIO, 2014-2019E
Revenue and Operating Income of Zhenxing Biopharmaceutical and Chemical, 2008-2015
Operating Revenue of Zhenxing Biopharmaceutical and Chemical (by Product), 2009-2015
Gross Margin of Zhenxing Biopharmaceutical and Chemical (by Product), 2009-2015
Zhenxing Biopharmaceutical and Chemical’s Revenue from Top 5 Customers and % of Total Revenue, 2009-2014
Name List and Revenue Contribution of Zhenxing Biopharmaceutical and Chemical’s Top 5 Customers, 2014
Zhenxing Biopharmaceutical and Chemical’s Procurement from Top 5 Suppliers and % of Total Procurement, 2014
R&D Costs and % of Total Revenue of Zhenxing Biopharmaceutical and Chemical, 2009-2015
Production-use Plasma Volume of Shuanglin Bio-Pharmacy, 2010-2015
Distribution of Plasma Collection Stations of Shuanglin Bio-Pharmacy by the End of 2015
Lot Release Volume of Blood Products of Shuanglin Bio-Pharmacy, 2008-2015
Revenue and Gross Margin of Blood Products of Zhenxing Biopharmaceutical and Chemical, 2009-2015
Revenue and Operating Income of Zhenxing Biopharmaceutical and Chemical, 2014-2019E
Distribution of Single Plasma Collection Stations of Jiangxi Boya Bio-Pharmaceutical by the End of 2015
Plasma Collection Volume of Jiangxi Boya Bio-Pharmaceutical, 2008-2015
Revenue and Operating Income of Jiangxi Boya Bio-Pharmaceutical, 2008-2015
Revenue of Jiangxi Boya Bio-Pharmaceutical (by Product), 2009-2015
Lot Release Volume of Major Blood Products of Jiangxi Boya Bio-Pharmaceutical, 2011-2014
Operating Revenue of Jiangxi Boya Bio-Pharmaceutical (by Region), 2009-2014
Gross Margin of Jiangxi Boya Bio-Pharmaceutical (by Product), 2009-2015
Jiangxi Boya Bio-Pharmaceutical’s Revenue from Top 5 Customers and % of Total Revenue, 2009-2015
Jiangxi Boya Bio-Pharmaceutical’s Procurement from Top 5 Suppliers and % of Total Procurement, 2009-2015
R&D Costs and % of Total Revenue of Jiangxi Boya Bio-Pharmaceutical, 2009-2015
Products under Research and Progress of Jiangxi Boya Bio-Pharmaceutical as of Oct. 2015
Revenue and Operating Income of Jiangxi Boya Bio-Pharmaceutical, 2014-2019E
Distribution of Plasma Stations of Sichuan Yuanda Shuyang Pharmaceutical by the End of 2015
Lot Release Volume of Blood Products of Sichuan Yuanda Shuyang Pharmaceutical, 2008-2015
Lot Release Volume of Blood Products of Shanghai Institute of Biological Products, 2008-2015
Distribution of Plasma Stations of Shanghai Institute of Biological Products by the End of 2015
Distribution of Plasma Stations of Shanxi Kangbao Biological Product by the End of 2015
Lot Release Volume of Blood Products of Shanxi Kangbao Biological Product, 2008-2015
Distribution of Plasma Stations of Green Cross China by the End of 2015
Lot Release Volume of Blood Products of Green Cross China, 2008-2015
Revenue and Operating Income of Humanwell Healthcare, 2009-2015
Lot Release Volume of Blood Products of Wuhan Zhongyuan Ruide Biological Product, 2008-2015
Production Industry Layout of Walvax Biotechnology
Revenue and Operating Income of Walvax Biotechnology, 2009-2015
Revenue of Walvax Biotechnology (by Product), 2009-2015
Distribution of Single Plasma Collection Stations of Shenzhen Weiguang Biological Products by the End of 2015
Plasma Collection Volume and Production-use Plasma Volume of Shenzhen Weiguang Biological Products, 2012-2015
Revenue and Operating Income of Shenzhen Weiguang Biological Products, 2012-2015
Capacity, Production and Sales Volume of Shenzhen Weiguang Biological Products (by Product), 2012-2015
Revenue Breakdown of Shenzhen Weiguang Biological Products (by Product), 2012-2015 (RMB mln)
Revenue Structure of Shenzhen Weiguang Biological Products (by Product), 2012-2015 (RMB mln)
Gross Margin of Shenzhen Weiguang Biological Products (by Product), 2012-2015
Name List and Revenue Contribution of Shenzhen Weiguang Biological Products’ Top 5 Customers, 2012-2015
Name List and Procurement Contribution of Shenzhen Weiguang Biological Products’ Top 5 Suppliers, 2012-2015
R&D Costs and % of Total Revenue of Shenzhen Weiguang Biological Products, 2012-2015
Some Products under Research and Progress of Shenzhen Weiguang Biological Products by the End of 2015
Fundraising Projects of Shenzhen Weiguang Biological Products
Revenue and Operating Income of Shenzhen Weiguang Biological Products, 2014-2019E
Number of Plasma Stations of Major Blood Product Enterprises in China as of Dec. 2015
Production-use Plasma Volume of Major Blood Product Enterprises in China, 2014-2015
Blood Product Revenue of Major Blood Product Enterprises in China, 2011-2015
Major M&A Events of Blood Product Industry in China, 2008-2015
Market Size of Blood Products in China, 2014-2019E
Gross Margin of Major Blood Product Enterprises in China, 2011-2015
如果这份报告不能满足您的要求,我们还可以为您定制报告,请 留言说明您的详细需求。
|