|
|
|
报告导航:研究报告—
制造业—工业机械
|
|
2016-2020年全球及中国机器视觉系统行业研究报告 |
 |
字数:2.9万 |
页数:131 |
图表数:196 |
|
中文电子版:8800元 |
中文纸版:4400元 |
中文(电子+纸)版:9300元 |
|
英文电子版:2400美元 |
英文纸版:2600美元 |
英文(电子+纸)版:2700美元 |
|
编号:ZHP036
|
发布日期:2016-03 |
附件:下载 |
 |
|
|
机器视觉就是用机器代替人眼来做测量和判断。典型的机器视觉系统可分为:板卡式机器视觉系统和嵌入式机器视觉系统(智能相机)。
2015年,全球机器视觉市场规模约42亿美元,同比增长10.5%。其中,美国是全球最大的机器视觉市场,市场份额在50%以上;日本紧随其后。
中国机器视觉产业起步晚,市场基数小,但发展速度快(2009年以后进入快速发展期),已成为继美国和日本之后的全球第三大机器视觉市场。2015年其市场规模22亿元(约3.5亿美元),全球占比8.3%,增速为22.2%,高于全球平均水平。2016-2020年,在中国制造2025的推动下,中国机器视觉市场增速预计将保持在20%左右。
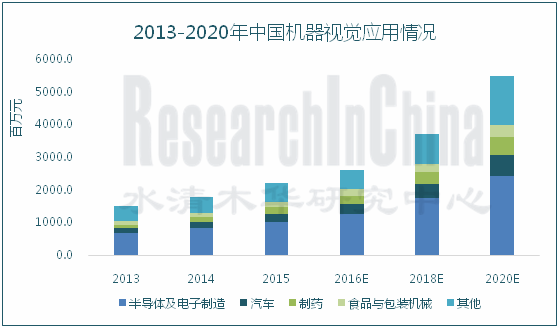
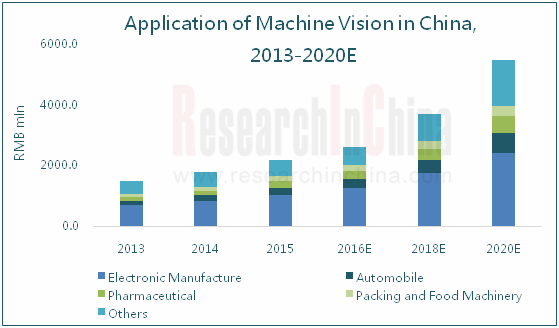
中国机器视觉系统主要应用在半导体及电子制造领域(2015年占比高达46.4%),其中较为突出的是在SMT贴片、AOI/AXI设备以及连接器检测上。此外,主要应用领域还包括汽车、制药等,2015年这两领域的应用占比分别为10.9%、9.7%。
来源:水清木华研究中心《2016-2020年全球及中国机器视觉系统行业研究报告》
国外大多数机器视觉制造商基本具备从核心组件(光源、镜头、相机、图像采集卡、图象处理软件等)到系统集成的产业链优势,而中国制造商在软件及硬件市场都不具备优势(硬件主要外购),因此大多集中在机器视觉系统集成及设备制造上。
目前,美日两国的机器视觉制造商在全球处于绝对领先地位。其中,日本基恩士无论从产业规模还是市场占有率看,都位居行业第一,2015年市场占有率达12.7%。与国际市场不同,中国机器视觉行业尚未形成明显的竞争格局。因此,为了抢占机器视觉市场,多家上市公司于2015年开始布局机器视觉业务。
万讯自控:2015年5月,与丹麦Scape公司合作,布局3D视觉和机器人业务。
慈星股份:2015年4月,收购苏州鼎纳(主营自动化装配线、视觉检测设备)68%股权,未来会以苏州鼎纳的子公司苏州图测为平台研发机器视觉控制器。
海康威视:2015年6月,推出可用于智慧工厂机器人定位引导、产品缺陷检测等的工业立体相机和面阵相机两款机器视觉产品。
水清木华研究中心《2016-2020年全球及中国机器视觉系统行业研究报告》着重研究了以下内容:
 全球机器视觉发展环境、市场规模、市场结构(主要生产国市场情况)、专利、竞争格局等情况; 全球机器视觉发展环境、市场规模、市场结构(主要生产国市场情况)、专利、竞争格局等情况;
中国机器视觉发展环境、市场现状、专利情况、成本结构、竞争格局、发展趋势等情况;
机器视觉主要组件(光源、镜头、工业相机、图像采集卡、图象处理软件、系统集成等)市场概述、主要制造商等情况;
机器视觉主要应用领域(半导体及电子制造、汽车、制药、食品包装等)市场情况、产品应用情况等;
全球8家、中国12家机器视觉制造商经营情况、在华布局、机器视觉业务等情况。
Machine vision uses machines to measure and judge instead of human eyes. Typical machine vision systems can be divided into PCB machine vision system and embedded machine vision system (smart cameras).
In 2015, the global machine vision market size approximated USD4.2 billion, up 10.5% year on year. The United States is the world's largest machine vision market with the share of above 50%, followed by Japan.
China machine vision industry started late with a small market base, but grows by leaps and bounds (it has been in a rapid development period since 2009), and has become the third-largest machine vision market following the United States and Japan. In 2015, Chinese machine vision market was worth RMB2.2 billion (about USD350 million), accounting for 8.3% of the global total and growing at 22.2% (higher than the global average). During 2016-2020, Made in China 2025 will boost Chinese machine vision market to maintain the growth rate of around 20%.
Chinese machine vision system is mainly applied in semiconductor and electronic manufacturing (accounting for 46.4% in 2015), especially SMT, AOI/AXI devices and connector detection. In addition, automobiles and pharmaceuticals consumed 10.9% and 9.7% respectively of machine vision system in 2015.
Source: Global and China Machine Vision System Industry Report, 2016-2020
Most foreign machine vision vendors enjoy superiority in the industry chain ranging from core components (light source, lens, cameras, frame grabbers, image processing software, etc.) to system integration, but Chinese counterparts do not have advantages in terms of software and hardware (they primarily purchase hardware), therefore they mostly focus on machine vision system integration and equipment manufacturing.
Currently, machine vision vendors in the United States and Japan act as the world's absolute leaders. Among them, Japan Keyence ranks first in both industrial scale and market share (market share: 12.7% in 2015). Unlike the international market, China machine vision industry has not formed a distinct competitive pattern yet. Therefore, a number of listed companies embarked on the layout of machine vision business in 2015 in order to seize the machine vision market.
In May 2015, Maxonic Automation Control and Denmark Scape collaborated to make a layout for 3D vision and robotics business.
Ningbo Cixing acquired 68% stake in Suzhou Dinnar (main business: automated assembly lines, vision inspection equipment) in April 2015 and will develop machine vision controllers via Suzhou Tuce, a subsidiary of Suzhou Dinnar.
In June 2015, Hikvision launched industrial stereo cameras and area array cameras suitable for robot positioning and guide of intelligent factories, product defect detection, etc..
Global and China Machine Vision System Industry Report, 2016-2020 focuses on the followings:
 Global machine vision development environment, market size, market structure (the market in major producing countries), patents, competitive pattern, etc; Global machine vision development environment, market size, market structure (the market in major producing countries), patents, competitive pattern, etc;
China’s machine vision development environment, market situation, patents, cost structure, competitive pattern, development trends, etc;
Market overview, major vendors and the like of major machine vision components (light source, lens, industrial cameras, frame grabbers, image processing software, system integration, etc.);
Main machine vision applications (semiconductor and electronic manufacturing, automotive, pharmaceutical, food packaging, etc.);
Operation, layout in china, machine vision business and so forth of 8 global and 12 Chinese machine vision vendors.
第一章 机器视觉行业概述
1.1 定义及分类
1.2 主要功能及特点
1.3 产业链
第二章 全球机器视觉市场现状
2.1 发展环境
2.2 市场现状
2.2.1 市场规模及结构
2.2.2 美国
2.2.3 日本
2.2.4 德国
2.2.5 英国
2.3 专利及分布
2.4 竞争格局
第三章 中国机器视觉市场现状
3.1 发展环境
3.2 市场现状
3.2.1 市场规模
3.2.2 市场结构
3.3 专利现状
3.4 成本结构
3.5 竞争格局
3.5.1 区域竞争格局
3.5.2 企业竞争格局
3.6 发展趋势
第四章 机器视觉组件市场分析
4.1 光源
4.1.1 概述
4.1.2 LED光源
4.2 镜头
4.3 工业相机
4.3.1 市场概述
4.3.2 CMOS图像传感器
4.3.3 CMOS相机模组
4.4 图像采集卡
4.5 图像处理软件
4.6 系统集成
第五章 机器视觉应用市场分析
5.1 半导体及电子制造
5.1.1 机器视觉在半导体及电子制造上的应用
5.1.2 半导体
5.1.3 PCB
5.2 汽车
5.2.1 机器视觉在汽车上的应用
5.2.2 汽车产业现状
5.3 制药
5.3.1 机器视觉在制药上的应用
5.3.2 医药产业
5.4 食品与包装机械
5.4.1 机器视觉在食品与包装机械上的应用
5.4.2 食品与包装机械产业现状
第六章 国外主要机器视觉系统制造商
6.1 基恩士
6.1.1 公司简介
6.1.2 经营情况
6.1.3 机器视觉业务
6.1.4 在华布局
6.2 康耐视
6.2.1 公司简介
6.2.2 经营情况
6.2.3 机器视觉业务
6.3 欧姆龙
6.3.1 公司简介
6.3.2 经营情况
6.3.3 机器视觉业务
6.3.4 在华布局
6.4 松下
6.4.1 公司简介
6.4.2 经营情况
6.4.3 机器视觉业务
6.4.4 在华布局
6.5 NI
6.5.1 公司简介
6.5.2 经营情况
6.5.3 机器视觉业务
6.5.4 在华布局
6.6 其他企业
6.6.1 邦纳
6.6.2 达尔萨
6.6.3 堡盟
第七章 中国主要机器视觉制造商
7.1 海得控制
7.1.1 公司简介
7.1.2 经营情况
7.1.3 机器视觉业务
7.2 大恒科技
7.2.1 公司简介
7.2.2 经营情况
7.2.3 机器视觉业务
7.3 千山药机
7.3.1 公司简介
7.3.2 经营情况
7.3.3 机器视觉业务
7.4 劲拓股份
7.4.1 公司简介
7.4.2 经营情况
7.4.3 机器视觉业务
7.5 万讯自控
7.5.1 公司简介
7.5.2 经营情况
7.5.3 机器视觉业务
7.6 汇川技术
7.6.1 公司简介
7.6.2 经营情况
7.6.3 机器视觉业务
7.7 慈星股份
7.7.1 公司简介
7.7.2 经营情况
7.7.3 机器视觉业务
7.8 深科达
7.8.1 公司简介
7.8.2 经营情况
7.8.3 机器视觉业务
7.9 奥普特
7.9.1 公司简介
7.9.2 机器视觉业务
7.10 其他企业
7.10.1 上海铂美
7.10.2 奥普光电
7.10.3 上海锡明科技
第八章 总结与预测
8.1 市场
8.2 企业
1 Overview of Machine Vision Industry
1.1 Definition and Classification
1.2 Main Functions and Features
1.3 Industry Chain
2 Global Machine Vision Market
2.1 Development Environment
2.2 Market Situation
2.2.1 Market Size and Structure
2.2.2 USA
2.2.3 Japan
2.2.4 Germany
2.2.5 UK
2.3 Patents and Distribution
2.4 Competitive Pattern
3 Chinese Machine Vision Market
3.1 Development Environment
3.2 Market Situation
3.2.1 Market Size
3.2.2 Market Structure
3.3 Patents
3.4 Cost Structure
3.5 Competitive Pattern
3.5.1 Regional
3.5.2 Corporate
3.6 Development Trend
4 Machine Vision Component market
4.1 Light Source
4.1.1 Overview
4.1.2 LED Light Source
4.2 Lens
4.3 Industrial Camera
4.3.1 Market Overview
4.3.2 CMOS Image Sensor
4.3.3 CMOS Camera Module
4.4 Frame Grabber
4.5 Image Processing Software
4.6 System Integration
5 Machine Vision Application Market
5.1 Semiconductor and Electronic Manufacturing
5.1.1 Application of Machine Vision
5.1.2 Semiconductor
5.1.3 PCB
5.2 Automobile
5.2.1 Application of Machine Vision
5.2.2 Status Quo of Automobile Industry
5.3 Pharmaceuticals
5.3.1 Application of Machine Vision
5.3.2 Pharmaceutical Industry
5.4 Food and Packaging Machinery
5.4.1 Application of Machine Vision
5.4.2 Status Quo of Food and Packaging Machinery Industry
6 Main Foreign Machine Vision System Vendors
6.1 Keyence
6.1.1 Profile
6.1.2 Operation
6.1.3 Machine Vision Business
6.1.4 Layout in China
6.2 Cognex
6.2.1 Profile
6.2.2 Operation
6.2.3 Machine Vision Business
6.3 Omron
6.3.1 Profile
6.3.2 Operation
6.3.3 Machine Vision Business
6.3.4 Layout in China
6.4 Panasonic
6.4.1 Profile
6.4.2 Operation
6.4.3 Machine Vision Business
6.4.4 Layout in China
6.5 NI
6.5.1 Profile
6.5.2 Operation
6.5.3 Machine Vision Business
6.5.4 Layout in China
6.6 Others
6.6.1 Banner
6.6.2 DALSA
6.6.3 Baumer
7 Main Chinese Machine Vision Vendors
7.1 Hi-Tech Control System
7.1.1 Profile
7.1.2 Operation
7.1.3 Machine Vision Business
7.2 Daheng New Epoch Technology
7.2.1 Profile
7.2.2 Operation
7.2.3 Machine Vision Business
7.3 Hunan China Sun Pharmaceutical Machinery
7.3.1 Profile
7.3.2 Operation
7.3.3 Machine Vision Business
7.4 JT Automation Equipment
7.4.1 Profile
7.4.2 Operation
7.4.3 Machine Vision Business
7.5 Maxonic Automation Control
7.5.1 Profile
7.5.2 Operation
7.5.3 Machine Vision Business
7.6 Inovance Technology
7.6.1 Profile
7.6.2 Operation
7.6.3 Machine Vision Business
7.7 Ningbo Cixing
7.7.1 Profile
7.7.2 Operation
7.7.3 Machine Vision Business
7.8 Sking Intelligent Equipment
7.8.1 Profile
7.8.2 Operation
7.8.3 Machine Vision Business
7.9 OPT Machine Vision
7.9.1 Profile
7.9.2 Machine Vision Business
7.10 Others
7.10.1 Shanghai BMT Automation
7.10.2 Changchun UPOptotech (Holding)
7.10.3 Shanghai Ximing Vision Technology
8 Summary and Forecast
8.1 Market
8.2 Enterprises
图:PC式机器视觉系统示意图
表:嵌入式机器视觉系统与PC式机器视觉系统优劣对比
图:机器视觉主要应用形式
表:机器视觉与人工视觉的对比
图:机器视觉产业链
图:机器视觉发展周期
图:全球机器视觉发展历程
图:2008-2020年全球工业机器人销量
表:2013-2018年世界工业机器人(分地区/国家)销量
图:2008-2020年全球机器视觉市场规模及增速
图:2014-2020年全球机器视觉(分地区)市场结构
图:2011-2020年美国机器视觉市场规模及增速
图:2011-2014年美国主要机器视觉产品市场规模
图:2001-2014年美国机器视觉市场结构
图:2011-2020年日本机器视觉市场规模及增速
图:2011-2020年的德国机器视觉市场规模及增速
图:2011-2020年的英国机器视觉市场规模及增速
图:2006-2015年全球机器视觉新增专利数量及增速
图:2015年全球机器视觉专利分布
表:全球主要机器视觉厂商产品应用现状
表:全球机器视觉主要竞争企业
表:中国机器视觉产业相关政策
图:2007-2016年中国机器视觉企业数量
图:2008-2020年中国机器视觉市场规模及增速
图:2015/2020E年中国机器视觉应用结构
图:2006-2015年中国机器视觉专利总量及增速
图:2015年中国机器视觉专利分布
图:中国机器视觉成本结构
图:2015年中国机器视觉企业分布
表:中国市场上主要的机器视觉厂商
表:中国主要上市公司机器视觉业务布局
表:机器视觉主要组件及制造商
表:三种光源性能对比
图:2012-2018年全球LED工业照明市场规模
表:镜头对机器视觉系统的影响
图:机器视觉工业镜头
表:主要机器视觉用镜头对比
表:2014-2015年全球镜头厂商出货量排名
表:主要机器视觉用工业相机
表:主要机器视觉用工业相机对比
图:2011-2020年全球工业相机出货量
图:2004-2019年全球CMOS图像传感器销售额及出货量
图:2014年全球CMOS图像传感器应用格局
图:2014年全球CMOS图像传感器市场竞争格局
表:2010-2017年全球CMOS相机模组市场规模
表:2010-2015全球CCM厂家收入排名
表:图像采集卡分类
图:图像采集卡采集流程
图:2011-2018年全球工业软件市场规模及增速
图:2012-2018年中国工业软件市场规模及增速
图:2015年全球工业软件市场结构
表:全球主要视觉软件制造商及产品
图:机器视觉不同处理方式
表:智能相机与PC式机器视觉系统的对比
图:智能相机开发成本与时间的关系
表:中国主要机器视觉系统集成商
表:机器视觉主要应用领域
图:2013-2020年中国半导体及电子制造产业机器视觉消费额
表:2013-2014年全球主要AOI厂商及其AOI业务收入(USD mln)
图:2008-2020年全球半导体市场规模及增速
图:2013-2020年全球半导体出货量及增速
图:2014-2017年全球半导体(分地区)市场规模
图:2014-2017年全球半导体(分领域)市场规模
图:2014-2017年全球集成电路用半导体(细分市场)市场规模
图:2015年全球半导体市场竞争格局
图:2008-2020年中国半导体市场销售额及增速
图:2008-2020年中国半导体需求规模及增速
图:2008-2015年中国半导体市场进出口
表:2015年中国半导体企业主要收购案
图:2010-2016年台湾半导体产业的比重
表:2015年台湾半导体产业链产值及全球占比
图:2011-2018年全球PCB产值及同比增长(USD bn)
图:2012-2018年全球PCB细分市场产值
图:2010-2019年全球PCB产值构成(分区域)
图:2010-2019年中国大陆PCB产值及同比增长(USD bn)
表:中国PCB产业分布
图:2006-2015年中国PCB专利总数
图:2015年中国PCB专利申请数量结构
图:2014年全球PCB市场竞争格局
表:2014年中国主要PCB生产商产能及收入
表:机器视觉在汽车上的应用
图:用于汽车制造的视觉解决方案
图:2013-2020年中国汽车产业机器视觉消费额
图:2005-2016年全球乘用车销量
图:2005-2016年全球商用车销量
图:2015年全球主要国家汽车销量
图:2011-2016年中国汽车销量变化
图:2014-2016年中国汽车经销商库存预警指数
图:2015年中国乘用车(分国别)销量构成
图:2015年中国汽车市场竞争格局
图:机器视觉在制药上的应用
图:2013-2020年中国制药产业机器视觉消费额
图:2011-2015年全球主要国家医药产业年均复合增长率
图:2014-2020年中国医药行业产值及同比增长
表:机器视觉在食品与包装机械上的应用
图:2013-2020年中国食品与包装机械产业机器视觉消费额
图:2007-2016年全球包装行业产值及增速
图:2015年全球包装产业结构
图:基恩士主要业务
图:基恩士全球布局
图:2001-2015财年基恩士销售收入及利润
表:2014-2015财年基恩士(分地区)销售收入
图:基恩士主要机器视觉产品
图:基恩士在华布局
图:康耐视产品线
图:2010-2015年康耐视营业收入及利润
图:2014-2015年康耐视(分业务)营业收入构成
图:2012-2015年康耐视(分地区)营业收入构成
表:康耐视机器视觉业务发展历程
图:欧姆龙全球布局
图:2008-2015财年欧姆龙营业收入及净利润
图:2010-2015财年欧姆龙(分业务)营业收入构成
图:2012-2015财年欧姆龙(分地区)营业收入构成
表:2014-2015财年欧姆龙IAB业务营收情况
图:欧姆龙在华投资企业分布
图:2010-2015财年欧姆龙在大中华区销售额及增速
图:2011-2015年松下员工数量
图:2008-2016财年松下营业收入及净利润
图:2016-2019财年松下经营目标
图:2013-2016财年松下(分业务)营业收入构成
图:2010-2016财年松下(分地区)营业收入
图:松下AVC Networks业务细分
图:2014-2015财年松下AVC Networks业务经营情况
图:2015财年松下AVC Networks细分业务经营情况
图:2019财年松下AVC Networks业务经营目标
图:2010-2016财年松下在华销售额及增速
图:NI发展历程
图:2008-2015年NI员工数量及增速
图:2008-2015年NI营业收入及净利润
图:2014-2015年NI(分业务)营业收入构成
图:2008-2014年NI(分地区)营业收入构成
表:NI主要机器视觉产品
表:NI主要智能相机产品对比
表:NI主要智能相机产品特性
图:NI在华主要合作伙伴
图:邦纳全球布局
表:达尔萨主要机器视觉产品
表:邦纳在华主要发展历程
表:达尔萨主要机器视觉产品
表:堡盟主要机器视觉产品
图:2015年海得控制股权结构
图:海得控制中国区域布局
图:2009-2015年海得控制营业收入及净利润
图:2007-2014年海得控制研发投入及增速
图:2013-2015年海得控制(分业务)营业收入构成
图:海得控制工业智能化解决方案相关技术及产品
图:2015年大恒科技股权结构
图:2010-2015年大恒科技营业收入及毛利率
图:2013-2015年大恒科技(分产品)营业收入构成
表:2014年大恒科技(分产品)产销量
图:2010-2015年大恒科技(分地区)营业收入构成
图:2013-2015年大恒科技视觉检测系统营业收入及利润率
图:2015年大恒科技视机器视觉应用结构
表:大恒科技主要机器视觉产品
图:2015年千山药机股权结构
图:千山药机全球布局
图:2009-2015年千山药机营业收入及净利润
图:2014年千山药机(分产品)营业收入构成
图:2014年千山药机(分地区)营业收入构成
表:千山药机主要机器视觉产品
图:千山药机主要客户
图:2015年劲拓股份股权结构
图:劲拓股份全球布局
图:2010-2015年劲拓股份营业收入及净利润
图:2014/2017年劲拓股份(分产品)营业收入构成
表:2015年劲拓股份主要机器视觉研发项目
图:2011-2017年劲拓股份AOI设备销量及增速
图:2011-2015年劲拓股份AOI设备均价及毛利率
图:2015年万讯自控股权结构
图:2010-2015年万讯自控营业收入及利润
图:2012-2015年万讯自控(分产品)营业收入构成
图:2013-2015年万讯自控(分地区)营业收入构成
图:2015年汇川技术股权结构
图:2010-2015年汇川技术营业收入及净利润
图:2013-2014年汇川技术(分产品)营业收入构成
图:2013-2014年汇川技术(分地区)营业收入构成
表:汇川技术机器视觉应用
图:2015年慈星股份股权结构
图:2010-2015年慈星股份营业收入及净利润
图:2014年慈星股份(分产品)营业收入构成
图:2013-2014年慈星股份(分地区)营业收入构成
表:苏州鼎纳主要机器视觉产品
图:2015年深科达股权结构
图:2013-2015年深科达营业收入及净利润
表:2013-2014年深科达(分产品)营业收入及占比
表:2014年深科达主要客户
表:2014年深科达主要供应商
图:奥普特发展历程
图:奥普特全球布局
图:奥普特机器视觉产品
图:奥普特机器视觉产品研发中心
图:2008-2020年全球及中国机器视觉市场增速
图:2007-2015年全球及中国机器视觉专利增长速度
图:2013-2020年中国机器视觉主要市场应用情况
图:2010-2015年全球主要机器视觉制造商营收增速
图:2015年全球机器视觉市场竞争格局
Schematic Diagram of PC-based Vision System
Merits and Demerits of Embedded Vision System and PC-based Vision System
Main Application Forms of Machine Vision
Comparison between Machine Vision and Artificial Vision
Machine Vision Industry Chain
Development Cycle of Machine Vision
Development History of Machine Vision Worldwide
Sales Volume of Industrial Robots Worldwide, 2008-2020
Sales Volume of Industrial Robots (by Country/Region) Worldwide, 2013-2018
Global Machine Vision Market Size and Growth Rate, 2008-2020
Global Machine Vision Market Structure (by Region), 2014-2020
Machine Vision Market Size and Growth Rate in the United States, 2011-2020
Market Size of Key Machine Vision Products in the United States, 2011-2014
Machine Vision Market Structure in the United States, 2001-2014
Machine Vision Market Size and Growth Rate in Japan, 2011-2020
Machine Vision Market Size and Growth Rate in Germany, 2011-2020
Machine Vision Market Size and Growth Rate in UK, 2011-2020
New Patents for Machine Vision and Growth Rate Worldwide, 2006-2015
Distribution of Patents for Machine Vision Worldwide, 2015
Product Application of Major Machine Vision Vendors Worldwide
Major Competitors in World’s Machine Vision Market
China’s Policies on Machine Vision Industry
Number of Machine Vision Vendors in China, 2007-2016
Machine Vision Market Size and Growth Rate in China, 2008-2020
Structure of Machine Vision Application In China, 2015/2020E
Total Number of Patents for Machine Vision and Growth Rate in China, 2006-2015
Distribution of Machine Vision Patents in China, 2015
Cost Structure of Machine Vision in China
Distribution of Machine Vision Vendors in China, 2015
Leading Machine Vision Vendors in Chinese Market
Machine Vision Business Layout of Major Listed Companies in China
Key Components of Machine Vision and Major Producers
Performance Comparison of Three Types of Light Sources
LED Industrial Lighting Market Size Worldwide, 2012-2018E
Impact of Lens on Machine Vision System
Industrial Lens for Machine Vision
Comparison of Key Lens for Machine Vision
Ranking of Lens Manufacturers by Shipment Worldwide, 2014-2015
Key Industrial Cameras for Machine Vision
Comparison of Key Industrial Cameras for Machine Vision
Global Shipment of Industrial Cameras, 2011-2020
CMOS Image Sensor Sales and Shipment Worldwide, 2004-2019
CMOS Image Sensor Application Patten Worldwide, 2014
Competitive Landscape of World’s CMOS Image Sensor Market, 2014
Global CMOS Camera Module (CCM) Market Size, 2010-2017E
Ranking of World’s CCM Vendors by Revenue, 2010-2015
Classification of Frame Grabbers
Acquisition Flow of Frame Grabber
Global Industrial Software Market Size and Growth Rate, 2011-2018E
China’s Industrial Software Market Size and Growth Rate, 2012-2018E
Global Industrial Software Market Structure, 2015
World’s Major Vision Software Makers and Products
Diverse Processing Modes of Machine Vision
Comparison between Smart Camera and PC-based Vision System
Relation of Smart Camera Development Costs to Time
Key Machine Vision System Integrators in China
Major Applications of Machine Vision
Consumption of Machine Vision in Semiconductor and Electronic Manufacturing in China, 2013-2020
Major AOI Vendors and AOI Business Revenue Worldwide, 2013-2014
Global Semiconductor Market Size and Growth Rate, 2008-2020
Global Semiconductor Shipment and Growth Rate, 2013-2020E
Global Semiconductor Market Size (by Region), 2014-2017
Global Semiconductor Market Size (by Field), 2014-2017
Global IC Semiconductor (Market Segments) Market Size, 2014-2017
Competitive Landscape of Global Semiconductor Market, 2015
Sales and Growth Rate of Chinese Semiconductor Market, 2008-2020
China’s Demand for Semiconductor and Growth Rate, 2008-2020
Imports and Exports in Chinese Semiconductor Market, 2008-2015
Main Acquisition Cases of Chinese Semiconductor Companies, 2015
Proportion of Taiwan’s Semiconductor Industry, 2010-2016
Output Value of Taiwan’s Semiconductor Industry Chain and % of Global Total, 2015
Global PCB Output Value and YoY Growth, 2011-2018
Output Value of Global PCB Market Segments, 2012-2018E
Global PCB Output Value Structure (by Region), 2010-2019
PCB Output Value and YoY Growth in Chinese Mainland, 2010-2019E
Distribution of PCB Industry in China
Total Number of PCB Patents in China, 2006-2015
Structure of PCB Patent Applications in China, 2015
Competitive Landscape of Global PCB Market, 2014
Capacity and Revenue of Major PCB Vendors in China, 2014
Application of Machine Vision in Automobile
Vision Solutions for Automobile Manufacturing
Consumption of Machine Vision in China’s Automobile Industry, 2013-2020
Sales Volume of Passenger Cars Worldwide, 2005-2016
Sales Volume of Commercial Vehicles Worldwide, 2005-2016
Automobile Sales in Major Countries Worldwide, 2015
Automobile Sales in China, 2011-2016
VIA (Vehicle Inventory Alert Index) of Car Dealers in China, 2014-2016
Sales Structure of Passenger Cars (by Country) in China, 2015
Competitive Landscape of Chinese Automobile Market, 2015
Application of Machine Vision in Pharmaceuticals
Consumption of Machine Vision in China’s Pharmaceutical Industry, 2013-2020E
CAGRs of Pharmaceuticals Industry in Major Countries Worldwide, 2011-2015
Output Value and YoY Growth of Chinese Pharmaceutical Industry, 2014-2020E
Application of Machine Vision in Food and Packaging Machinery
Consumption of Machine Vision in Food and Packaging Machinery in China
Output Value and Growth Rate of Global Packaging Industry, 2007-2016
Structure of Global Packaging Industry, 2015
Main Business of Keyence
Global Presence of Keyence
Revenue and Profit of Keyence, FY2001- FY2015
Revenue of Keyence (by Region), FY2014- FY2015
Main Machine Vision Products of Keyence
Layout of Keyence in China
Product Lines of Cognex
Revenue and Profit of Cognex, 2010-2015
Revenue Structure of Cognex (by Business), 2014-2015
Revenue Structure of Cognex (by Region), 2012-2015
Machine Vision Business Development Course of Cognex
Global Presenceof Omron
Revenue and Net Income of Omron, FY2008- FY2015
Revenue Structure of Omron (by Business), FY2010- FY2015
Revenue Structure of Omron (by Region), FY2012- FY2015
IAB Revenue of Omron, FY2014- FY2015
Distribution of Companies Invested by Omron in China
Sales and Growth Rate of Omron in Greater China, FY2010- FY2015
Employees of Panasonic, 2011- 2015
Revenue and Net Income of Panasonic, FY2008- FY2016
Business Goals of Panasonic, FY 2016- FY 2019
Revenue Structure of Panasonic (by Business), FY2013- FY2016
Revenue Breakdown of Panasonic (by Region), FY2010- FY2016
Business Segments of Panasonic's AVC Networks
Operation of Panasonic AVC Networks, FY2014- FY2015
Operation of Panasonic's AVC Networks Business Segments, FY2015
Business Goals of Panasonic's AVC Networks, FY 2019
Sales and Growth Rate of Panasonic in China, FY2010- FY2016
Development Course of NI
Employees and Growth Rate of NI, 2008-2015
Revenue and Net Income of NI, 2008-2015
Revenue Structure of NI (by Business), 2014-2015
Revenue Structure of NI (by Region), 2008-2014
Main Machine Vision Products of NI
Comparison between Main Smart Cameras of NI
Features of Main Smart Cameras of NI
Key Partners of NI in China
Global Presenceof Banner
Main Machine Vision Products of DALSA
Development Course of Banner in China
Main Machine Vision Products of DALSA
Main Machine Vision Products of Baumer
Equity Structure of Hi-Tech Control System, 2015
Layout of Hi-Tech Control System in China
Revenue and Net Income of Hi-Tech Control System, 2009-2015
R & D Investment and Growth Rate of Hi-Tech Control System, 2007-2014
Revenue Structure of Hi-Tech Control System (by Business), 2013-2015
Industrial Intelligent Solution-related Technologies and Products of Hi-Tech Control System
Equity Structure of Daheng New Epoch Technology, 2015
Revenue and Gross Margin of Daheng New Epoch Technology, 2010-2015
Revenue Structure of Daheng New Epoch Technology (by Product), 2013-2015
Output and Sales Volume of Daheng New Epoch Technology (by Product), 2014
Revenue Structure of Daheng New Epoch Technology (by Region), 2010-2015
Vision Inspection System Revenue and Profit Margin of Daheng New Epoch Technology, 2013-2015
Machine Vision Application Structure of Daheng New Epoch Technology, 2015
Main Machine Vision Products of Daheng New Epoch Technology
Equity Structure of Hunan China Sun Pharmaceutical Machinery, 2015
Global Presenceof Hunan China Sun Pharmaceutical Machinery
Revenue and Net Income of Hunan China Sun Pharmaceutical Machinery, 2009-2015
Revenue Structure of Hunan China Sun Pharmaceutical Machinery (by Product), 2014
Revenue Structure of Hunan China Sun Pharmaceutical Machinery (by Region), 2014
Main Machine Vision Products of Hunan China Sun Pharmaceutical Machinery
Major Customers of Hunan China Sun Pharmaceutical Machinery
Equity Structure of JT Automation Equipment, 2015
Global Presenceof JT Automation Equipment
Revenue and Net Income of JT Automation Equipment, 2010-2015
Revenue Structure of JT Automation Equipment (by Product), 2014/2017
Main Machine Vision R & D Projects of JT Automation Equipment, 2015
AOI Equipment Sales Volume and Growth Rate of JT Automation Equipment, 2011-2017E
AOI Equipment Average Price and Gross Margin of JT Automation Equipment, 2011-2015
Equity Structure of Maxonic Automation Control, 2015
Revenue and Profit of Maxonic Automation Control, 2010-2015
Revenue Structure of Maxonic Automation Control (by Product), 2012-2015
Revenue Structure of Maxonic Automation Control (by Region), 2013-2015
Equity Structure of Inovance Technology, 2015
Revenue and Net Income of Inovance Technology, 2010-2015
Revenue Structure of Inovance Technology (by Product), 2013-2014
Revenue Structure of Inovance Technology (by Region), 2013-2014
Machine Vision Applications of Inovance Technology
Equity Structure of Ningbo Cixing, 2015
Revenue and Net Income of Ningbo Cixing, 2010-2015
Revenue Structure of Ningbo Cixing (by Product), 2014
Revenue Structure of Ningbo Cixing (by Region), 2013-2014
Main Machine Vision Products of Suzhou Dinnar
Equity Structure of Sking Intelligent Equipment, 2015
Revenue and Net Income of Sking Intelligent Equipment, 2013-2015
Revenue Structure of Sking Intelligent Equipment (by Product), 2013-2014
Major Customers of Sking Intelligent Equipment, 2014
Major Suppliers of Sking Intelligent Equipment, 2014
Development Course of OPT Machine Vision
Global Presence of OPT Machine Vision
Machine Vision Products of OPT Machine Vision
Machine Vision R & D Center of OPT Machine Vision
Growth Rate of Global and Chinese Machine Vision Market, 2008-2020E
Growth Rate of Global and Chinese Machine Vision Patents, 2007-2015
Main Applications in Chinese Machine Vision Market, 2013-2020E
Revenue Growth Rate of Major Global Machine Vision Vendors, 2010-2015
Competitive Landscape of Global Machine Vision Market, 2015
如果这份报告不能满足您的要求,我们还可以为您定制报告,请 留言说明您的详细需求。
|