|
|
|
报告导航:研究报告—
制造业—工业机械
|
|
2016-2020年全球及中国风力发电机行业研究报告 |
 |
字数:5.8万 |
页数:150 |
图表数:162 |
|
中文电子版:9000元 |
中文纸版:4500元 |
中文(电子+纸)版:9500元 |
|
英文电子版:2450美元 |
英文纸版:2600美元 |
英文(电子+纸)版:2750美元 |
|
编号:BXM092
|
发布日期:2016-07 |
附件:下载 |
 |
|
|
2015年,全球风电新增装机容量63.01GW,同比上升22.41%;再次刷新风电新增装机容量记录。中国继续引领全球风电市场,2015年新增装机容量30.75GW,连续六年位居全球首位。
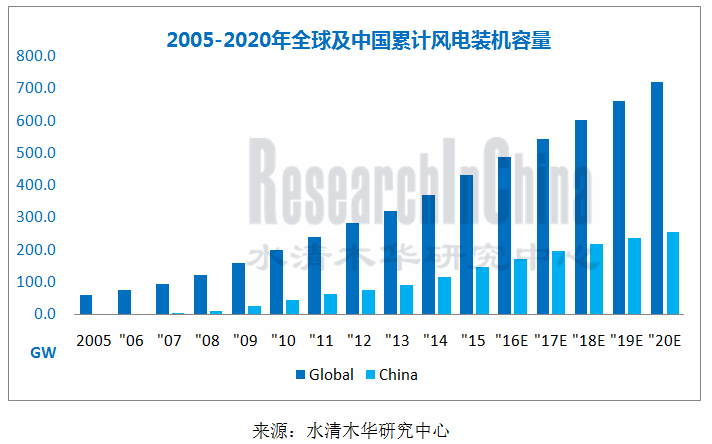
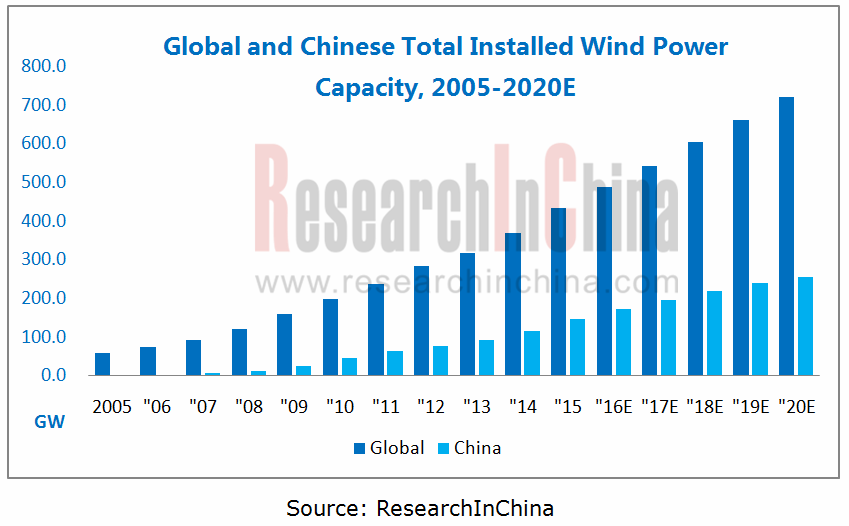
“十三五”期间,风电市场将继续向好,预计到2020年全球累计风电装机容量将超过700GW,其中中国将达到250GW左右。
风电大型化是近年风电技术发展趋势。2000年以来,中国新增风力发电单机功率呈逐年上升态势, 2015年达到1837kW,是2000年的3倍多。2015年中国新增风电装机中,1.5MW和2MW机组占主导地位,市场份额合计为84%,其中2MW机组份额首次超过1.5MW机组,占到50%的比重。
海上风电发展稳定,未来有望提速。2015年中国海上风电新增并网容量为360.5MW,占到全球总量的10.7%。根据规划,到2020年中国海上风电累计并网装机容量要达到30GW,而2015年累计实际装机数仅为1GW,鉴于此,未来海上风电建设速度将大幅提升。
为解决弃风问题,分布式风力发电成将为未来首选。目前中国“三北”(西北、东北和华北)地区大规模风电开发已出现阶段性饱和,弃风问题日趋严重。2015年中国弃风量达到5年最高,为339亿千瓦时,平均弃风率为15%。为了改善这一状况,国家提出“十三五”期间优先发展分散式风电,根据规划,到2020年分布式风电装机将达到25GW,2050年达到70GW。
水清木华研究中心《2016-2020年全球及中国风力发电机行业研究报告》重点研究了以下内容:
 全球风能资源、风力发电机装机容量及结构、主要国家风机发展情况、企业竞争格局等; 全球风能资源、风力发电机装机容量及结构、主要国家风机发展情况、企业竞争格局等;
中国风力发电机装机容量及结构、海上风电、出口情况、企业竞争格局等;
风力发电机主要零部件(含叶片、齿轮箱、塔架、变流器、发电机、轴承)市场现状及重点企业经营情况等;
中国风力资源、风电开发模式、建设成果、主要开发商等;
全球5家、中国10家重点风机企业经营、研发情况等。
2015年,金风科技凭借7.8GW的全球新增装机,一跃成为全球最大风电整机制造商。Vestas、GE、西门子、Gamesa分列二到五位。2016年6月,西门子公告称与Gamesa已签订约束性协议,合并双方的风电业务(包括西门子风电服务业务)。受此影响,2016年全球风机市场格局将发生变化。
除金风科技外,2015年中国新增风机装机容量超过1MW的企业还有8家,依次为联合动力、远景能源、明阳风电、重庆海装、上海电气、湘电风能、东方风电、运达风电。
此外,中国风机零部件企业也形成良好的配套能力。
风电叶片方面:中国已具备了1.5兆瓦风电叶片自主研发、生产能力,并逐步提升到3兆瓦、5兆瓦甚至更大;代表企业有中航惠腾、上海玻璃钢研究院、中复连众、中材科技等。风电齿轮箱方面:南高齿已经成为中国乃至全球龙头,在华份额为60%,全球为23%。风电变流器方面:ABB、科孚德、艾默生等外资品牌处于主导地位,阳光电源、禾望电气、海得控制等本土企业正不断崛起。
In 2015, global new installed wind power capacity reached 63.01GW, up 22.41% YoY, refreshing new installed wind power capacity records again. China continues to lead the global wind power market with new installed capacity of 30.75GW in 2015 and the first worldwide ranking for six consecutive years.
The wind power market will continue to be buoyant during the 13th Five-Year Plan period (2016-2020). The global total installed wind power capacity is expected to surpass 700GW by 2020, of which, China will reach around 250GW.
Large-scale wind power is the development trend of wind power technology in recent years. China’s new per-unit power of wind turbine has been on the rise since 2000, hitting 1,837kW in 2015, more than three times as much as that in 2000. Concerning China’s new installed wind power capacity in 2015, 1.5MW and 2MW wind turbines were predominant with a combined 84% share, of which, 2MW wind turbine outperformed 1.5MW wind turbine for the first time and accounted for 50%.
Development of offshore wind power growing at a steady pace is expected to accelerate in the future. In 2015, China’s new grid-connected capacity of offshore wind power was recorded at 360.5MW, occupying 10.7% of the global total. China’s total installed grid-connected capacity of offshore wind power is planned to hit 30GW by 2020, while the cumulative actual installed capacity was merely 1GW in 2015. Given this, the offshore wind power construction will be greatly sped up.
To solve the wind turbine suspension problem, distributed wind power generation will be the first choice in the future. There has been a phased saturation for large-scale wind power development in Northwest, Northeast and North China, where the wind turbine suspension problem is increasingly severe. In 2015, wind turbine suspension volume reached a peak i.e. 33.9 billion kWh in five years, registering an average suspension rate of 15%. To improve the situation, the government has proposed the priority development of distributed wind power during the 13th Five-Year Plan period. According to the plan, the installed distributed wind power capacity will be 25GW by 2020 and 70GW by 2050.
The report covers the followings:
 Global wind energy resources, installed wind power capacity and structure, wind power development in major countries, corporate competition, etc.; Global wind energy resources, installed wind power capacity and structure, wind power development in major countries, corporate competition, etc.;
China’s installed wind power capacity and structure, offshore wind power, exports, corporate competition, etc.;
Market status of wind turbine parts (e.g. blade, gearbox, tower, converter, generator, bearing) as well as operation of key players;
Wind energy resources, wind power development mode, construction achievements, main developers, etc.;
Operation, R&D, etc. of 5 global and 10 Chinese wind turbine companies.
With global new installed capacity of 7.8GW, Goldwind Science & Technology Co., Ltd. became the world’s largest wind turbine manufacturer in 2015, followed successively by Vestas, GE, Siemens and Gamesa. In June 2016, Siemens announced the signing of a binding agreement with Gamesa on merging wind power business of both sides (including Siemens Wind Power Services). Affected by this, the global wind turbine market structure will be changed in 2016.
In addition to Goldwind Science & Technology, there were 8 Chinese players reporting new installed wind power capacity of over 1MW in 2015, namely United Power, Envision Energy, Mingyang Wind Power, CSIC (Chongqing) HaizhuangWindpower Equipment, Shanghai Electric, XEMC Windpower, DongfangElectric Corporation and Zhejiang Windey, in succession.
Furthermore, wind-turbine parts companies in China have good supply capability.
In terms of wind power blade, China has possessed the 1.5MW wind blade R&D and production capacity, which will increase gradually to 3MW, 5MW and even more; representative firms include AVIC HuitengWindpower Equipment Co., Ltd., Shanghai FRP Research Institute Co., Ltd., Lianyungang ZhongfuLianzhong Composites Group Co., Ltd. and Sinoma Science & Technology Co.,Ltd. With respect to wind power gearbox, Nanjing High Accurate Drive Equipment Manufacturing Group Co., Ltd. (NGC) as a leader in China and even in the world registers a share of 60% domestically and 23% globally. In the aspect of wind power converter, foreign brands like ABB, Converteam and Emerson take the leading position; however, Sungrow Power Supply, Hopewind Electric, Shanghai Hi-tech Control System Co., Ltd. (HITE) and other local firms are rising.
第一章 风力发电机简介
1.1 定义
1.2 分类
1.3 产业链
第二章 全球风力发电机产业
2.1风能资源及利用
2.1.1 资源分布
2.1.2 投资建设
2.1.3 风力发电
2.2风电装机容量
2.2.1 总装机容量
2.2.2 主要地区
2.2.3 海上风电
2.3 主要国家
2.3.1 德国
2.3.2 西班牙
2.3.3 美国
2.3.4丹麦
2.3.5 英国
2.4 竞争格局
第三章 中国风力发电机产业
3.1 主要政策
3.2 装机容量及构成
3.2.1 总装机容量
3.2.2 分地区
3.2.3 分功率
3.2.4海上风电
3.3 出口情况
3.4竞争格局
第四章 主要风力发电风机零部件
4.1叶片
4.1.1全球市场供需
4.1.2中国市场供需
4.1.3技术现状
4.1.4主要厂商
4.2 齿轮箱
4.2.1 概述
4.2.2 市场供需
4.2.3 主要厂商
4.3 塔架(筒)
4.3.1 市场规模
4.3.2 主要厂商
4.4 发电机
4.4.1 市场综述
4.4.2 主要厂商
4.5 风电变流器
4.5.1 概述
4.5.2 市场供需
4.5.3 主要厂商
4.6 轴承
4.6.1 市场供需
4.6.2 主要厂商
第五章 风电场开发与建设
5.1 风能资源及利用
5.1.1 资源分布
5.1.2 风电上网电量
5.1.3风电上网电价
5.2 风电开发与建设
5.2.1 风电开发模式
5.2.2 开发建设成果
5.2.3 2016年开发建设方案
5.3 风电开发商
第六章 全球风机厂商
6.1 Vestas(维斯塔斯)
6.1.1 企业简介
6.1.2 经营情况
6.1.3 在华风电业务
6.2 GE
6.2.1 企业简介
6.2.2 经营情况
6.2.3 在华风电业务
6.3 Siemens
6.3.1 企业简介
6.3.2 经营情况
6.3.3 在华风电业务
6.4 Gamesa
6.4.1 企业简介
6.4.2 经营情况
6.4.3 在华风电业务
6.5 Enercon
6.5.1 企业简介
6.5.2 经营情况
第七章 中国风机厂商
7.1 金风科技
7.1.1 企业简介
7.1.2 经营情况
7.2 华锐风电
7.2.1 企业简介
7.2.2 经营情况
7.3 联合动力
7.3.1 企业简介
7.3.2 经营情况
7.4 东方电气
7.4.1 企业简介
7.4.2 经营情况
7.5 明阳风电
7.5.1 企业简介
7.5.2 经营情况
7.6 上海电气
7.6.1 企业简介
7.6.2 经营情况
7.7湘电风能
7.7.1 企业简介
7.7.2 经营情况
7.8 远景能源
7.8.1 企业简介
7.8.2 经营情况
7.9 重庆海装风电
7.9.1 企业简介
7.9.2 经营情况
7.10 运达风电
7.10.1 企业简介
7.10.2 经营情况
第八章 总结与预测
8.1 市场
8.1.1 全球
8.1.2 中国
8.2 企业
8.2.1 全球
8.2.2 中国
1 Introduction to Wind Turbine
1.1 Definition
1.2 Classification
1.3 Industry Chain
2 Global Wind Turbine Industry
2.1 Wind Energy Resources and Utilization
2.1.1 Resource Distribution
2.1.2 Investment and Construction
2.1.3 Wind Power Generation
2.2 Installed Wind Power Capacity
2.2.1 Total Installed Capacity
2.2.2 Major Regions
2.2.3 Offshore Wind Power
2.3 Major Countries
2.3.1 Germany
2.3.2 Spain
2.3.3 USA
2.3.4 Denmark
2.3.5 UK
2.4 Competition Pattern
3 Chinese Wind Turbine Industry
3.1 Main Policies
3.2 Installed Capacity and Structure
3.2.1 Total Installed Capacity
3.2.2 By Region
3.2.3 By Power
3.2.4 Offshore Wind Power
3.3 Export
3.4 Competition Pattern
4 Main Parts of Wind Turbine
4.1 Blade
4.1.1 Global Market Supply and Demand
4.1.2 Chinese Market Supply and Demand
4.1.3 Technology Status
4.1.4Key Players
4.2 Gearbox
4.2.1 Overview
4.2.2 Market Supply and Demand
4.2.3 Key Players
4.3 Tower
4.3.1 Market Scale
4.3.2 Key Players
4.4 Generator
4.4.1 Market Overview
4.4.2 Key Players
4.5 Wind Power Converter
4.5.1 Overview
4.5.2 Market Supply and Demand
4.5.3 Key Players
4.6 Bearing
4.6.1 Market Supply and Demand
4.6.2 Key Players
5 Development and Construction of Wind Farms
5.1 Wind Energy Resources and Utilization
5.1.1 Resource Distribution
5.1.2 Wind Power Feed-in Metering
5.1.3Wind Power Feed-in Tariff
5.2 Wind Power Development and Construction
5.2.1 Wind Power Development Mode
5.2.2 Development and Construction Achievements
5.2.3 Development and Construction Scheme 2016
5.3 Wind Power Developers
6 Global Wind Turbine Companies
6.1 Vestas
6.1.1 Profile
6.1.2 Operation
6.1.3 Wind Power Business in China
6.2 GE
6.2.1 Profile
6.2.2 Operation
6.2.3 Wind Power Business in China
6.3 Siemens
6.3.1 Profile
6.3.2 Operation
6.3.3 Wind Power Business in China
6.4 Gamesa
6.4.1 Profile
6.4.2 Operation
6.4.3 Wind Power Business in China
6.5 Enercon
6.5.1 Profile
6.5.2 Operation
7 Chinese Wind Turbine Companies
7.1 Goldwind Science & Technology
7.1.1 Profile
7.1.2 Operation
7.2 Sinovel Wind Group
7.2.1 Profile
7.2.2 Operation
7.3 United Power
7.3.1 Profile
7.3.2 Operation
7.4 Dongfang Electric Corporation
7.4.1 Profile
7.4.2 Operation
7.5 Mingyang Wind Power
7.5.1 Profile
7.5.2 Operation
7.6 Shanghai Electric
7.6.1 Profile
7.6.2 Operation
7.7 XEMC Windpower
7.7.1 Profile
7.7.2 Operation
7.8 Envision Energy
7.8.1 Profile
7.8.2 Operation
7.9 CSIC (Chongqing) Haizhuang Windpower Equipment
7.9.1 Profile
7.9.2 Operation
7.10 Zhejiang Windey
7.10.1 Profile
7.10.2 Operation
8 Summary and Forecast
8.1 Market
8.1.1 Global
8.1.2 China
8.2 Enterprise
8.2.1 Global
8.2.2 China
图:风力发电机结构
表:典型风机零部件构成及成本
表:双馈式和永磁直驱式风电机组对比
图:风电行业产业链
图:风电场建设成本构成
表:全球风能资源分布
表:全球沿海地区风资源分布
图:2010-2020年全球风力发电项目投资额及同比增长
图:2009-2020年全球风力发电量及占比
图:2001-2020年全球风电新增装机容量
图:2001-2020年全球风电累计装机容量
表:2014-2015年全球(分区域)风电装机
表:2015年全球风电新增装机TOP10国家
表:2015年全球风电累计装机TOP10国家
图:2011-2020年全球海上风电累计装机容量
表:2015年全球主要国家海上风电装机容量
表:2015年德国陆上风电装机容量
图:1992-2015年德国新增及累计陆上风电装机容量
表:2015年德国(分地区)陆上风电装机容量
表:2015年德国海上风电装机容量
图:2015年底德国海上风电并网限额应用构成
图:截至2015年底德国海上风电项目分布
图:1990-2015年西班牙新增风电装机容量
图:2005-2015年西班牙累计风电装机容量
表:2015年西班牙(分地区)累计装机容量
表:2015年西班牙(分厂商)累计装机容量
图:2015年美国新能源装机量(分能源类型)构成
表:2009-2016年美国风电装机(分季度)安装量
图:1999-2016年美国风电新增及累计装机容量
图:截至2016Q1美国累计风电装机容量(分地区)
图:2015年美国风电相关厂商分布
图:截至2016Q1美国风电在建项目
图:截至2016Q1美国风电在拟建项目(分区域)分布
图:2005-2015年丹麦电力消费量中风电占比
图:2005-2015年丹麦风电累计装机容量
图:2009-2015年英国风电累计装机容量
图:截至2016年5月英国风电装机情况
图:全球风电制造商市场份额TOP10(按新增量)
图:2015年全球五大地区风机供应商Top10(按新增量)
图:2015年全球海上风电风机供应商TOP10
表:2014-2016年中国风电相关政策
表:2050年中国风电发展目标
表:2050年中国主要地区风电发展目标及布局
图:2005-2020年中国新增及累计风电装机容量
图:2011-2020年中国新增及累计风电并网装机容量
图:2015年中国(分省市)新增风电装机容量
图:2015年中国(分省市)累计风电装机容量
图:1991-2015年中国新增和累计装机的风电机组平均功率
图:2015年中国不同功率风电机组新增装机容量比例
图:2004-2015年中国1.5MW和2MW风电机组新增装机
图:2008-2016年中国海上风电新增及累计装机容量
表:2015年不同类型资源条件的海上风电项目累计装机容量
表:2015年中国海上风电项目新增装机容量
图:2008-2015年中国出口风电机组容量
图:2015年中国(分国家)累计出口风电机组
表:2015年底中国风电机组整机企业出口机组累计容量
表:2015年中国风电机组整机企业出口机组新增容量
表:2015年中国主要企业新增风电装机容量 (万千瓦)
表:截至2015年底中国主要企业累计风电装机容量 (万千瓦)
表:2015年全球主要风电叶片企业及生产基地分布
表:2009-2016年全球风电叶片需求量
表:近年已退出风电叶片行业的企业
表:2010-2015年中国风电叶片产能及产能利用率
表:2009-2020年中国风电叶片需求量
表:2013-2015年中国风电叶片销量
表:中国主要风电叶片企业技术路径
表:中国主要叶片企业材料及工艺特点
表:2015年中国主要风电叶片企业产品系列
表:2011-2015年LM Wind Power 营业收入及利润
图:2015年LM Wind Power风电叶片系列产品
图:2015年LM Wind Power 生产基地分布
表:2010-2015年LM Wind Power 叶片产量
表:2015年LM Wind Power在华风电叶片工厂
图:2015年Vestas 生产基地分布
表:2016年中航惠腾风电叶片生产基地
图:2011-2016年中航惠腾营业收入及净利润
表:2016年中复连众风电叶片生产基地
图:2011-2016年中材科技营业收入及净利润
表:2012-2015年中材科技风电叶片产、销量
表:2015年中材科技风电叶片生产基地及产能
图:2015年中材科技风电叶片系列
图:2012-2015年中材科技风电叶片营业收入及净利润
表:2016年时代新材风电叶片基地分布
表:2012-2015年上玻院主要经济指标
图:双馈风力发电系统
图:典型双馈式风机成本结构
图:2010-2020年南高齿风电齿轮箱出货量
表:2009-2016年南高齿营业收入及风电齿轮收入
表:2014-2016年重庆重齿营主要经济指标
表:2009-2016年杭齿前进营业收入及风电及工业传动产品收入
表:2013-2016年杭齿前进风电齿轮箱产销量
表:2012-2016年宁波东力风电齿轮箱收入
表:2012-2015年天顺风能风塔产销量
表:2014-2015年天顺风能(分业务)主营业务收入
表:2016年天顺风能拟建风力开发项目
图:重山风力集团全球风塔业务分布
表:2012-2016年泰胜风能风力发电机组配套塔架产销量
图:2011-2016年泰胜风能营业收入及净利润
表:2014-2016年泰胜风能(分业务)主营业务收入
表:风电变流器分类
图:风电变流器成本构成
表:2015中国主要风电变流器企业销量(按销量)
表:中国主要风电变流器厂商及产品系列
表:中国主要风机厂与变流器厂商配套关系
图:2009-2016年中国风电变流器需求量
表:2014-2015年九洲电气(分业务)主营业务收入
图:1994-2015年海得控制营业收入及净利润
图:台达电子双馈风电变流器示意图
图:台达电子全功率液冷风电变流器示意图
图:截止2016年4月禾望电气已完成风电项目
表:2014-2015年科诺伟业(分产品)主营业务收入
表:截至2016年5月科诺伟业已完成风电项目
图:日风电气风电变流器项目分布
图:2011-2015阳光电源风电变流器收入及出货量
表:2016年北京能高风电变流器产品
表:2009-2015年中国风电轴承需求量
表:中国风电轴承主要生产商
图:铁姆肯在华业务布局
表:2008-2015年天马轴承营业收入及净利润
图:中国陆地70米高度风功率密度分布
图:中国近海5-20米水深的海域内、100米高度年平均风功率密度分布
图:2011-2016年中国风电上网电量及占比
表:2011-2016年中国弃风电量及弃风率
表:2016年中国风电重点地区最低保障收购年利用小时数核定表
表:2016、2018年中国陆上风力发电上网标杆电价表
图:2016年中国海上风电上网标杆电价
表:2014年底中国 10个大型风电基地核准及建设情况
表:2014年底中国分布式风电项目建设进展
表:截至2015年7月底中国海上风电项目(2014-2016建设方案)进展
表:2016年中国风电开发建设方案
表:2015年中国风电开发企业新增装机容量
表:2015年中国风电开发企业累计装机容量
图:2009-2015年VESTAS营业收入及净利润
表:2015年Vestas(分地区)在手订单及库存
表:截至2015年12月31日Vestas风机全球交付情况
表:2013-2016年GE 营业收入
图:2013-2015年GE Renewable Energy 营业收入及利润
表:2014-2016财年西门子营业收入及净利润
表:2014-2016财年西门子Wind Power and Renewables收入及利润
图:2015年Gamesa 全球风机市场占有率
表:2014-2016年Gamesa 营业收入及净利润
图:2014-2015年Gamesa 新接订单额(分地区)构成
图:2015年Enercon 全球及德国市场占有率
图:2009-2016年金风科技营业收入及净利润
表:2015年金风科技(分产品)收入及毛利率
表:2010-2015年金风科技风电场装机容量
表:2012-2015年金风科技风机销售量
表:2011-2015年金风科技手持订单
图:2009-2015年华锐风电营业收入及净利润
表:国电联合动力生产基地
图:2009-2016年东方电气营业收入及净利润
表:2011-2015年东汽风电机组产量
图:2010-2016年明阳风电主营收入及净利润
图:2014-2015年明阳风电产量
图:2009-2016年上海电气营业收入及净利润
表:2016年上海电气风电基地
表:2010-2016年湘电风能大事记
表:2012-2015年湘电风能新增风电机组装机容量
图:远景能源全球业务布局
表:运达风电发展历程
图:2015-2020年全球及中国累计风电装机容量
图:2015-2020年全球及中国累计海上风电装机容量
Wind Turbine Structure
Typical Wind Turbine Parts Structure and Cost
Comparison between Double-Fed Wind Turbines and Permanent-Magnet Direct-Drive Wind Turbines
Wind Power Industry Chain
Wind Farm Construction Cost Composition
Distribution of Global Wind Energy Resources
Distribution of Wind Resources in Global Costal Areas
Investment in Global Wind Power Generation Projects and YoY Growth, 2010-2020E
Global Wind Power Generation and Structure, 2009-2020E
Global New Installed Capacity, 2001-2020E
Global Total Installed Capacity, 2001-2020E
Global Installed Wind Power Capacity (by Region), 2014-2015
Top10 Countries by New Installed Wind Power Capacity, 2015
Top10 Countries by Total Installed Wind Power Capacity, 2015
Global Total Installed Offshore Wind Power Capacity, 2011-2020E
Installed Offshore Wind Power Capacity in Major Countries, 2015
Germany's Installed Onshore Wind Power Capacity, 2015
Germany's New and Total Installed Onshore Wind Power Capacity, 1992-2015
Germany's Installed Onshore Wind Power Capacity (by Region), 2015
Germany's Installed Offshore Wind Power Capacity, 2015
Application and Composition of Limits for Offshore Wind Power Integration in Germany at the End of 2015
Distribution of Offshore Wind Power Projects in Germany by the End of 2015
Spain's New Installed Wind Power Capacity, 1990-2015
Spain's Total Installed Wind Power Capacity, 2005-2015
Spain's Total Installed Capacity (by Region), 2015
Spain's Total Installed Capacity (by Company), 2015
Structure of U.S. Installed New Energy Capacity (by Energy Type), 2015
U.S. Installed Wind Power Capacity (by Quarter), 2009-2016
U.S. New and Total Installed Wind Power Capacity, 1999-2016
U.S. Total Installed Wind Power Capacity (by Region) as of 2016Q1
Distribution of Wind Power Related Manufacturers in the U.S., 2015
U.S. Wind Power Projects under Construction as of 2016Q1
Distribution of Proposed Wind Power Projects in the U.S. as of 2016Q1
Wind Power Share in Denmark's Electricity Consumption, 2005-2015
Denmark's Total Installed Wind Power Capacity, 2005-2015
UK's Total Installed Wind Power Capacity, 2009-2015
UK's Installed Wind Power Capacity as of May 2016
Top10 Market Share of Global Wind Power Manufacturers (by Increment)
Top10 Wind Turbine Suppliers in the Five Parts of the World (by Increment), 2015
TOP10 Offshore Wind Turbine Suppliers in the World, 2015
Policies on China Wind Power Industry, 2014-2016
Targets for Wind Power Development in China, 2050
Targets and Layout for Wind Power Development in Main Areas of China, 2050
China's New and Total Installed Wind Power Capacity, 2005-2020E
China's New and Total Installed Wind Power Integration Capacity, 2011-2020E
China's New Installed Wind Power Capacity (by Province/City), 2015
China's Total Installed Wind Power Capacity (by Province/City), 2015
Average Power of Newly and Cumulatively Installed Wind Turbines in China, 1991-2015
China's New Installed Wind Turbine Capacity by Different Powers, 2015
China's New Installed 1.5MW and 2MW Wind Turbine Capacity, 2004-2015
China's New and Total Installed Offshore Wind Power Capacity, 2008-2016
Total Installed Capacity of Offshore Wind Power Projects by Different Types of Resources, 2015
China's New Installed Offshore Wind Power Capacity, 2015
China's Wind Turbine Export Capacity, 2008-2015
China's Total Wind Turbine Export Volume (by Country), 2015
Total Wind Turbine Export Capacity of Chinese Wind Turbine Companies at the End of 2015
New Wind Turbine Export Capacity of Chinese Wind Turbine Companies, 2015
New Installed Wind Power Capacity of Major Companies in China, 2015 (10000kW)
Total Installed Wind Power Capacity of Major Companies in China by the End of 2015 (10000kW)
Production Base Distribution of Major Global Wind Power Blade Companies, 2015
Global Wind Power Blade Demand, 2009-2016
Companies Out of Wind Power Blade Industry in Recent Years
China's Wind Power Blade Capacity and Capacity Utilization, 2010-2015
China's Wind Power Blade Demand, 2009-2020E
China's Wind Power Blade Sales Volume, 2013-2015
Technological Paths of Major Wind Power Blade Companies in China
Materials and Process Characteristics of Major Blade Companies in China
Product Line of Major Wind Power Blade Companies in China, 2015
Revenue and Profit of LM Wind Power, 2011-2015
Wind Power Blade Series of LM Wind Power, 2015
Distribution of LM Wind Power's Production Bases, 2015
Blade Output of LM Wind Power, 2010-2015
Wind Power Blade Factories of LM Wind Power in China, 2015
Distribution of Vestas' Production Bases, 2015
Wind Power Blade Production Bases of AVIC HuitengWindpower Equipment, 2016
Revenue and Net Income of AVIC HuitengWindpower Equipment, 2011-2016
Wind Power Blade Production Bases of Lianyungang ZhongfuLianzhong Composites Group, 2016
Revenue and Net Income of Sinoma Science & Technology, 2011-2016
Wind Power Blade Output and Sales Volume of Sinoma Science & Technology, 2012-2015
Capacities of Wind Power Blade Production Bases of Sinoma Science & Technology, 2015
Wind Power Blade Series of Sinoma Science & Technology, 2015
Wind Power Blade Revenue and Net Income of Sinoma Science & Technology, 2012-2015
Distribution of Wind Power Blade Bases of Zhuzhou Time New Material Technology, 2016
Major Economic Indicators of Shanghai FRP Research Institute, 2012-2015
Double-Fed Wind Generation System
Cost Structure of Typical Double-Fed Wind Turbine
Wind Power Gearbox Shipments of NGC, 2010-2020E
Revenue and Wind Power Gear Revenue of NGC, 2009-2016
Major Economic Indicators of CN GPOWER Gearbox 2014-2016
Revenue and Wind Power & Industrial Transmission Product Revenue of Hangzhou Advance Gearbox Group, 2009-2016
Wind Power Gearbox Output and Sales Volume of Hangzhou Advance Gearbox Group, 2013-2016
Wind Power Gearbox Revenue of Ningbo Donly, 2012-2016
Wind Tower Output and Sales Volume of Titan Wind Energy, 2012-2015
Operating Revenue of Titan Wind Energy (by Business), 2014-2015
Proposed Wind Power Development Projects of Titan Wind Energy, 2016
Global Distribution of CS Wind Corporation's Wind Tower Business
Wind Turbine Tower Output and Sales Volume of Shanghai Taisheng Wind Power Equipment, 2012-2016
Revenue and Net Income of Shanghai Taisheng Wind Power Equipment, 2011-2016
Operating Revenue of Shanghai Taisheng Wind Power Equipment (by Business), 2014-2016
Classification of Wind Power Converter
Cost Structure of Wind Power Converter
Sales Volume of Major Wind Power Converter Companies in China, 2015
Product Line of Major Wind Power Converter Companies in China
Supporting Relationship between Major Wind Turbine Companies and Converter Companies in China
China's Wind Power Converter Demand, 2009-2016
Operating Revenue of Sichuan Jiuzhou Electric Group (by Revenue), 2014-2015
Revenue and Net Income of Shanghai Hi-tech Control System, 1994-2015
Double-Fed Wind Power Converter Diagram of Delta Electronics
Full-Power Liquid-Cooled Wind Power Converter Diagram of Delta Electronics
Completed Wind Power Projects of Hopewind Electric as of April 2016
Operating Revenue of Beijing Corona Science & Technology (by Product), 2014-2015
Completed Wind Power Projects of Beijing Corona Science & Technology as of May 2016
Distribution of HRV Electric's Wind Power Converter Projects
Wind Power Converter Revenue and Shipments of Sungrow Power Supply, 2011-2015
Wind Power Converter Products of Beijing Nego Automation Technology, 2016
Demand for Wind Power Bearings in China, 2009-2015
Major Wind Power Bearing Producers in China
TIMKEN's Business Layout in China
Revenue and Net Income of Tianma Bearing Group, 2008-2015
Wind Power Density Distribution on 70-Meter-High Land of China
Average Wind Power Density Distribution on 5-20-Meter-Deep and 100-Meter-High Offshore of China
China's Wind Power Feed-in Metering and Structure, 2011-2016
Wind Turbine Suspension Volume and Rate in China, 2011-2016
Assessment Form for Guaranteed Minimum Purchased Annual Utilization Hours in Key Wind Power Areas of China, 2016
China's Onshore Wind Power Feed-in Tariffs (Benchmark Prices), 2016 & 2018
China's Offshore Wind Power Feed-in Tariffs (Benchmark Prices), 2016
Approval and Construction of 10 Large Wind Power Bases in China at the End of 2014
Construction Progress of Distributed Wind Power Projects in China at the End of 2014
Progress of Chinese Offshore Wind Power Projects (Development Scheme 2014-2016) by the End of July 2015
Schemes for Wind Power Development and Construction in China, 2016
New Installed Capacity of Chinese Wind Power Development Enterprises, 2015
Total Installed Capacity of Chinese Wind Power Development Enterprises, 2015
Revenue and Net Income of Vestas, 2009-2015
Handling Orders and Stock of Vestas (by Region), 2015
Global Wind Turbine Delivery of Vestas as of Dec 31, 2015
GE's Revenue, 2013-2016
GE's Renewable Energy Revenue and Profit, 2013-2015
Siemens' Revenue and Net Income, FY2014-FY2016
Siemens' Revenue and Profits from Wind Power and Renewables, FY2014-FY2016
Gamesa's Share in Global Wind Turbine Market, 2015
Gamesa's Revenue and Net Income, 2014-2016
Structure of Gamesa's New Orders (by Region), 2014-2015
Enercon's Share in Global and German Markets, 2015
Revenue and Net Income of Goldwind Science & Technology, 2009-2016
Revenue and Gross Margin of Goldwind Science & Technology (by Product), 2015
Installed Wind Farm Capacity of Goldwind Science & Technology, 2010-2015
Wind Turbine Sales Volume of Goldwind Science & Technology, 2012-2015
Handling Orders of Goldwind Science & Technology, 2011-2015
Revenue and Net Income of Sinovel Wind Group, 2009-2015
Production Bases of United Power
Revenue and Net Income of Dongfang Electric Corporation, 2009-2016
Wind Turbine Output of Dongfang Turbine, 2011-2015
Operating Revenue and Net Income of Mingyang Wind Power, 2010-2016
Output of Mingyang Wind Power, 2014-2015
Revenue and Net Income of Shanghai Electric, 2009-2016
Wind Power Bases of Shanghai Electric, 2016
Events of XEMC Windpower, 2010-2016
New Installed Wind Power Capacity of XEMC Windpower, 2012-2015
Global Business Layout of Envision Energy
Development History of Zhejiang Windey
Global and China's Total Installed Wind Power Capacity, 2015-2020E
Global and China's Total Installed Offshore Wind Power Capacity, 2015-2020E
如果这份报告不能满足您的要求,我们还可以为您定制报告,请 留言说明您的详细需求。
|