|
|
|
报告导航:研究报告—
制造业—工业机械
|
|
2016-2020年全球及中国电梯行业研究报告 |
 |
字数:4.8万 |
页数:167 |
图表数:233 |
|
中文电子版:8000元 |
中文纸版:4000元 |
中文(电子+纸)版:8500元 |
|
英文电子版:2400美元 |
英文纸版:2600美元 |
英文(电子+纸)版:2700美元 |
|
编号:ZLC034
|
发布日期:2016-08 |
附件:下载 |
 |
|
|
2015年全球电梯销量20年以来首次下降,为80.3万台,同比下降3%。这主要是由于中国地区受住宅需求下降影响,导致销量下降,以至于全球电梯销量首次下降。2016年,受中国市场持续下降影响,估计全球电梯销量还将继续下降至78.3万台。
目前,中国已成为全球最大的电梯生产和消费市场,全球主要的电梯品牌均已在中国建立独资或合资企业,是电梯领域的世界工厂和制造中心。
2015-2016年,中国电梯市场主要呈现以下特点:
1、新梯市场销量大幅下滑,但对几个大型电梯企业影响不大
2015年,受房地产业下滑以及电梯安全事故频发等因素影响,中国电梯销量近年来首度出现下滑,从2014年的50万台下降至48万台,同比下滑4%。预计2016年销量仍将继续下降。
新梯市场销量大幅下滑对中小型企业的影响较大,而几个大型的电梯企业资本雄厚,客户稳定,竞争实力更强,因此影响不大,销量不减反增。2015年,上海机电、康力电梯和广日股份销量分别达到61898台、19530台和11016台,分别增长4.5%、10.6%和2.0%。
图:2015年中国电梯行业市场份额(分企业)
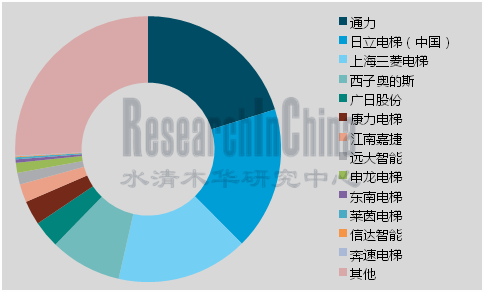
来源:水清木华研究中心《2016-2020年全球及中国电梯行业研究报告》
2、维保市场成新的利润增长点,各大企业加紧布局
电梯维保业务基于电梯存量市场,具有毛利高、市场空间大的特点。截至2015年底,中国电梯保有量共计400万台。按8000元/台/年的电梯维保费计算,中国电梯维保市场规模达320亿元。
虽然目前中国主要企业维保业务收入占比还比较低,但大部分企业已意识到维保市场已成为电梯行业新的利润增长点,开始加紧布局全国范围的营销服务网络,抢占维保市场。
截至2015年底,上海三菱电梯已在全国设立了超过80家直属分支机构,并设立了360多家维保服务网络,全年安装维保等服务业务收入达40.88亿元,占总营收比重达23.2%;康力电梯已成立79家分公司和服务中心,其中取得A级安装维保资质的达23家,全年安装维保收入达3.06亿元,占总营收的9.4%。
电梯出口稳步增长,江浙一带主要出口地区
2015年,中国载人电梯、自动扶梯及自动人行道出口量达74101台,同比增长5191台,出口金额达21.202亿美元,同比增长8%。
江浙一带是中国载人电梯、扶梯的主要出口地区。2015年,江苏是中国电梯、扶梯出口第一大省,出口量达25999台,占出口总量的48.5%;扶梯出口量达6911台,占比达33.6%。
新梯市场近几年有望回暖,维保市场基于存量市场规模稳步上升
2016全年,在中国房地产业增速持续放缓态势下,电梯行业需求量预计将再次下降,估计销量在47万台左右。2017-2020年,在城镇化和老龄化的推动下,加之城市轨道交通进入快速发展期、旧梯安装电梯政策逐步实施,以及需更换的旧电梯数量增加等因素的推动下,电梯销量有望回暖。预计到2020年销量将达65万台,同时电梯保有量将达到590万台,维保市场规模估计达472亿元。
《2016-2020年中国电梯行业研究报告》主要包括以下内容:
 全球电梯行业发展概况,分别对新梯市场、维保市场和竞争格局进行了详细分析; 全球电梯行业发展概况,分别对新梯市场、维保市场和竞争格局进行了详细分析;
中国电梯行业发展概况,对新梯市场和维保市场的发展现状、发展趋势和主要企业的竞争情况进行了深入分析;
中国电梯行业需求情况,包括对下游行业需求结构、需求构成、需求影响因素进行了深入分析;
对国内10家主要电梯企业的经营情况、电梯业务、产销情况、主要项目、主要客户等进行了深入分析,对国外7家主要电梯企业的经营情况、电梯业务和在华发展情况进行了深入分析。
In 2015, the global elevator sales volume dropped for the first time within 20 years to 803,000, down 3% year on year. This was mainly due to the decline in the housing demand in China. In 2016, the sluggish Chinese market may further drag down the global elevator sales volume to 783,000.
At present, China has become the world's largest elevator market in terms of production and consumption. Major global brands have established sole proprietorships or joint ventures in China which acts as the world's elevator factory and manufacturing center.
In 2015-2016, Chinese elevator market characterizes the followings:
1, The new elevator sales volume slumped, but it had little effect on several large elevator companies
In 2015, the real estate downturn and frequent elevator accidents led to the decline in China’s elevator sales volume for the first time in recent years, from 500,000 in 2014 to 480,000, down 4% year on year. In 2016, the sales volume will continue to drop.
Sharp fall in new elevator sales exerted greater impact on SMEs (Small- and Medium-sized Enterprises) instead of several large elevator companies which saw higher sales volume by holding abundant capital, stable customers and stronger competitiveness. In 2015, Shanghai Mechanical & Electrical Industry Co., Ltd., Canny Elevator Co., Ltd. and Guangzhou Guangri Stock Co., Ltd. achieved the respective sales volume of 61,898 units, 19,530 units and 11,016 units, up 4.5%, 10.6% and 2.0% separately.
Market Share of China Elevator Industry, 2015 (by Company)
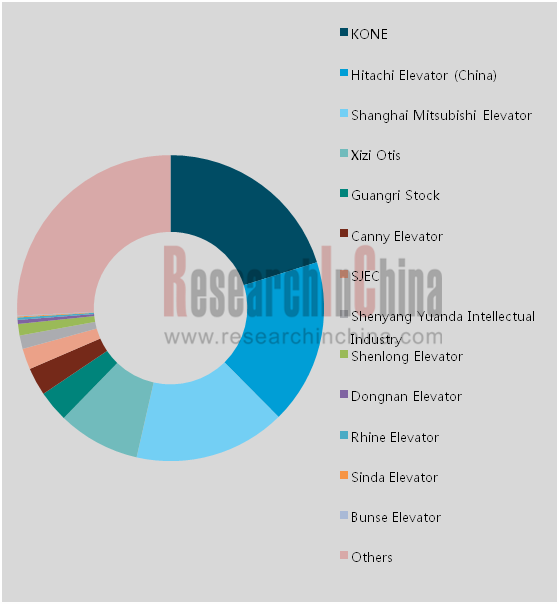
Source: ResearchInChina
2, The maintenance market turned to be a new profit growth engine, so that major companies intensified layout
Based on the elevator stock market, the elevator maintenancebusiness is featured with high margin and huge market space. By the end of 2015, China had owned a total of 4 million elevators. Assuming the unit maintenance is RMB8,000 / year, Chinese elevator maintenance market size will be RMB32 billion.
Although the maintenance revenue contributes little, most of Chinese enterprises have realized that the maintenance market becomes a new profit growth engine for the elevator industry; in this case, they have stepped up the layout of a nationwide marketing network to seize the market.
By the end of 2015, Shanghai Mitsubishi Elevator Co., Ltd had established more than 80 branches and over 360 maintenance service outlets in the country; in 2015, it garnered RMB4.088 billion from installation, maintenance and other services, accounting for 23.2% of the company’s total revenue. Meanwhile, Canny Elevator Co., Ltd. set up 79 branches and service centers, of which 23 ones obtainedClass-A installation and maintenance qualifications; the annual revenue of installation and maintenance reached RMB306 million, accounting for 9.4% of total revenue.
Elevator exports increased steadily thanks to the main exporters -- Jiangsu and Zhejiang
In 2015, China exported 74,101 passenger elevators, escalators and moving walkways, increasing by 5,191 units from a year ago; the export value jumped 8% year on year to USD2.1202 billion.
Zhejiang and Jiangsu are the main provinces exporting passenger elevators and escalators in China. In 2015, Jiangsu ranked first in the country with the export volume of 25,999, equivalent to 48.5% of total exports. 6,911 escalators were exported, accounting for 33.6%.
The new elevator market is expected to rebound in recent years; themaintenance market based on the stock market will grow stably
In 2016, the elevator demand is expected to fall again amid the slowdown of Chinese real estate sector, and the sales volume is estimated at about 470,000. In 2017-2020, the sales volume may rebound under the impetus of urbanization, aging population, fast-growing urban rail transit, gradual enforcement of elevator installation policies as well as an increasing number of old elevators to be replaced. By 2020, the sales volume is expected to reach 650,000, the elevator ownership 5.9 million, and the maintenance market size RMB47.2 billion.
Global and China Elevator Industry Report, 2016-2020 highlights the followings:
 Overview of global elevator industry, including new elevator market, maintenance market and competitive landscape; Overview of global elevator industry, including new elevator market, maintenance market and competitive landscape;
Overview of China elevator industry, embracing new elevator market, maintenance market, development trend and competitive landscape between major companies;
Demand of China elevator industry, covering demand structure and main influencing factors;
Operation, elevator business, output, sales volume, major projects and major customers of 10 domestic elevator companies; operation, elevator business and development in China of seven foreign elevator companies.
第一章 概述
1.1 概述
1.2 政策环境
第二章 全球电梯行业发展概况
2.1 新梯市场
2.1.1 销量20年来首度下降
2.1.2 各地区新梯销售情况
2.2 维保市场
2.2.1 电梯保有量
2.2.2 维保市场成主要增长点
2.3 竞争格局
2.4 发展模式
2.4.1 两种模式
2.4.2 发展亚太地区业务
2.4.3 全球化扩张
第三章 中国电梯行业发展概况
3.1 产品结构
3.2 新梯市场
3.2.1 发展现状
3.2.2 电梯销量
3.2.3 主要电梯企业电梯销量
3.3 维保市场
3.3.1 发展现状
3.3.2 电梯保有量
3.3.3 维保市场规模
3.3.4 主要企业维保业务对比
3.3.5 国内电梯厂商布局维保市场
3.4 进出口
3.4.1 进口呈下降趋势
3.4.2 出口稳步增长
3.4.3 进出口单价
3.5 竞争格局
3.5.1 外资品牌在华布局
3.5.2 本土企业融资情况
3.5.3 主要企业经营业绩对比
第四章 中国电梯行业需求情况
4.1 下游行业需求结构
4.2 需求构成
4.3 需求影响因素分析
4.3.1 房地产行业
4.3.2 城镇化
4.3.3 老龄化
4.3.4 城市轨道交通
4.3.5 旧梯更新改造
第五章 国内相关企业
5.1 上海机电
5.1.1 公司简介
5.1.2 经营情况
5.1.3 营收构成
5.1.4 毛利率
5.1.5 主要客户
5.1.6 电梯业务
5.1.7 上海三菱电梯
5.1.8 上海三菱电梯主要订单
5.1.9 三菱电机上海机电电梯有限公司
5.1.10 电梯产销量
5.1.11 研发投资
5.1.12 发展预测
5.2 广日股份
5.2.1 公司简介
5.2.2 经营情况
5.2.3 营收构成
5.2.4 毛利率
5.2.5 主要客户
5.2.6 电梯业务
5.2.7 广日电梯
5.2.8 典型项目
5.2.9 电梯产销量
5.2.10 研发投资
5.2.11 发展预测
5.3 康力电梯
5.3.1 公司简介
5.3.2 经营情况
5.3.3 营收构成
5.3.4 毛利率
5.3.5 主要客户
5.3.6 电梯产销量
5.3.7 典型项目
5.3.8 研发投资
5.3.9 发展预测
5.4 江南嘉捷
5.4.1 公司简介
5.4.2 经营情况
5.4.3 营收构成
5.4.4 毛利率
5.4.5 电梯产销量
5.4.6 国外典型项目
5.4.7 研发投资
5.4.8 建立“互联网+电梯服务系统中心”
5.4.9 订单情况
5.4.10 发展预测
5.5 远大智能
5.5.1 公司简介
5.5.2 经营情况
5.5.3 营收构成
5.5.4 毛利率
5.5.5 主要客户
5.5.6 电梯产销量
5.5.7 国外典型项目
5.5.8 研发投资
5.5.9 发展预测
5.6 申龙电梯
5.6.1 公司简介
5.6.2 经营情况
5.6.3 营收构成
5.6.4 毛利率
5.6.5 电梯产能及产销量
5.6.6 主要客户
5.6.7 国外典型项目
5.6.8 研发投资
5.6.9 发展预测
5.7 东南电梯
5.7.1 公司简介
5.7.2 经营情况
5.7.3 营收构成
5.7.4 毛利率
5.7.5 主要客户
5.7.6 特种电梯典型项目
5.7.7 研发投资
5.7.8 发展预测
5.8 奔速电梯
5.8.1 公司简介
5.8.2 经营情况
5.8.3 营收构成
5.8.4 毛利率
5.8.5 主要客户
5.8.6 典型项目
5.8.7 研发投资
5.8.8 发展预测
5.9 信达智能
5.9.1 公司简介
5.9.2 经营情况
5.9.3 营收构成
5.9.4 毛利率
5.9.5 主要客户
5.9.6 典型项目
5.9.7 研发投资
5.9.8 发展预测
5.10 莱茵电梯
5.10.1 公司简介
5.10.2 经营情况
5.10.3 营收构成
5.10.4 毛利率
5.10.5 主要客户
5.10.6 研发投资
5.10.7 发展预测
第六章 国外相关企业
6.1 Otis
6.1.1 公司简介
6.1.2 经营情况
6.1.3 订单情况
6.1.4 在华发展
6.1.5 西子奥的斯
6.1.6 西子奥的斯主要电梯订单
6.2 Hitachi
6.2.1 公司简介
6.2.2 经营情况
6.2.3 电梯业务
6.2.4 在华发展
6.2.5 在华订单
6.3 Schindler
6.3.1 公司简介
6.3.2 经营情况
6.3.3 订单情况
6.3.4 在华发展
6.3.5 在华订单
6.4 ThyssenKrupp
6.4.1 公司简介
6.4.2 经营情况
6.4.3 电梯业务
6.4.4 在华发展
6.4.5 在华订单
6.5 Toshiba
6.5.1 公司简介
6.5.2 经营情况
6.5.3 电梯业务
6.5.4 在华发展
6.5.5 在华订单
6.6 Fujitec
6.6.1 公司简介
6.6.2 经营情况
6.6.3 New Mid-term Management Plan
6.6.4 订单情况
6.6.5 在华发展
6.6.6 在华订单
6.7 Kone
6.7.1 公司简介
6.7.2 经营情况
6.7.3 营收构成
6.7.4 在华发展
6.7.5 在华订单
1 Overview of Elevator Industry
1.1 Overview
1.2 Policy Environment
2 Development of Global Elevator Industry
2.1 New Elevator Market
2.1.1 Elevator Sales Volume Dropped for the First Time within 20 Years
2.1.2 New Elevator Sales by Region
2.2 Maintenance Market
2.2.1 Elevator Ownership
2.2.2 Maintenance Market Becomes a Major Growth Engine
2.3 Competitive Landscape
2.4 Development Mode
2.4.1 Two Modes
2.4.2 Business Development in Asia Pacific
2.4.3 Global Expansion
3 Development of China Elevator Industry
3.1 Product Structure
3.2 New Elevator Market
3.2.1 Status Quo
3.2.2 Sales Volume
3.2.3 Sales Volume of Major Enterprises
3.3 Maintenance Market
3.3.1 Status Quo
3.3.2 Elevator Ownership
3.3.3 Maintenance Market Size
3.3.4 Maintenance Business Comparison between Major Enterprises
3.3.5 Layout of Domestic Elevator Manufacturers in Maintenance Market
3.4 Import and Export
3.4.1 Import Tends to Decline
3.4.2 Export Grows Steadily
3.4.3 Import and Export Unit Price
3.5 Competitive Landscape
3.5.1 Layout of Foreign Brands in China
3.5.2 Financing of Local Enterprises
3.5.3 Operating Result Comparison between Major Enterprises
4 Demand of China Elevator Industry
4.1 Downstream Demand Structure
4.2 Demand Composition
4.3 Influencing Factors
4.3.1 Real Estate Sector
4.3.2 Urbanization
4.3.3 Aging Population
4.3.4 Urban Rail Transit
4.3.5 Renewal and Upgrading of Old Elevators
5 Key Elevator Companies in China
5.1 Shanghai Mechanical & Electrical Industry Co., Ltd.
5.1.1 Profile
5.1.2 Operation
5.1.3 Revenue Structure
5.1.4 Gross Margin
5.1.5 Major Customers
5.1.6 Elevator Business
5.1.7 Shanghai Mitsubishi Elevator Co., Ltd
5.1.8 Major Orders of Shanghai Mitsubishi Elevator Co., Ltd
5.1.9 Mitsubishi Electric Shanghai Electric Elevator Co., Ltd.
5.1.10 Elevator Output and Sales Volume
5.1.11 R&D Investment
5.1.12 Development Forecast
5.2 Guangzhou Guangri Stock Co., Ltd.
5.2.1 Profile
5.2.2 Operation
5.2.3 Revenue Structure
5.2.4 Gross Margin
5.2.5 Major Customers
5.2.6 Elevator Business
5.2.7 Guangri Elevator
5.2.8 Typical Projects
5.2.9 Elevator Output and Sales Volume
5.2.10 R&D Investment
5.2.11 Development Forecast
5.3 Canny Elevator Co., Ltd.
5.3.1 Profile
5.3.2 Operation
5.3.3 Revenue Structure
5.3.4 Gross Margin
5.3.5 Major Customers
5.3.6 Elevator Output and Sales Volume
5.3.7 Typical Projects
5.3.8 R&D Investment
5.3.9 Development Forecast
5.4 SJEC Corporation
5.4.1 Profile
5.4.2 Operation
5.4.3 Revenue Structure
5.4.4 Gross Margin
5.4.5 Elevator Output and Sales Volume
5.4.6 Foreign Typical Projects
5.4.7 R&D Investment
5.4.8 Establishment of "Internet + Elevator Service System Center"
5.4.9 Orders
5.4.10 Development Forecast
5.5 Shenyang Yuanda Intellectual Industry Group Co., Ltd.
5.5.1 Profile
5.5.2 Operation
5.5.3 Revenue Structure
5.5.4 Gross Margin
5.5.5 Major Customers
5.5.6 Elevator Output and Sales Volume
5.5.7 Foreign Typical Projects
5.5.8 R&D Investment
5.5.9 Development Forecast
5.6 Shenlong Elevator Co., Ltd.
5.6.1 Profile
5.6.2 Operation
5.6.3 Revenue Structure
5.6.4 Gross Margin
5.6.5 Elevator Capacity, Output and Sales Volume
5.6.6 Major Customers
5.6.7 Foreign Typical Projects
5.6.8 R&D Investment
5.6.9 Development Forecast
5.7 Dongnan Elevator Co., Ltd.
5.7.1 Profile
5.7.2 Operation
5.7.3 Revenue Structure
5.7.4 Gross Margin
5.7.5 Major Customers
5.7.6 Special Elevator Typical Projects
5.7.7 R&D Investment
5.7.8 Development Forecast
5.8 Shandong Bunse Elevator Co., Ltd.
5.8.1 Profile
5.8.2 Operation
5.8.3 Revenue Structure
5.8.4 Gross Margin
5.8.5 Major Customers
5.8.6 Typical Projects
5.8.7 R&D Investment
5.8.8 Development Forecast
5.9 Hunan Sinda Elevator Co., Ltd.
5.9.1 Profile
5.9.2 Operation
5.9.3 Revenue Structure
5.9.4 Gross Margin
5.9.5 Major Customers
5.9.6 Typical Projects
5.9.7 R&D Investment
5.9.8 Development Forecast
5.10 Rhine Elevator
5.10.1 Profile
5.10.2 Operation
5.10.3 Revenue Structure
5.10.4 Gross Margin
5.10.5 Major Customers
5.10.6 R&D Investment
5.10.7 Development Forecast
6 Key Foreign Elevator Companies
6.1 Otis
6.1.1 Profile
6.1.2 Operation
6.1.3 Orders
6.1.4 Development in China
6.1.5 Xizi Otis
6.1.6 Main Elevator Orders of Xizi Otis
6.2 Hitachi
6.2.1 Profile
6.2.2 Operation
6.2.3 Elevator Business
6.2.4 Development in China
6.2.5 Orders in China
6.3 Schindler
6.3.1 Profile
6.3.2 Operation
6.3.3 Orders
6.3.4 Development in China
6.3.5 Orders in China
6.4 ThyssenKrupp
6.4.1 Profile
6.4.2 Operation
6.4.3 Elevator Business
6.4.4 Development in China
6.4.5 Orders in China
6.5 Toshiba
6.5.1 Profile
6.5.2 Operation
6.5.3 Elevator Business
6.5.4 Development in China
6.5.5 Orders in China
6.6 Fujitec
6.6.1 Profile
6.6.2 Operation
6.6.3 New Mid-term Management Plan
6.6.4 Orders
6.6.5 Development in China
6.6.6 Orders in China
6.7 Kone
6.7.1 Profile
6.7.2 Operation
6.7.3 Revenue Structure
6.7.4 Development in China
6.7.5 Orders in China
表:电梯产品分类
表:电梯主要组成部件
表:中国电梯行业相关法律法规
表:中国电梯行业相关政策
图:2010-2020E全球电梯销量
图:2010-2016E全球电梯销量(分地区)
图:2014-2015年全球电梯销量(分地区)
图:2015年全球电梯销量占比(分国家)
图:2005-2015年全球新装电梯订单份额(分地区)
图:2010-2030年全球主要国家电梯每千人保有量及城镇化率
图:2013-2020E全球电梯保有量
图:2015年全球电梯保有量份额(分地区)
图:2005-2015年通力维保收入占比
图:2015年全球电梯市场份额
图:2015年通力在中国地区收入占公司总收入的比重
表:通力集团并购案例及影响
表:迅达集团并购案例
图:电梯产品结构
图:2005-2015年中国中低速电梯产品市场份额
图:2012-2020E中国电梯销量
表: 2015年中国主要电梯企业电梯销量
图:2015年中国电梯企业销量占比
图:2015年中国主要电梯企业电梯整梯销售收入
图:2015年中国新梯市场份额(分企业)
图:2015年中国电梯维保市场份额
图:2015-2020E中国电梯保有量
图:2015-2020E中国电梯维保市场规模
表:中国主要电梯企业安装维保业务收入及占总营收比重
图:2010-2015年中国载人电梯、自动扶梯及自动人行道进口量及金额
表:2015年中国载人电梯进口量前十的国家
表:2015年中国自动扶梯及自动人行道进口量前十的国家
图:2010-2015年中国载人电梯、自动扶梯及自动人行道出口量及金额
表:2015年中国载人电梯出口量前十的省份
表:2015年中国自动扶梯及自动人行道出口量前十的省份
表:2015年中国载人电梯出口量前十的国家
表:2015年中国自动扶梯及自动人行道出口量前十的国家
图:2010-2015年中国载人电梯进出口单价对比
图:2010-2015年中国自动扶梯及自动人行道进出口单价对比
图:2015年中国电梯行业市场份额(分企业)
表:中国本土电梯企业与国际电梯巨头在高速电梯领域的布局对比
表:主要外资品牌电梯在华布局情况
表:2011-2015年国外电梯企业在华发展动态
表:2013-2016年中国主要电梯企业营业收入对比
表:2013-2016年中国主要电梯企业净利润对比
图:中国电梯下游需求结构
图:电梯需求市场组成
表:电梯需求细分市场影响因素
图:2015年中国电梯需求构成
图:2010-2015年中国房地产开发投资完成额
图:2014-2015年中国商品房销售面积及销售额增速
图:2000-2015年中国电梯配置密度
图:2010-2015年中国城镇化率
表:新型城镇化下的电梯需求特点
2010-2015年中国60岁以上老年人口占比
图:2012-2015年中国城市轨道交通运营总里程
表:2010-2024年中国需更新的电梯数量
图:2013-2016年上海机电营业收入及净利润
图:2014-2015年上海机电营业收入(分产品)
图:2014-2015年上海机电营收构成(分产品)
图:2014-2015年上海机电毛利率(分产品)
表:2014-2015年上海机电前五名客户销售情况
图:2014-2015年上海三菱电梯经营业绩
图:2014-2015年上海三菱电梯安装维保业务收入
表:上海三菱电梯发展里程碑
表:上海三菱电梯主要订单
图:2014-2015年三菱电机上海机电电梯有限公司经营业绩
表:2014-2015年上海机电电梯产销量
图:2014-2015年上海机电研发支出及占总营收比重
图:2015-2020E上海机电营业收入及净利润
图:2013-2016年广日股份营业收入及净利润
图:2014-2015年广日股份营业收入(分产品)
图:2014-2015年广日股份营业收入(分地区)
图:2014-2015年广日股份毛利率
表:2014-2015年广日股份毛利率(分产品)
表:2014-2015年广日股份毛利率(分地区)
表:2014-2015年广日股份前五名客户销售情况
表:广日股份主要生产基地
表:2014-2015年广日电梯财务指标
图:广日电梯典型项目
表:2015年广日股份产销情况
图:2013-2015年广日股份研发支出及占总营收比重
表:广日股份工业4.0智能平台布局
图:2015-2020E广日股份营业收入及净利润
图:康力电梯生产基地布局
图:康力电梯全球布局
图:2013-2016年康力电梯营业收入及净利润
图:2014-2015年康力电梯营业收入(分产品)
图:2014-2015年康力电梯营业收入构成(分产品)
图:2014-2015年康力电梯营业收入(分地区)
图:2014-2015年康力电梯营业收入构成(分地区)
表:康力电梯主要海外项目
图:2014-2015年康力电梯毛利率
图:2014-2015年康力电梯毛利率(分产品)
表:2014-2015年康力电梯毛利率(分地区)
表:2014-2015年康力电梯前五名客户销售情况
图:康力电梯主要客户
表:2014-2015年康力电梯产销量
图:康力电梯典型项目
图:2013-2015年康力电梯研发支出及占总营收比重
图:2015-2020E康力电梯营业收入及净利润
图:2013-2016年江南嘉捷营业收入及净利润
表:2014-2015年江南嘉捷营业收入(分产品)
图:2015年江南嘉捷营业收入构成(分产品)
图:2014-2015年江南嘉捷营业收入(分地区)
图:2014-2015年江南嘉捷营业收入构成(分地区)
表:2014-2015年江南嘉捷毛利率(分产品)
图:2014-2015年江南嘉捷毛利率(分地区)
表:2013-2015年江南嘉捷产销情况(分产品)
图:江南嘉捷国外典型项目
图:2014-2015年江南嘉捷研发支出
图:2013-2015年江南嘉捷正在执行的有效订单金额
图:2015-2020E江南嘉捷营业收入及净利润
图:2013-2016年远大智能营业收入及净利润
表:2014-2015年远大智能营业收入(分产品)
表:2014-2015年远大智能营业收入构成(分产品)
图:2014-2015年远大智能营业收入(分地区)
图:2014-2015年远大智能营业收入构成(分地区)
图:2014-2015年远大智能毛利率
图:2014-2015年远大智能毛利率(分产品)
图:2014-2015年远大智能毛利率(分地区)
表:2014-2015年远大智能前五名客户销售情况
表:2014-2015年远大智能产销情况
表:远大智能国外典型项目
图:2013-2015年远大智能研发支出
图:2015-2020E远大智能营业收入及净利润
图:2012-2015年申龙电梯营业收入及净利润
图:2012-2014年申龙电梯营业收入(分产品)
图:2012-2014年申龙电梯营业收入(分地区)
图:2012-2014年申龙电梯营业收入构成(分地区)
图:2012-2014年申龙电梯毛利(分产品)
图:2012-2014年申龙电梯毛利率(分产品)
图:2012-2014年申龙电梯产能
图:2012-2014年申龙电梯销量(分产品)
图:2012-2014年申龙电梯产品单价
图:2012-2014年申龙电梯外销前五大客户
表:2012-2014年申龙电梯配件销售前五大客户
图:申龙电梯国外典型项目
图:2012-2014年申龙电梯研发支出
表:2015年申龙电梯IPO募集资金用途
图:2015E-2020E申龙电梯营业收入及净利润
表:东南电梯特种电梯产品应用案例
图:2013-2015年东南电梯营业收入及净利润
图:2013-2015年东南电梯营业收入(分产品)
图:2013-2015年东南电梯营业收入构成(分产品)
图:2013-2015年东南电梯营业收入(分地区)
图:2013-2015年东南电梯营收构成(分地区)
图:2013-2015年东南电梯毛利率
图:2013-2015年东南电梯毛利率(分产品)
表:2013-2015年东南电梯前五名客户销售额
图:东南电梯特种电梯典型项目
图:2013-2015年东南电梯研发支出
图:2015-2020E东南电梯营业收入及净利润
图:2013-2015年奔速电梯营业收入及净利润
图:2013-2015年奔速电梯营业收入(分业务)
图:2013-2015年奔速电梯营业收入构成(分业务)
图:2013-2015年奔速电梯毛利率
表:2014-2015年奔速电梯前五名客户
图:奔速电梯典型项目
图:2013-2015年奔速电梯研发支出
图:2015-2020E奔速电梯营业收入及净利润
图:2013-2015年信达智能营业收入及净利润
表:2013-2015年信达智能营业收入(分业务)
表:2013-2015年信达智能营业收入构成(分业务)
图:2013-2015年信达智能毛利率
表:2014-2015年信达智能前五名客户销售情况
图:信达智能典型项目
图:2013-2015年信达智能研发支出及占总营收比重
图:2015-2020E信达智能营业收入及净利润
表:莱茵电梯主要技术
表:莱茵电梯主要电梯产品
图:2013-2015年莱茵电梯营业收入及净利润
图:2013-2015年莱茵电梯营业收入(分业务)
图:2013-2015年莱茵电梯营业收入构成(分业务)
图:2013-2015年莱茵电梯营业收入(分地区)
图:2013-2015年莱茵电梯营业收入构成(分地区)
图:2013-2015年莱茵电梯毛利率
表:2013-2015年莱茵电梯前五名客户
图:2013-2015年莱茵电梯研发支出
图:2015-2020E莱茵电梯营业收入及净利润
图:2012-2016年Otis主要财务指标
表:奥的斯全球主要订单
表:奥的斯中国扩张历程
图:2009-2016年奥的斯在华主要电梯订单
表:2015年西子奥的斯主要财务指标
表:2011-2015年西子奥的斯主要电梯订单
图:2014-2015财年日立主要财务指标
图:2014-2015财年日立营业收入构成(分部门)
图:2014-2015财年日立营业收入(分地区)
图:2015年财年日立集团Social Infrastructure & Industrial Systems业务营业收入和营业利润
图:日立电梯业务全球布局
图:日立集团电梯业务发展历程
表:2015财年日立主要电梯项目
表:日立电梯(中国)有限公司简介
表:日立中国主要电梯制造基地
图:2011-2015年日立电梯(中国)营业收入及净利润
表:2011-2016年日立在华主要电梯订单
图:迅达集团发展历程
图:2014-2016年迅达集团主要财务指标
图:2011-2015年迅达集团未交付订单金额
图:2005-2015年迅达集团营业收入与未交付订单构成(分地区)
表:迅达中国发展历程
图:2015-2016年迅达集团主要在华订单
图:2014-2016财年蒂森订单额和销售额
表:2014-2016财年蒂森订单额(分业务)
表:2014-2016财年蒂森销售额(分业务)
图:2014-2016财年蒂森电梯业务订单额和销售额
表:蒂森在华发展历程
表:蒂森电梯在华生产基地
表:蒂森克虏伯在华主要电梯订单
图:2014-2015财年东芝主要财务指标
图:2014-2015财年东芝营业收入和营业利润(分业务)构成
表:东芝电梯业务发展历程
图:2014-2015财年东芝Community Solutions部门销售额及营业利润
图:东芝主要电梯项目
图:东芝主要扶梯项目
图:富士达全球布局情况
图:2014-2015财年富士达主要财务指标
图:2014-2015财年富士达营收构成(分地区)
图:2016财年富士达营业收入预测(分地区)
图:富士达中期经营计划
图:2014-2015年富士达订单情况
图:2013-2015财年富士达订单情况(分地区)
表:富士达主要电梯项目
图:富士达在华布局
表:富士达中国电梯生产基地
表:富士达在华主要电梯项目
图:通力全球业务分布
图:2013-2015年通力主要财务指标
图:2005-2015年通力营业收入构成(分地区)
图:2005-2015年通力营业收入构成(分业务)
图:通力在华主要公司
表:通力集团中国发展历程
表:2016年通力主要在华订单
Classification of Elevator Products
Main Components of Elevator
Laws and Regulations on Chinese Elevator Industry
Policies on Chinese Elevator Industry
Global Elevator Sales Volume, 2010-2020E
Global Elevator Sales Volume (by Region), 2010-2016E
Global Elevator Sales Volume (by Region), 2014-2015
Structure of Global Elevator Sales Volume (by Country), 2015
Share of Global Newly-Installed Elevator Orders (by Region), 2005-2015
Elevator Ownership per 1000 People and Utilization Rate in Major Countries, 2010-2030E
Global Elevator Ownership, 2013-2020E
Share of Global Elevator Ownership (by Region), 2015
KONE’s Maintenance Revenue as a Percentage of Total Revenue, 2005-2015
Global Elevator Market Share, 2015
KONE’s Revenue in China as a Percentage of Total Revenue, 2015
KONE’s M&A Cases and Their Influences
Schindler’s M&A Cases
Structure of Elevator Product
Market Share of High/Medium Speed Elevator Product in China, 2005-2015
China’s Elevator Sales Volume, 2012-2020E
Sales Volume of Major Chinese Elevator Enterprises, 2015
Structure of China’s Elevator Sales Volume (by Enterprise), 2015
Elevator Sales of Major Chinese Elevator Enterprises, 2015
New Elevator Market Share in China (by Enterprise), 2015
Elevator Maintenance Market Share in China, 2015
Elevator Ownership in China, 2015-2020E
Elevator Maintenance Market Size in China, 2015-2020E
Major Chinese Elevator Enterprises’Installation & Maintenance Revenue as a Percentage of Total Revenue
China’s Passenger Elevator/Escalator/Moving Walk Import Volume and Value, 2010-2015
Top 10 Countries by Passenger Elevator Import Volume in China, 2015
Top 10 Countries by Escalator/Moving Walk Import Volume in China, 2015
China’s Passenger Elevator/Escalator/Moving Walk Export Volume and Value, 2010-2015
Top 10 Chinese Provinces by Passenger Elevator Export Volume, 2015
Top 10 Chinese Provinces by Escalator/Moving Walk Export Volume, 2015
Top 10 Countries by Passenger Elevator Export Volume in China, 2015
Top 10 Countries by Escalator/Moving Walk Export Volume in China, 2015
China’s Passenger Elevator Import and Export Price, 2010-2015
China’s Escalator/Moving Walk Import and Export Price, 2010-2015
Market Share of Elevator Industry in China (by Enterprise), 2015
Comparison between Chinese and International Enterprises in High Speed Elevator Layout
Layout of Major Foreign Elevator Brands in China
Developments of Foreign Elevator Enterprises in China, 2011-2015
Comparison of Revenue from Major Chinese Elevator Enterprises, 2013-2016
Comparison of Net Income from Major Chinese Elevator Enterprises, 2013-2016
Elevator Downstream Demand Structure in China
Elevator Demand Market Components
Factors Influencing Elevator Demand Market Segments
Composition of Elevator Demand in China, 2015
Completed Investment in China’s Real Estate Development, 2010-2015
Growth of Commercial Residential Building Sales Area and Sales in China, 2014-2015
Density of Elevator Configuration in China, 2000-2015
Urbanization Rate in China, 2010-2015
Characteristics of Demand for Elevators under the New-type Urbanization
Proportion of Population Aged 60 or Above in China, 2010-2015
Urban Rail Transit in China
Total Operating Mileage of Urban Rail Transit in China, 2012-2015
Number of Elevators to Be Updated in China, 2010-2024E
Revenue and Net Income of Shanghai Mechanical & Electrical Industry, 2013-2016
Revenue Breakdown of Shanghai Mechanical & Electrical Industry (by Product), 2014-2015
Revenue Structure of Shanghai Mechanical & Electrical Industry (by Product), 2014-2015
Gross Margin of Shanghai Mechanical & Electrical Industry (by Product), 2014-2015
Shanghai Mechanical & Electrical Industry’s Revenue from Top 5 Customers, 2014-2015
Operating Performance of Shanghai Mitsubishi Elevator, 2014-2015
Installation & Maintenance Revenue of Shanghai Mitsubishi Elevator, 2014-2015
Milestones in Development of Shanghai Mitsubishi Elevator
Main Orders of Shanghai Mitsubishi Elevator
Operating Performance of Mitsubishi Electric Shanghai Electric Elevator, 2014-2015
Elevator Output and Sales Volume of Shanghai Mechanical & Electrical Industry, 2014-2015
R&D Costs and % of Total Revenue of Shanghai Mechanical & Electrical Industry, 2014-2015
Revenue and Net Income of Shanghai Mechanical & Electrical Industry, 2015-2020E
Revenue and Net Income of Guangzhou Guangri Stock, 2013-2016
Revenue Breakdown of Guangzhou Guangri Stock (by Product), 2014-2015
Revenue Breakdown of Guangzhou Guangri Stock (by Region), 2014-2015
Gross Margin of Guangzhou Guangri Stock, 2014-2015
Gross Margin of Guangzhou Guangri Stock (by Product), 2014-2015
Gross Margin of Guangzhou Guangri Stock (by Region), 2014-2015
Guangzhou Guangri Stock’s Revenue from Top 5 Customers, 2014-2015
Main Production Bases of Guangzhou Guangri Stock
Financial Indexes of Guangzhou Guangri Elevator Industry, 2014-2015
Typical Projects of Guangzhou Guangri Elevator Industry
Production and Sales of Guangzhou Guangri Stock, 2015
R&D Costs and % of Total Revenue of Guangzhou Guangri Stock, 2013-2015
Guangzhou Guangri Stock’s Layout in Industry 4.0 Intelligence Platform
Revenue and Net Income of Guangzhou Guangri Stock, 2015-2020E
Production Base Layout of Canny Elevator
Global Layout of Canny Elevator
Revenue and Net Income of Canny Elevator, 2013-2016
Revenue Breakdown of Canny Elevator (by Product), 2014-2015
Revenue Structure of Canny Elevator (by Product), 2014-2015
Revenue Breakdown of Canny Elevator (by Region), 2014-2015
Revenue Structure of Canny Elevator (by Region), 2014-2015
Main Overseas Projects of Canny Elevator
Gross Margin of Canny Elevator, 2014-2015
Gross Margin of Canny Elevator (by Product), 2014-2015
Gross Margin of Canny Elevator (by Region), 2014-2015
Canny Elevator’s Revenue from Top 5 Customers, 2014-2015
Major Customers of Canny Elevator
Output and Sales Volume of Canny Elevator, 2014-2015
Typical Projects of Canny Elevator
R&D Costs and % of Total Revenue of Canny Elevator, 2013-2015
Revenue and Net Income of Canny Elevator, 2015-2020E
Revenue and Net Income of SJEC Corporation, 2013-2016
Revenue Breakdown of SJEC Corporation (by Product), 2014-2015
Revenue Structure of SJEC Corporation (by Product), 2015
Revenue Breakdown of SJEC Corporation (by Region), 2014-2015
Revenue Structure of SJEC Corporation (by Region), 2014-2015
Gross Margin of SJEC Corporation (by Product), 2014-2015
Gross Margin of SJEC Corporation (by Region), 2014-2015
Production and Sales of SJEC Corporation (by Product), 2013-2015
Typical Overseas Projects of SJEC Corporation
R&D Costs of SJEC Corporation, 2014-2015
Amount of Valid Orders Being Executed by SJEC Corporation, 2013-2015
Revenue and Net Income of SJEC Corporation, 2015-2020E
Revenue and Net Income of Shenyang Yuanda Intellectual Industry Group, 2013-2016
Revenue Breakdown of Shenyang Yuanda Intellectual Industry Group (by Product), 2014-2015
Revenue Structure of Shenyang Yuanda Intellectual Industry Group (by Product), 2014-2015
Revenue Breakdown of Shenyang Yuanda Intellectual Industry Group (by Region), 2014-2015
Revenue Structure of Shenyang Yuanda Intellectual Industry Group (by Region), 2014-2015
Gross Margin of Shenyang Yuanda Intellectual Industry Group, 2014-2015
Gross Margin of Shenyang Yuanda Intellectual Industry Group (by Product), 2014-2015
Gross Margin of Shenyang Yuanda Intellectual Industry Group (by Region), 2014-2015
Shenyang Yuanda Intellectual Industry Group’s Revenue from Top 5 Customers, 2014-2015
Production and Sales of Shenyang Yuanda Intellectual Industry Group, 2014-2015
Typical Overseas Projects of Shenyang Yuanda Intellectual Industry Group
R&D Costs of Shenyang Yuanda Intellectual Industry Group, 2013-2015
Revenue and Net Income of Shenyang Yuanda Intellectual Industry Group, 2015-2020E
Revenue and Net Income of Shenlong Elevator, 2012-2015
Revenue Breakdown of Shenlong Elevator (by Product), 2012-2014
Revenue Breakdown of Shenlong Elevator (by Region), 2012-2014
Revenue Structure of Shenlong Elevator (by Product), 2012-2014
Gross Profit of Shenlong Elevator (by Product), 2012-2014
Gross Margin of Shenlong Elevator (by Product), 2012-2014
Output of Shenlong Elevator, 2012-2014
Sales Volume of Shenlong Elevator (by Product), 2012-2014
Unit Product Price of Shenlong Elevator, 2012-2014
Top 5 Export Customers of Shenlong Elevator, 2012-2014
Top 5 Accessories Sales Customers of Shenlong Elevator, 2012-2014
Typical Overseas Projects of Shenlong Elevator
R&D Costs of Shenlong Elevator, 2012-2014
Use of Shenlong Elevator’s IPO Raised Funds, 2015
Revenue and Net Income of Shenlong Elevator, 2015-2020E
Application Cases of Dongnan Elevator’s Special Elevator Products
Revenue and Net Income of Dongnan Elevator, 2013-2015
Revenue Breakdown of Dongnan Elevator (by Product), 2013-2015
Revenue Structure of Dongnan Elevator (by Product), 2013-2015
Revenue Breakdown of Dongnan Elevator (by Region), 2013-2015
Revenue Structure of Dongnan Elevator (by Region), 2013-2015
Gross Margin of Dongnan Elevator, 2013-2015
Gross Margin of Dongnan Elevator (by Product), 2013-2015
Dongnan Elevator’s Revenue from Top 5 Customers, 2013-2015
Typical Projects for Special Elevators of Dongnan Elevator
R&D Costs of Dongnan Elevator, 2013-2015
Revenue and Net Income of Dongnan Elevator, 2015-2020E
Revenue and Net Income of Shandong Bunse Elevator, 2013-2015
Revenue Breakdown of Shandong Bunse Elevator (by Business), 2013-2015
Revenue Structure of Shandong Bunse Elevator (by Business), 2013-2015
Gross Margin of Shandong Bunse Elevator, 2013-2015
Top 5 Customers of Shandong Bunse Elevator, 2014-2015
Typical Projects of Shandong Bunse Elevator
R&D Costs of Shandong Bunse Elevator, 2013-2015
Revenue and Net Income of Shandong Bunse Elevator, 2015-2020E
Revenue and Net Income of Hunan Sinda Elevator, 2013-2015
Revenue Breakdown of Hunan Sinda Elevator (by Business), 2013-2015
Revenue Structure of Hunan Sinda Elevator (by Business), 2013-2015
Gross Margin of Hunan Sinda Elevator, 2013-2015
Hunan Sinda Elevator’s Revenue from Top 5 Customers, 2014-2015
Typical Projects of Hunan Sinda Elevator
R&D Costs and % of Total Revenue of Hunan Sinda Elevator, 2013-2015
Revenue and Net Income of Hunan Sinda Elevator, 2015-2020E
Main Technologies of Rhine Lift
Main Elevator Products of Rhine Lift
Revenue and Net Income of Rhine Lift,2013-2015
Revenue Breakdown of Rhine Lift (by Business), 2013-2015
Revenue Structure of Rhine Lift (by Business), 2013-2015
Revenue Breakdown of Rhine Lift (by Region), 2013-2015
Revenue Structure of Rhine Lift (by Region), 2013-2015
Gross Margin of Rhine Lift, 2013-2015
Top 5 Customers of Rhine Lift, 2013-2015
R&D Costs of Rhine Lift,2013-2015
Revenue and Net Income of Rhine Lift, 2015-2020E
Main Financial Indexes ofOtis, 2012-2016
Major Orders for Otis Worldwide
Expansion Process of Otis in China
Major Elevator Orders for Otis in China, 2009-2016
Main Financial Indexes ofXizi Otis, 2015
Major Elevator Orders for Xizi Otis, 2011-2015
Main Financial Indexes ofHitachi, FY2014-FY2015
Revenue Structure of Hitachi (by Division), FY2014-FY2015
Revenue Breakdown of Hitachi (by Region), FY2014-FY2015
Revenue and Operating Income of Hitachi’s Social Infrastructure & Industrial Systems, FY2015
Global Layout of Hitachi Elevators
Development History of Hitachi Elevators
Main Elevator Projects of Hitachi, FY2015
Profile of Hitachi Elevator (China)
Major Elevator Manufacturing Bases of Hitachi in China
Revenue and Net Income of Hitachi Elevator (China), 2011-2015
Main Elevator Orders of Hitachi in China, 2011-2016
Development History of Schindler
Main Financial Indexes of Schindler, 2014-2016
Amount of Schindler’sUndelivered Orders, 2011-2015
Structure of Schindler’s Revenue and Undelivered Orders (by Region), 2005-2015
Development Course of Schindler China
Main Orders of Schindler in China, 2015-2016
Order Amount and Sales of ThyssenKrupp, FY2014-FY2016
Order Amount of ThyssenKrupp (by Business), FY2014-FY2016
Sales of ThyssenKrupp (by Business), FY2014-FY2016
Order Amount and Sales of ThyssenKrupp Elevators, FY2014-FY2016
Development Course of ThyssenKrupp in China
Production Bases of ThyssenKrupp Elevator in China
Main Elevator Orders of ThyssenKrupp in China
Main Financial Indexes of Toshiba, FY2015-FY2016
Revenue and Operating Income Structure of Toshiba (by Business), FY2014-FY2015
Development History of Toshiba Elevators
Sales and Operating Income of Toshiba Community Solutions, FY2014-FY2015
Main Elevator Projects of Toshiba
Main Escalator Projects of Toshiba
Global Layout of Fujitec
Main Financial Indexes of Fujitec, FY2014-FY2015
Revenue Structure of Fujitec (by Region), FY2014-FY2015
Revenue Breakdown of Fujitec (by Region), FY2016E
Medium-term Business Plan for Fujitec
Orders of Fujitec, 2014-2015
Orders of Fujitec (by Region), FY2013-FY2015
Main Elevator Projects of Fujitec
Layout of Fujitec in China
Elevator Manufacturing Bases of Fujitec in China
Main Elevator Projects of Fujitec in China
Global Business Distribution of KONE
Main Financial Indexes of KONE, 2013-2015
Revenue Structure of KONE (by Region), 2005-2015
Revenue Structure of KONE (by Business), 2005-2015
Dominant Companies of KONE in China
Development History of KONE in China
Main Orders of KONE in China, 2016
如果这份报告不能满足您的要求,我们还可以为您定制报告,请 留言说明您的详细需求。
|